Bitget App
Trade smarter

Hold on! We still need to look at the Bitcoin five-line chart at a critical moment
CryptoChan2024/09/14 03:14
By:CryptoChan
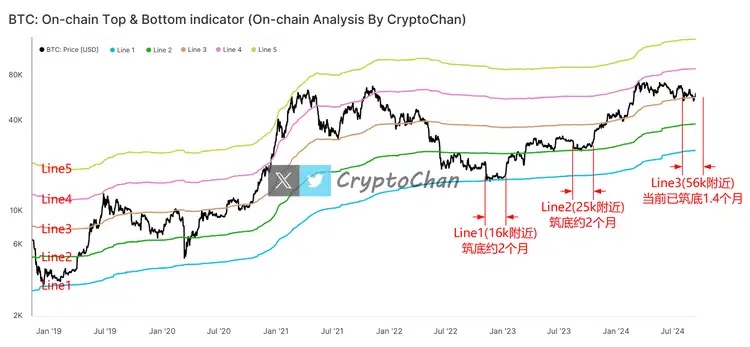
From November to December 2022, BTC bottomed out at Line 1 (around 16k) for about 2 months
From August to October 2023, BTC bottomed out at Line 2 (around 25k) for about 2 months
Currently, BTC has bottomed out at Line 3 (around 56K) for about 1.4 months
The figure shows a set of Bitcoin price cycle models. The model is designed based on on-chain data such as Coin Days Destroyed, Liquid Supply, and Realized Price. It uses 5 lines to completely divide the entire historical coin price from top to bottom.
0
1
Disclaimer: The content of this article solely reflects the author's opinion and does not represent the platform in any capacity. This article is not intended to serve as a reference for making investment decisions.
You may also like
Stablecoins Evolve from Trading Tools to Global Financial Pillars
TheCryptoUpdates•2025/09/13 09:18


Japan To Cut Crypto Tax From 55 Percent To 20 Percent
coinfomania•2025/09/13 08:09
Bitcoin Dominance Slips To Lowest Level Since February
coinfomania•2025/09/13 08:09