Bitget App
Trade smarter

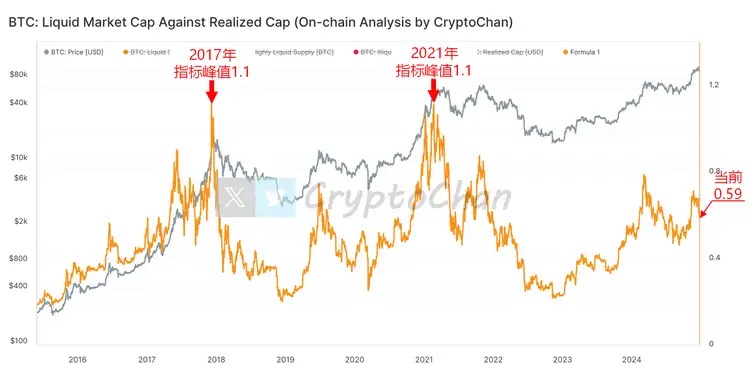
The liquidity indicator on the BTC chain is only 0.59, and the potential of the bull market is ready to go
CryptoChan2024/12/23 09:33
By:CryptoChan
According to the latest data from on-chain analyst CryptoChan, the current "on-chain liquidity market cap/total on-chain buying cost market cap" indicator for BTC is 0.59, which is still significantly lower than the peak value of 1.1 in the bull market in 2017 and 2021. Compared with historical performance, this means that the current market has not yet reached an overheated state, and the potential of the bull market is still unleashing space.
From the chart, it can be seen that the gray curve represents the price trend of BTC, while the orange curve represents the on-chain liquidity indicator. In 2017 and 2021, when this indicator reached its peak of 1.1, it corresponded to the historical high point of BTC. The current value is only 0.59, indicating that the market active level is still in a moderate growth stage, and there is still significant room for improvement from the market top.
The definition of liquid BTC: If the "historical cumulative outflow of BTC/historical cumulative inflow of BTC > 0.25" of a Bitcoin address, then the BTC in that address is defined as "liquid BTC". This indicator mainly excludes the static influence of long-term holders and accurately reflects the level of on-chain fund activity.
The coordinated trend of on-chain data and BTC price seems to be in a critical period of accumulating strength for the next round of market trends. With the further improvement of indicators, market heat and liquidity will become the key driving factors for the next market trend.
1
1
Disclaimer: The content of this article solely reflects the author's opinion and does not represent the platform in any capacity. This article is not intended to serve as a reference for making investment decisions.
You may also like
Senate Evaluates Trump’s CFTC Chair Nominee
Coinlive•2025/07/20 20:20
WLFI Tokens Restrict Founder Unlocks at Launch
Coinlineup•2025/07/20 20:15

Bitcoin Standard Treasury Reserve Lists on Nasdaq
Coinlineup•2025/07/20 20:15

SharpLink Gaming Leads $1.4B Ethereum Accumulation Surge
Coinlineup•2025/07/20 20:15