Cosmos (ATOM) To Rise Further? Double Bottom Pattern Signaling an Upside Move

Date: Sat, May 10, 2025 | 10:58 AM GMT
The cryptocurrency market continues to build on its recent strength, with Bitcoin (BTC) and Ethereum (ETH) leading the charge. BTC has crossed the $103K mark, while ETH has soared more than 52% in the past 30 days, now trading near $2,400 — its highest level in months. This bullish wave is spilling into altcoins too, including Cosmos (ATOM).
ATOM is currently up over 14% in its monthly gain and now trading near $5. The altcoin is showing strong bullish structure — and based on the current chart, this rally might just be getting started.
 Source: Coinmarketcap
Double Bottom Pattern Signal
A closer look at the daily chart reveals a highly promising technical structure — a double bottom pattern, a bullish reversal signal that often emerges at the tail-end of prolonged downtrends.
The first bottom of this pattern formed back in April 2024, after ATOM was rejected near the $10.69 mark, leading to a brutal selloff. After bottoming out, ATOM staged a powerful 190% rally, once again peaking around $10.69 in December. However, that rally eventually ran out of steam, and ATOM retraced nearly 68%, revisiting the critical support level around $3.66 — establishing the second bottom.
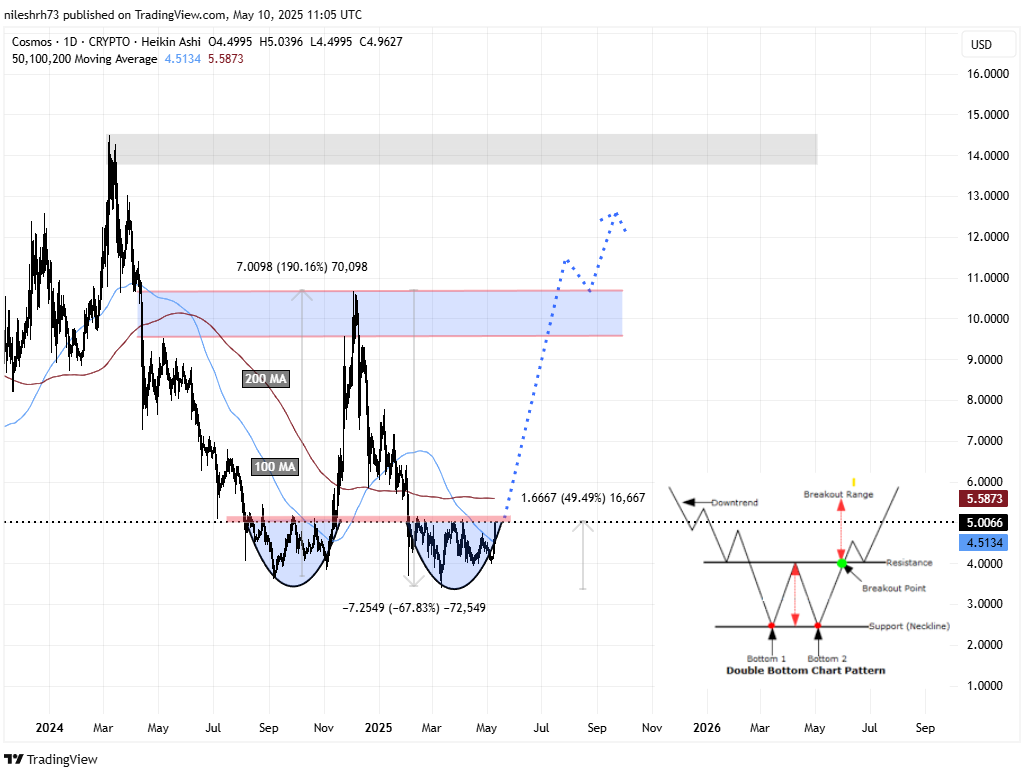 Cosmos (ATOM) Daily Chart/Coinsprobe (Source: Tradingview)
Following this important support retest, ATOM bounced sharply, surging over 49% and currently trading near $5. This current recovery strongly resembles its previous move — with price now reclaiming its 100-day moving average (MA) and knocking on the door of the red resistance zone once again.
What’s Next for ATOM?
Right now, the structure is echoing the setup from the first bottom rally. ATOM has already reclaimed its 100-day MA and is now attempting a breakout from the horizontal resistance zone near $5.19.
If bullish momentum persists and ATOM manages to decisively break above this level, the next key resistance to watch is the 200-day MA, currently sitting at $5.58. A breakout above this level would likely confirm a full trend reversal, opening the doors to a potential rally toward the neckline zone at $10.69 — which represents a 112% upside from the current price.
Disclaimer: This article is for informational purposes only and not financial advice. Always conduct your own research before investing in cryptocurrencies.
Disclaimer: The content of this article solely reflects the author's opinion and does not represent the platform in any capacity. This article is not intended to serve as a reference for making investment decisions.
You may also like
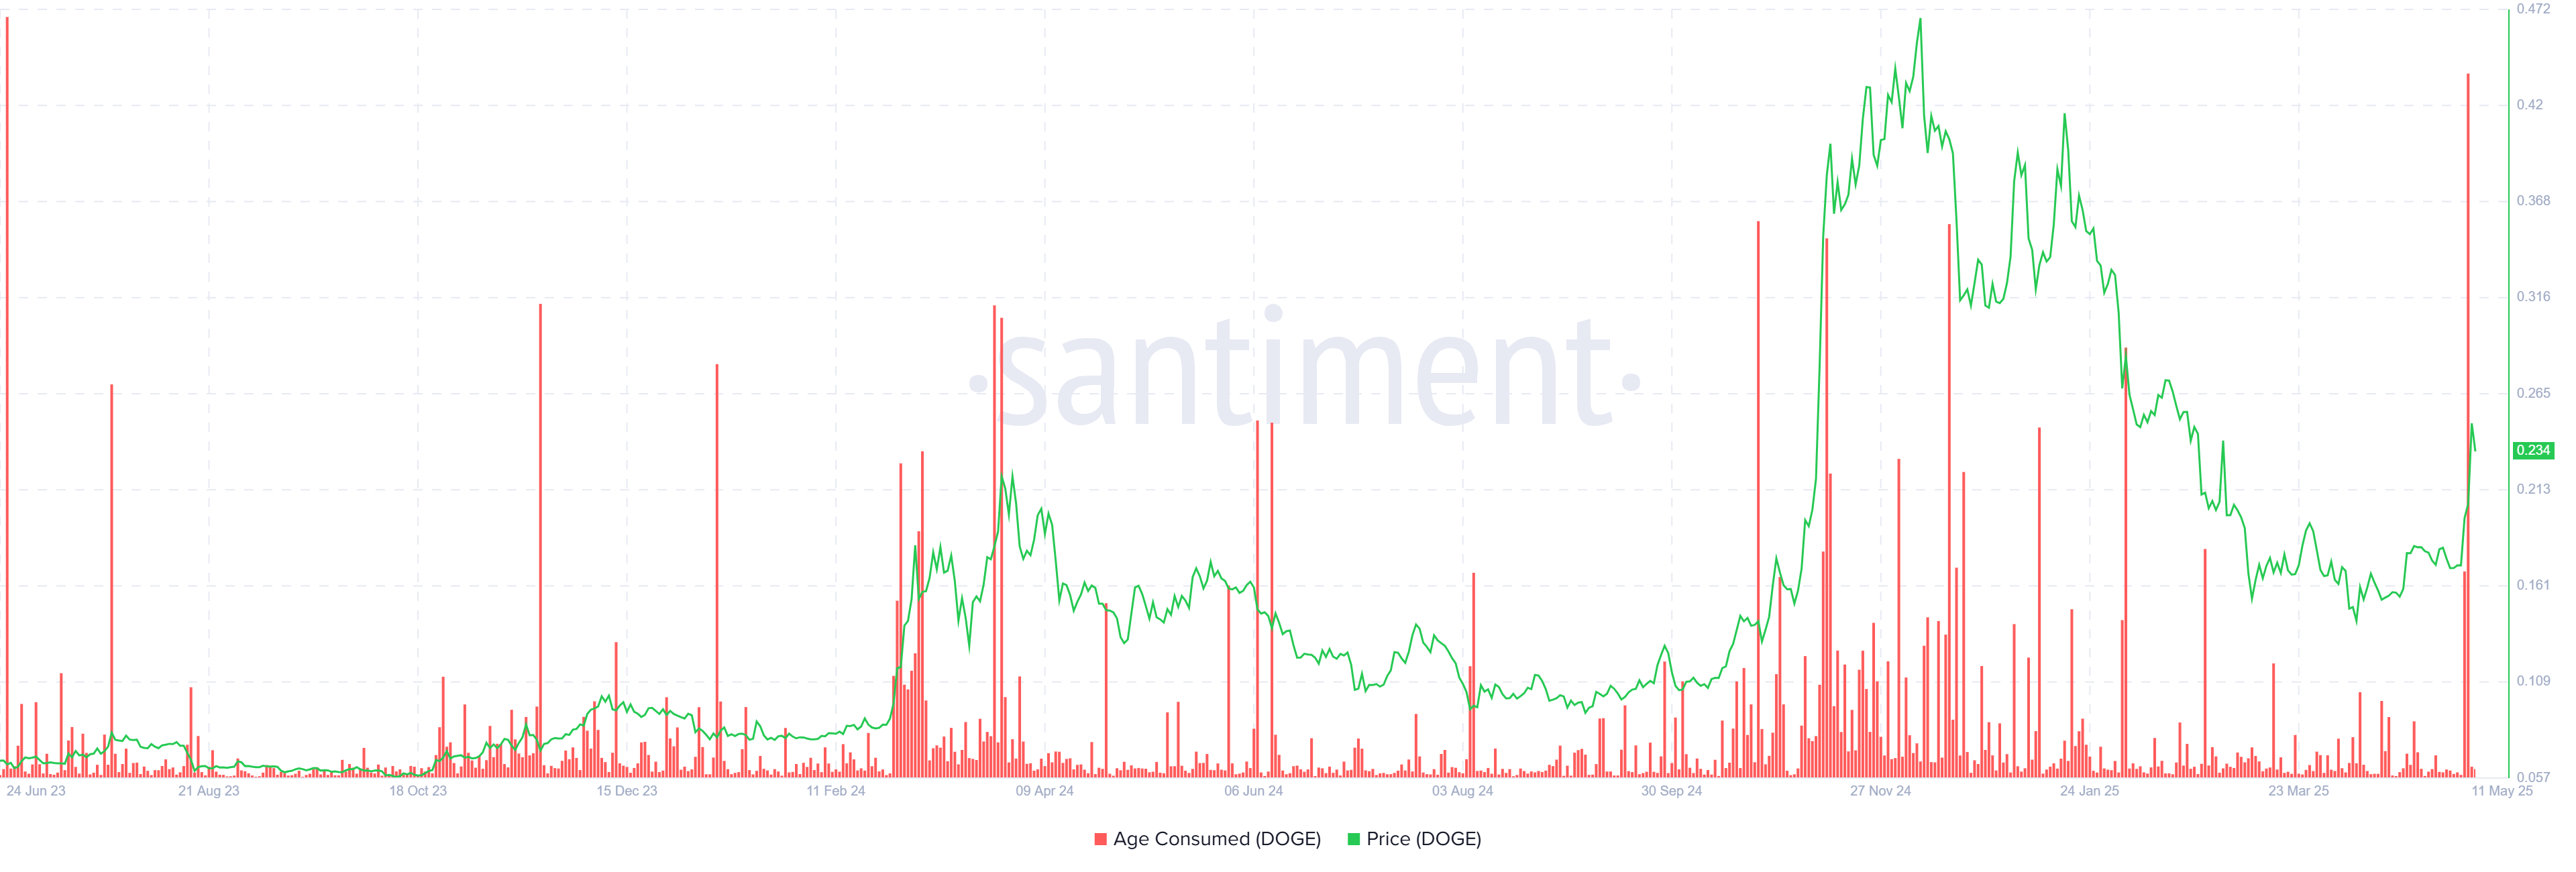
Dogecoin Faces Selling Pressure as Long-Term Holders Liquidate Positions Amid Recent Gains
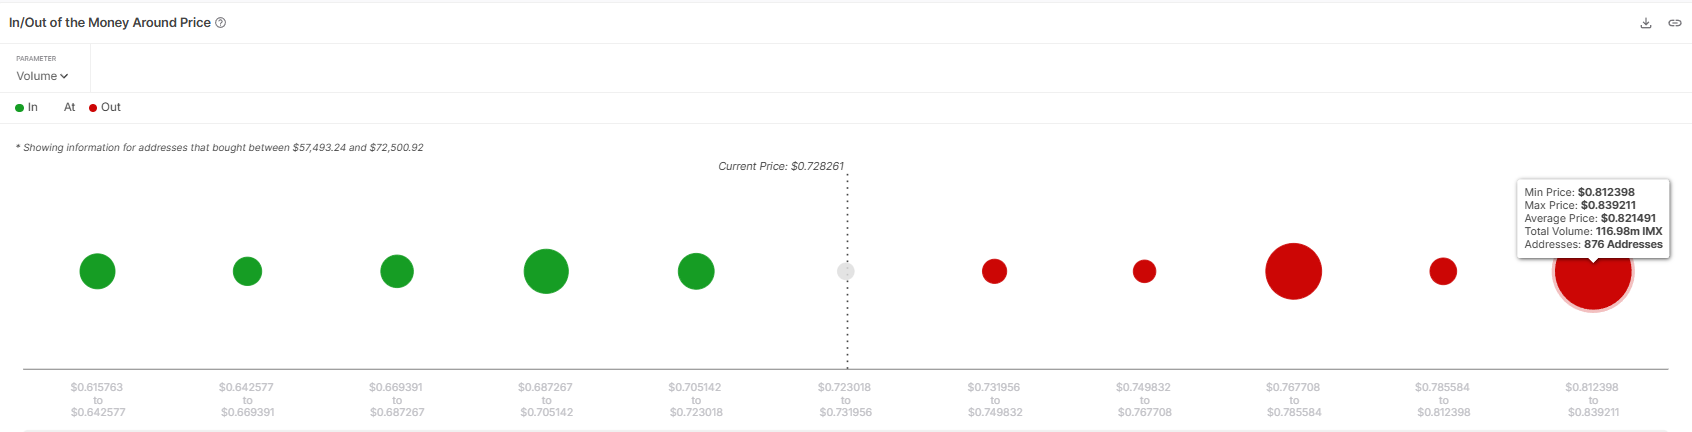
IMX Seeks Breakout as Positive Inflows Signal Potential for Resistance Break at $0.81
Bitget Daily Digest (May 12)|Substantial Progress in U.S.-China Trade Talks, Altseason Index Hits 90-Day High
Expectations of reconciliation are heating up, the market is strengthening, and Ethereum is leading a broad rise in the altcoin market.

Pi Coin Surges Dramatically, Capturing Market Attention
In Brief Pi Coin rose 34% in 24 hours, reaching $0.98 but challenging $1 resistance. Trading volume and liquidity suggest possible resistance breakthroughs for the altcoin. Upcoming announcements and exchange listings could push Pi Coin to new highs.