Sei (SEI) Retesting Bullish Pattern Breakout – Is a Rebound Next?

Date: Sat, May 17, 2025 | 11:40 AM GMT
The cryptocurrency market has mounted a solid comeback in recent weeks, with Ethereum (ETH) continuing to lead the charge. ETH has surged more than 55% in the past month and is now trading below $2,500 after making a high of $2,700 — a level not seen since early January. This bullish momentum is uplifting sentiment across altcoins, including Sei (SEI).
SEI has posted impressive monthly gains of over 33%, though it currently trades slightly lower on the day — down around 7%. But this pullback is drawing attention, as the token is now retesting a key breakout level, raising the possibility of a strong bounce back.
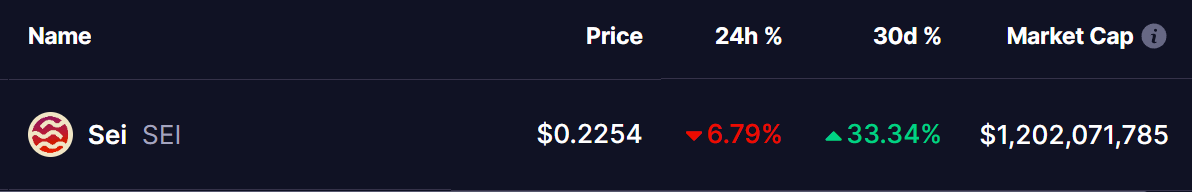 Source: Coinmarketcap
Retesting Inverse Head and Shoulders Breakout
The daily chart for SEI clearly shows a well-formed inverse head and shoulders pattern — a classic bullish reversal signal. This pattern usually signals the end of a downtrend and the beginning of a potential uptrend.
SEI confirmed the breakout earlier this month when it rallied from the right shoulder at around $0.19, breaking above the neckline resistance near $0.2290. That breakout pushed the price to a local high of $0.2749.
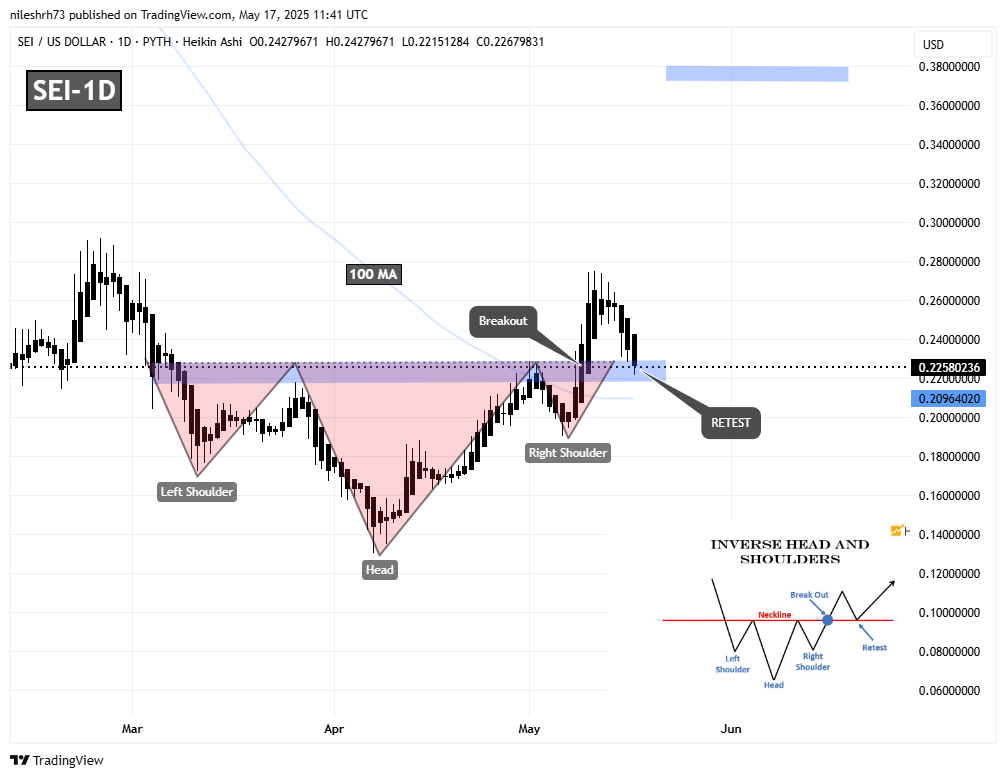 Sei (SEI) Daily Chart/Coinsprobe (Source: Tradingview)
But after facing resistance near that high, SEI dropped over 15%, bringing the price back toward the $0.22 zone. This zone, which previously acted as strong resistance, is now being retested as support — a crucial step in validating the breakout.
Is SEI Ready for a Rebound?
This current retest of the neckline support is critical.
- If $0.22 holds as support, and buyers step in, SEI could resume its uptrend.
- A confirmed bounce would likely take the price back to the previous high of $0.2749.
- If momentum continues, the measured move from the inverse head and shoulders pattern could push SEI up to around $0.38 — a potential 68% gain from current levels.
However, if SEI fails to hold the neckline and closes below $0.22, the bullish setup could be invalidated, and the price might revisit the 100-day moving average, currently sitting lower on the chart, before finding new support.
If Ethereum continues to climb and altcoins maintain strength, SEI could see a solid rebound off this retest zone.
Disclaimer: This article is for informational purposes only and not financial advice. Always conduct your own research before investing in cryptocurrencies.
Disclaimer: The content of this article solely reflects the author's opinion and does not represent the platform in any capacity. This article is not intended to serve as a reference for making investment decisions.
You may also like
CME Group set to launch XRP futures on Monday amid legal setback for SEC and Ripple

PEPE Holds Channel Support as Rally Eyes $0.00025620 With 40x Gain Potential

APT Holds $5.20 Retest Zone and Aims for $6.20 and $7.40 Price Targets

Cardano About to Explode? Watch $0.80 Closely
