Bitcoin bulls should 'be careful with longs' as BTC price risks $100K breakdown

A potential inverse head-and-shoulders pattern suggests Bitcoin could retest $91,000 before any meaningful bullish breakout resumes.
Key takeaways:
-
Bitcoin dropped over 4.5% on May 19, confirming a bearish divergence and threatening a break below $100,000.
-
Analysts highlight $97,000–$98,500 as key support that the bulls must hold.
-
A potential inverse head-and-shoulders pattern points to a retest of $91,000 before any bullish continuation.
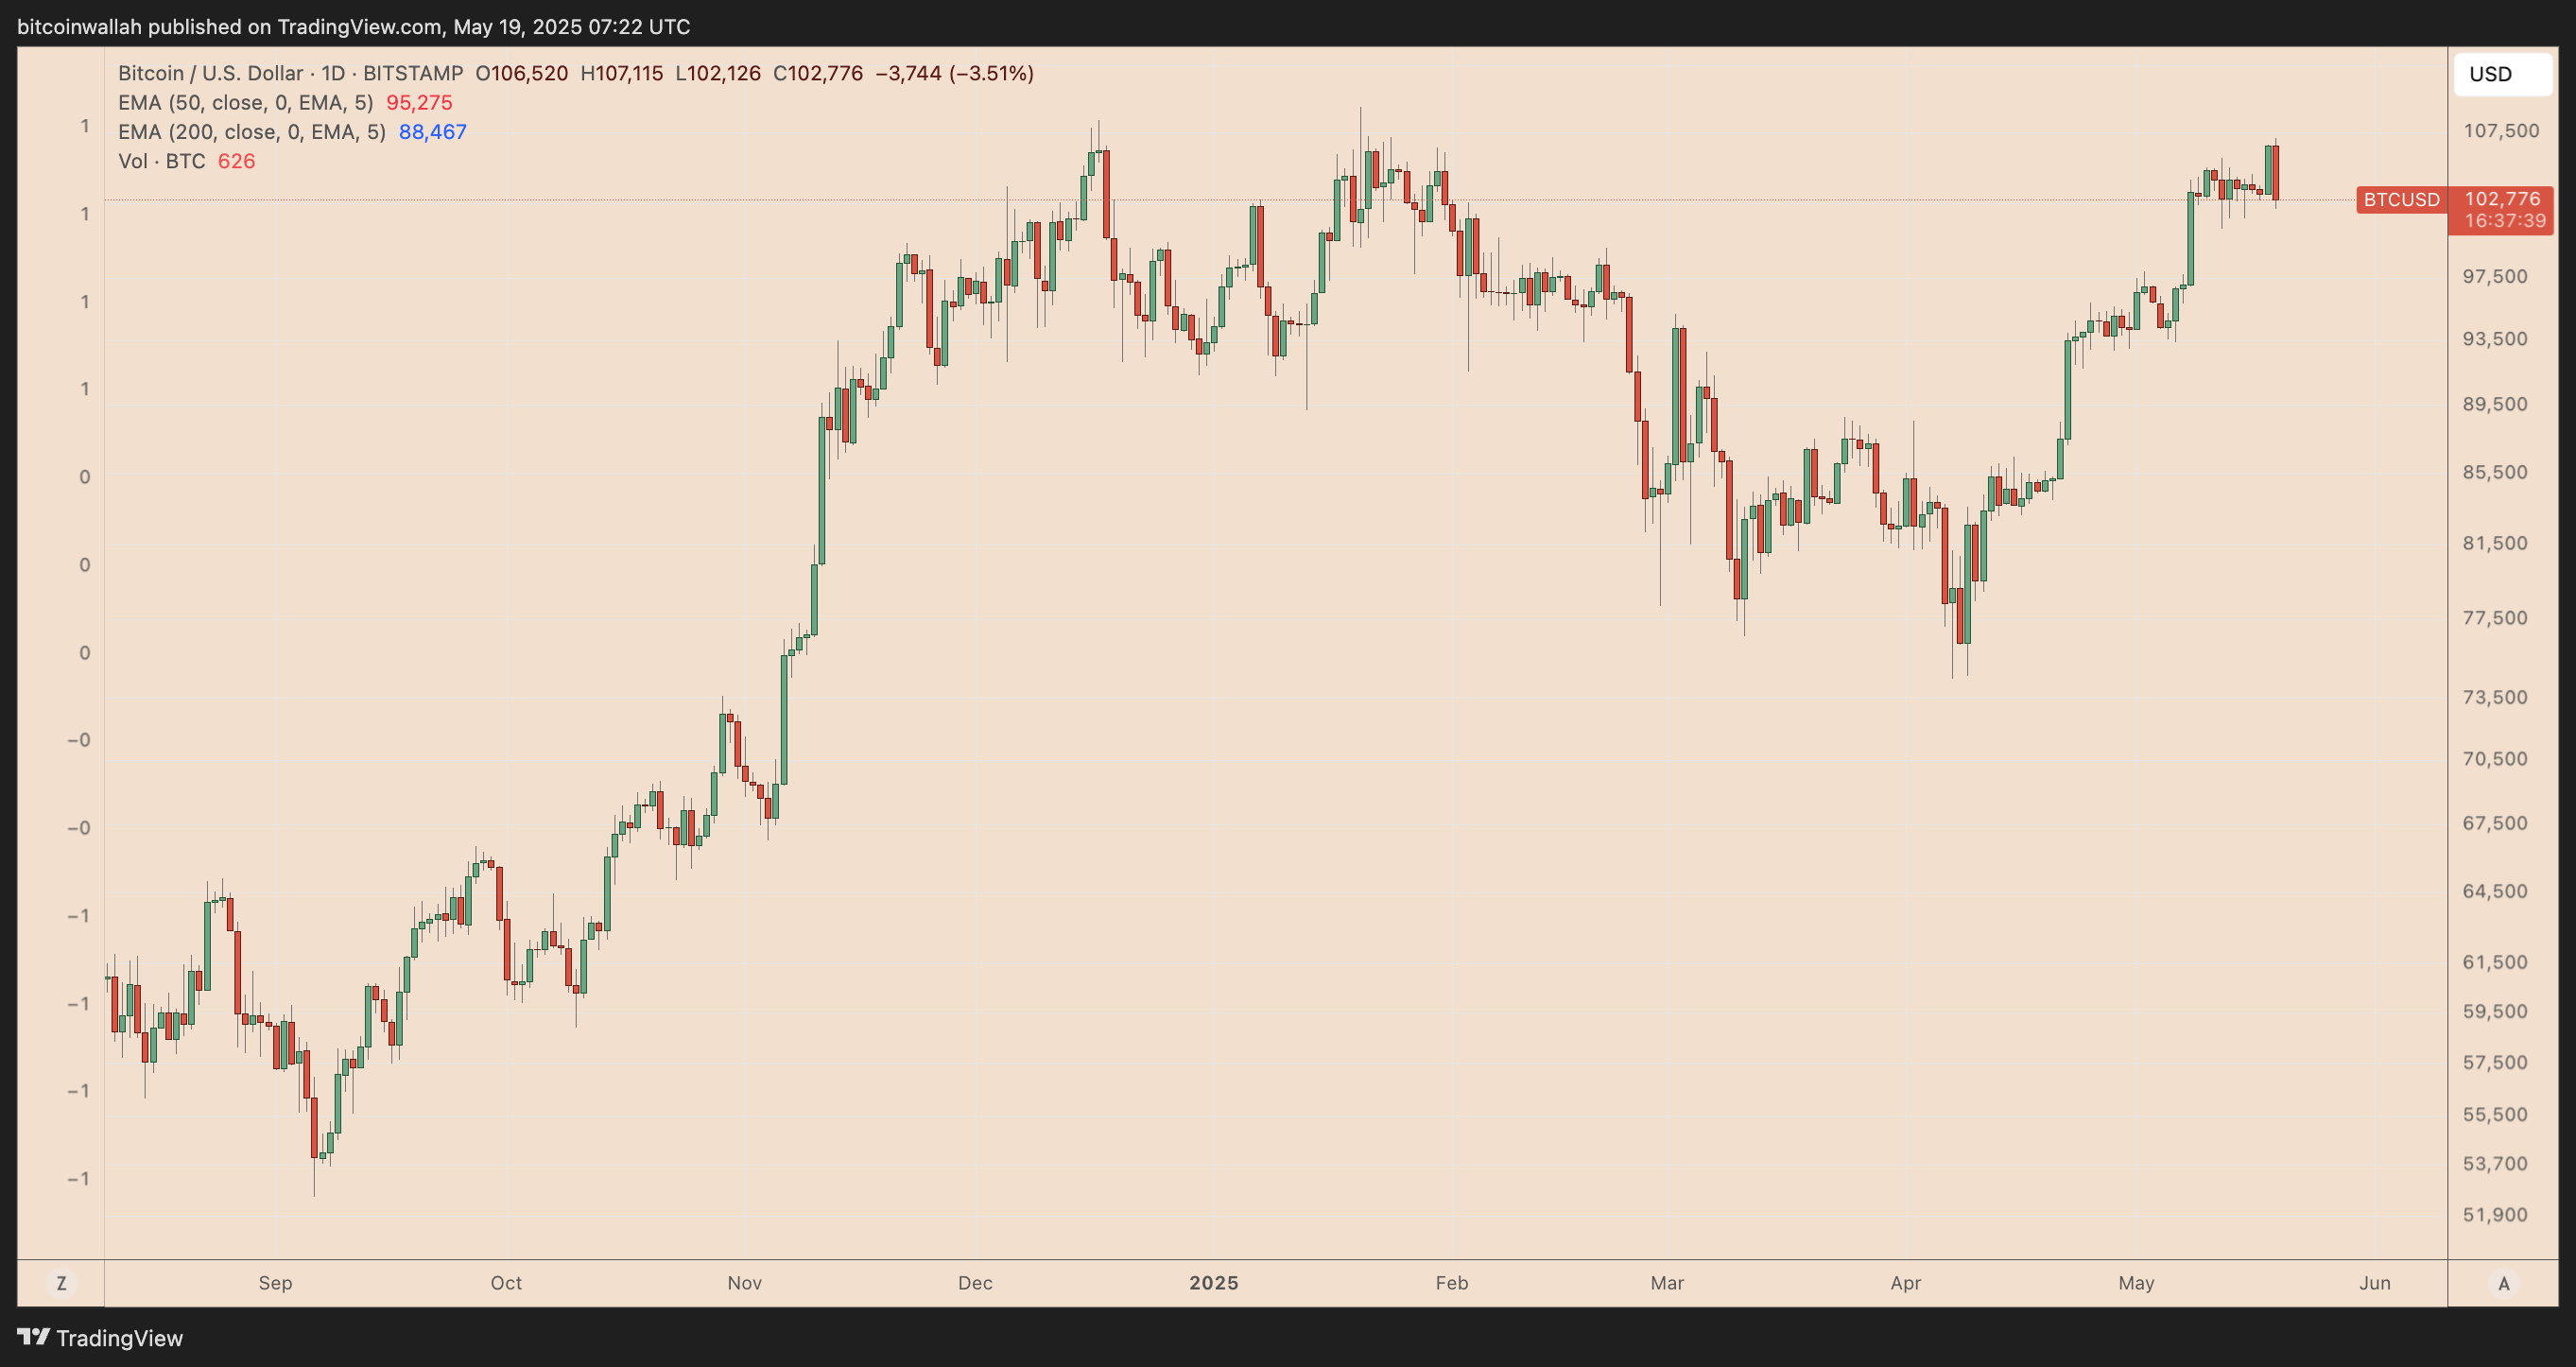
Bitcoin ( BTC ) is down over 4.5% from its intraday high on May 19, falling to around $102,000 in its worst daily drop in over a month.
BTC’s drop accompanied downside moves elsewhere in the risk market, prompted by Moody’s latest downgrade of the US government due to a rising budget deficit and the lack of a credible fiscal consolidation plan.
The decline confirms a bearish divergence and, combined with other technical factors, raises the risk of a BTC price breakdown below $100,000, a key support level.
Bitcoin’s bearish divergence hints at sub-$100K
Bitcoin’s price action showed technical weakness ahead of its May 19 sell-off.
On May 19, BTC pushed to a new local high above $107,000, but its relative strength index (RSI) printed a lower high, confirming a classic bearish divergence.

This discrepancy between price and momentum is often a precursor to a trend reversal, and in this case, it played out with a swift 4.5% intraday decline. Analyst Bluntz warned traders to “be careful with [placing] longs.”
Swissblock analysts observed that Bitcoin “grabbed liquidity” above the $104,000–$106,000 resistance range but failed to sustain a breakout.
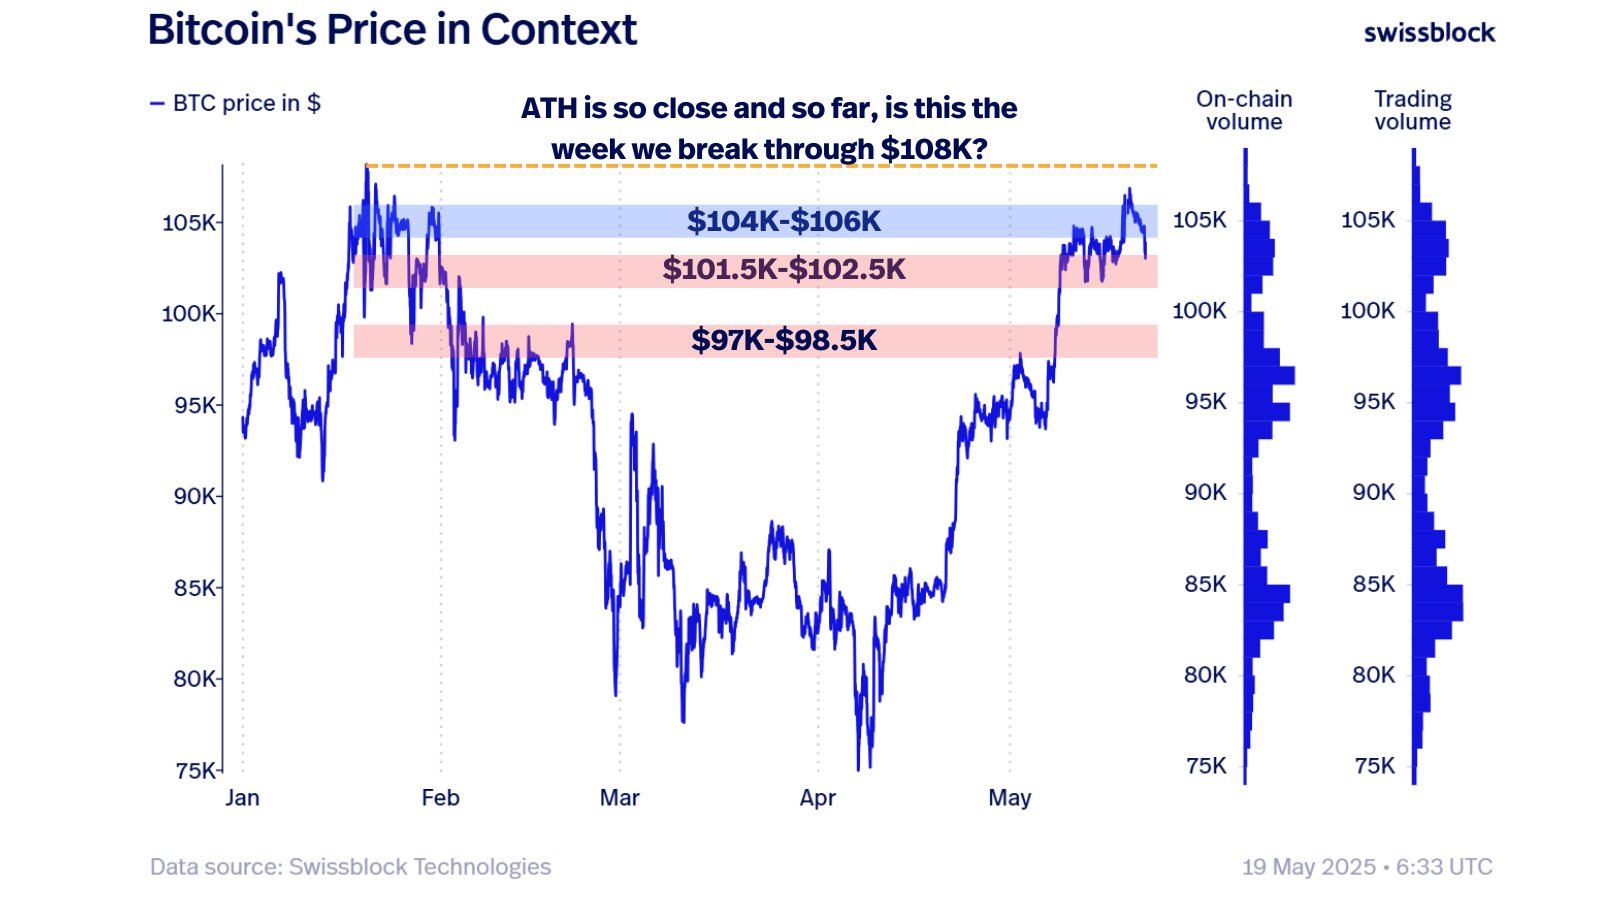
The rejection pushed the price back into a prior volume-heavy zone, with immediate support between $101,500 and $102,500 now under pressure.
Swissblock identifies the $97,000–$98,500 range as a key downside target based on historical onchain volume and trading activity if the $101,500-102,500 area fails to hold.
Bitcoin’s HS pattern targets $91,000
On the three-day chart, Bitcoin is forming the right shoulder of a potential inverse-head-and-shoulders pattern.
While typically bullish in the long term, this setup implies a short-term retest of the 50-period exponential moving average (50-period EMA; the red wave) near $91,000.
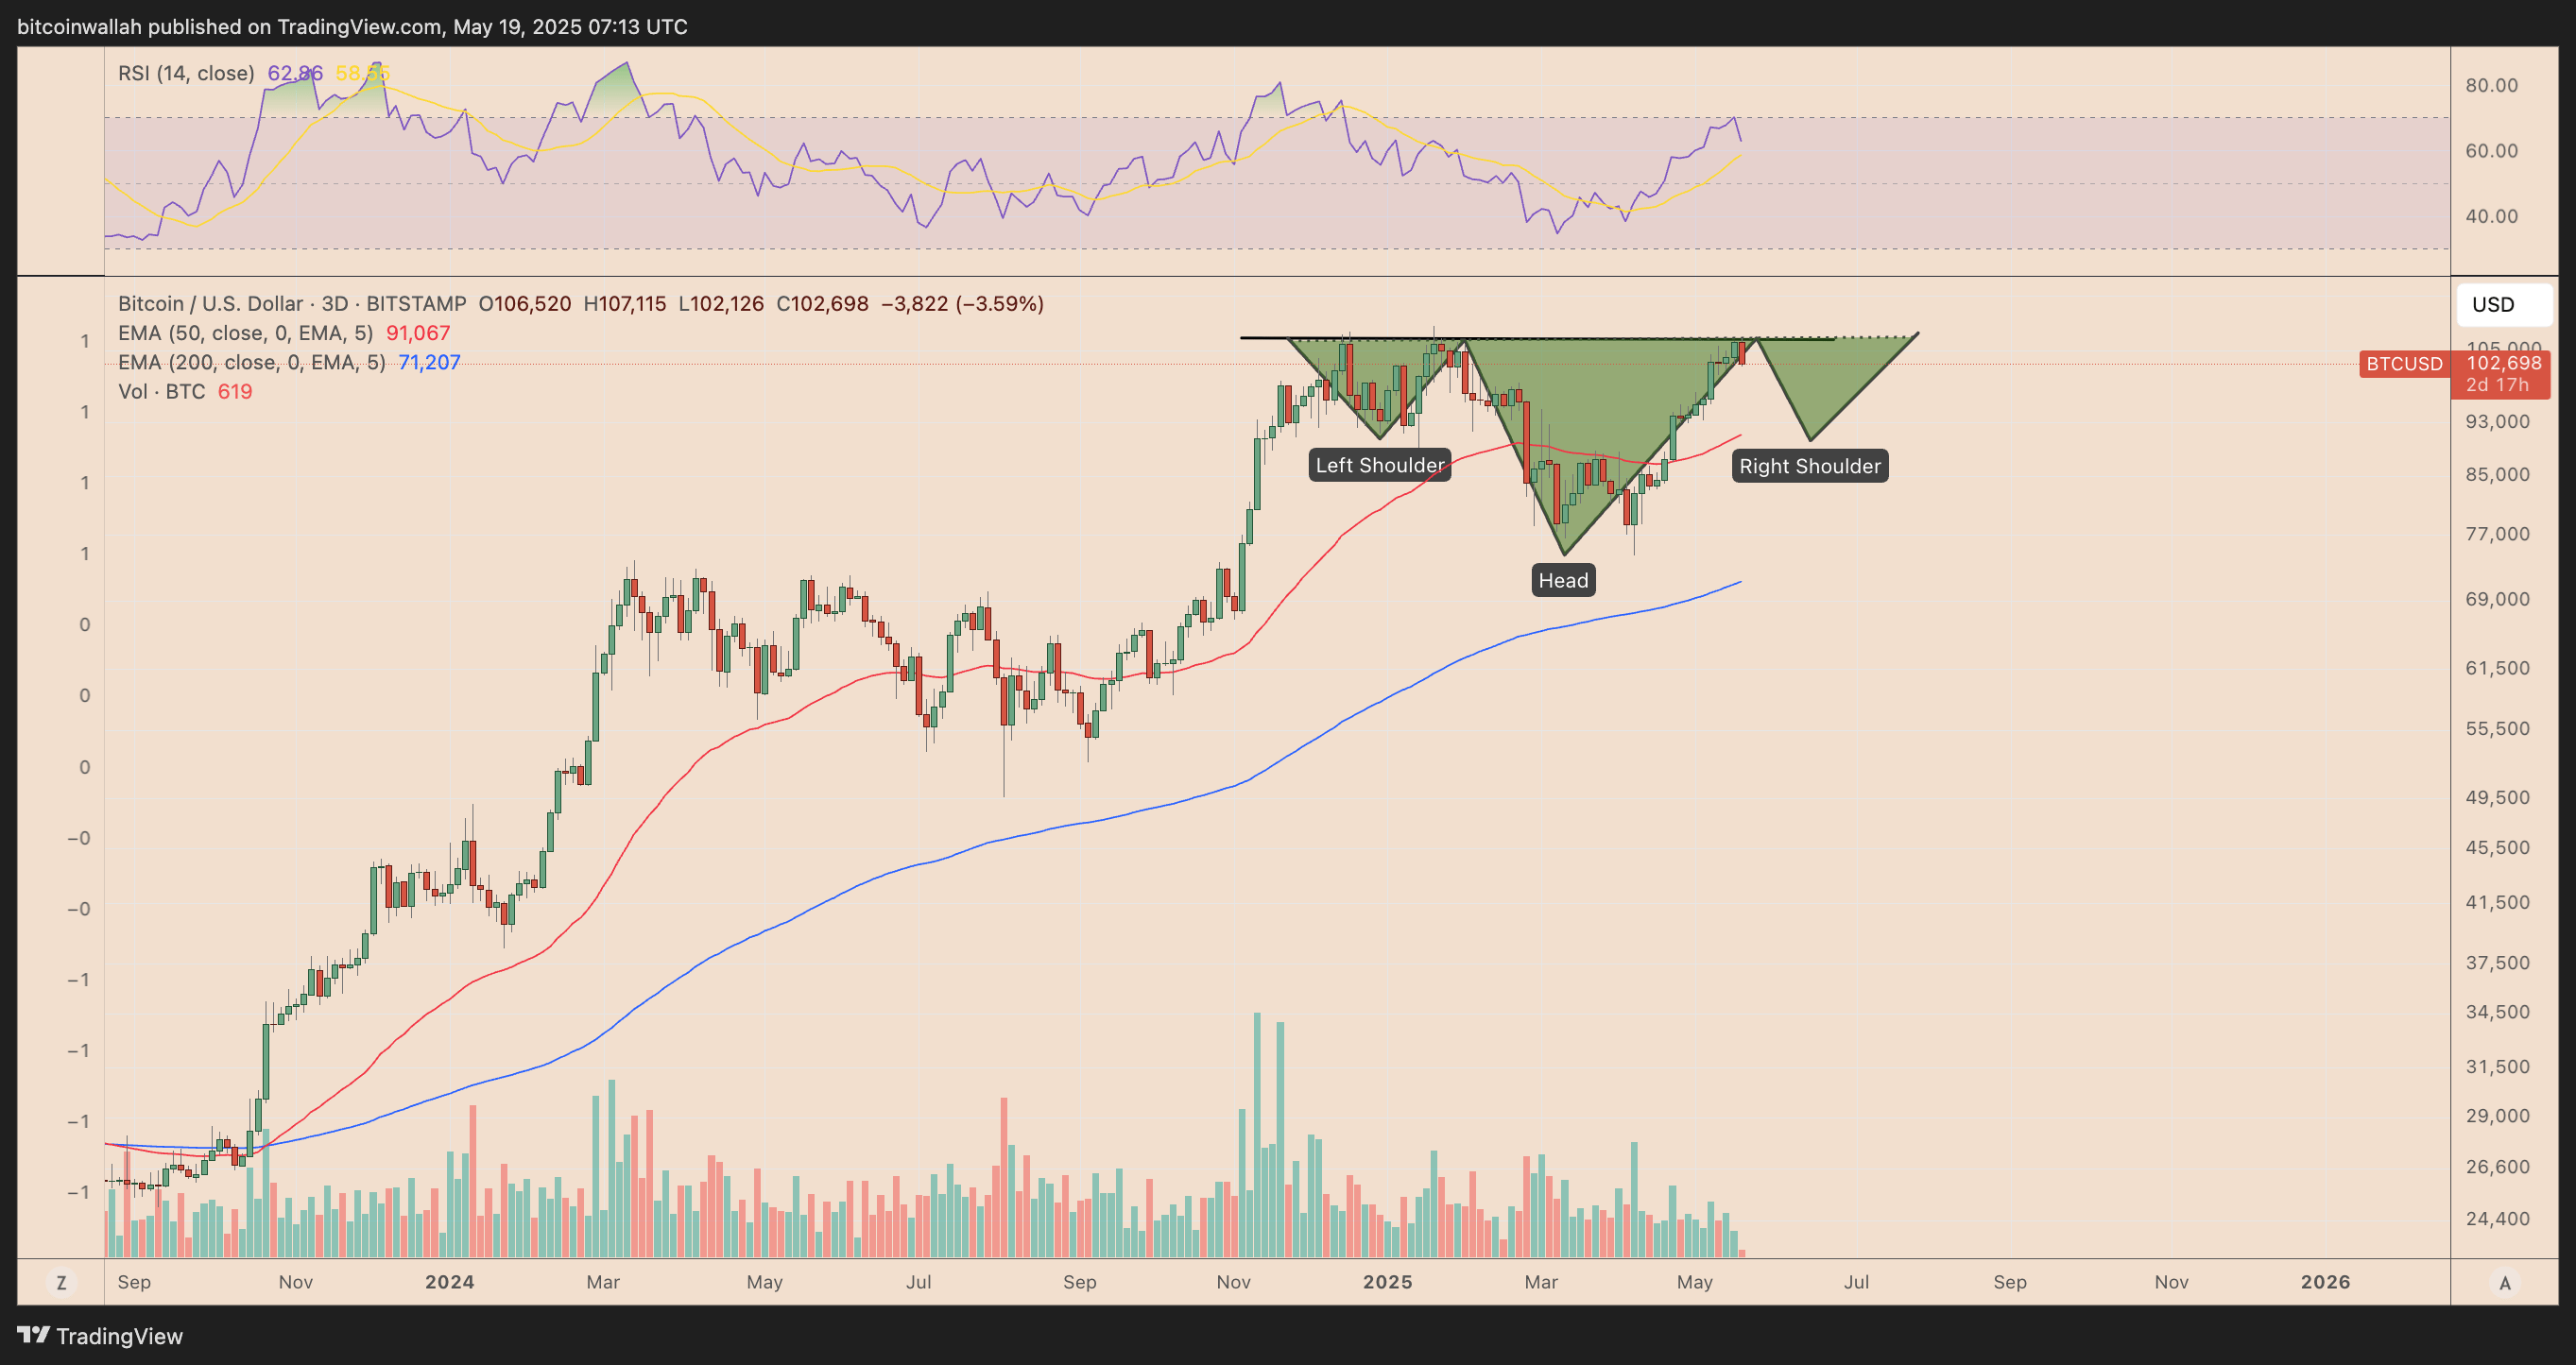
The chances of such a drop have increased since BTC failed to close above the critical $107,000 neckline level, the same zone that triggered bearish reversals in December 2024 and January 2025.
A rebound from the $91,000 zone toward the neckline at around $107,000 could increase Bitcoin’s odds of rising toward $150,000 .
This article does not contain investment advice or recommendations. Every investment and trading move involves risk, and readers should conduct their own research when making a decision.
Disclaimer: The content of this article solely reflects the author's opinion and does not represent the platform in any capacity. This article is not intended to serve as a reference for making investment decisions.
You may also like
Ripple Taps Zand Bank and Mamo in UAE Debut
Ripple teams up with Zand Bank and Mamo to launch blockchain-powered payments in the UAE.Ripple Expands to UAE with First Payment ClientsZand Bank and Mamo Join RippleNetWhy the UAE Move Matters for Ripple

TON Coin Leadership Change and Cross-Chain Bridge Shutdown

MapleStory N Launches on Avalanche Blockchain

Meme Coins PEPE, WIF Drive Cryptocurrency Rally
