Can SHIB Price Jump 25% This Week?

Shiba Inu (SHIB) price is showing signs of pressure building up as it consolidates tightly between major moving averages. Based on both the daily and hourly TradingView charts as of May 25, 2025, Shiba Inu price appears to be entering a critical decision zone. The current price is hovering around $0.00001428, and both bulls and bears are fighting for dominance.
Shiba Inu Price Prediction: What’s the Bigger Picture on the Daily Chart?
 SHIB/USD Daily Chart- TradingView
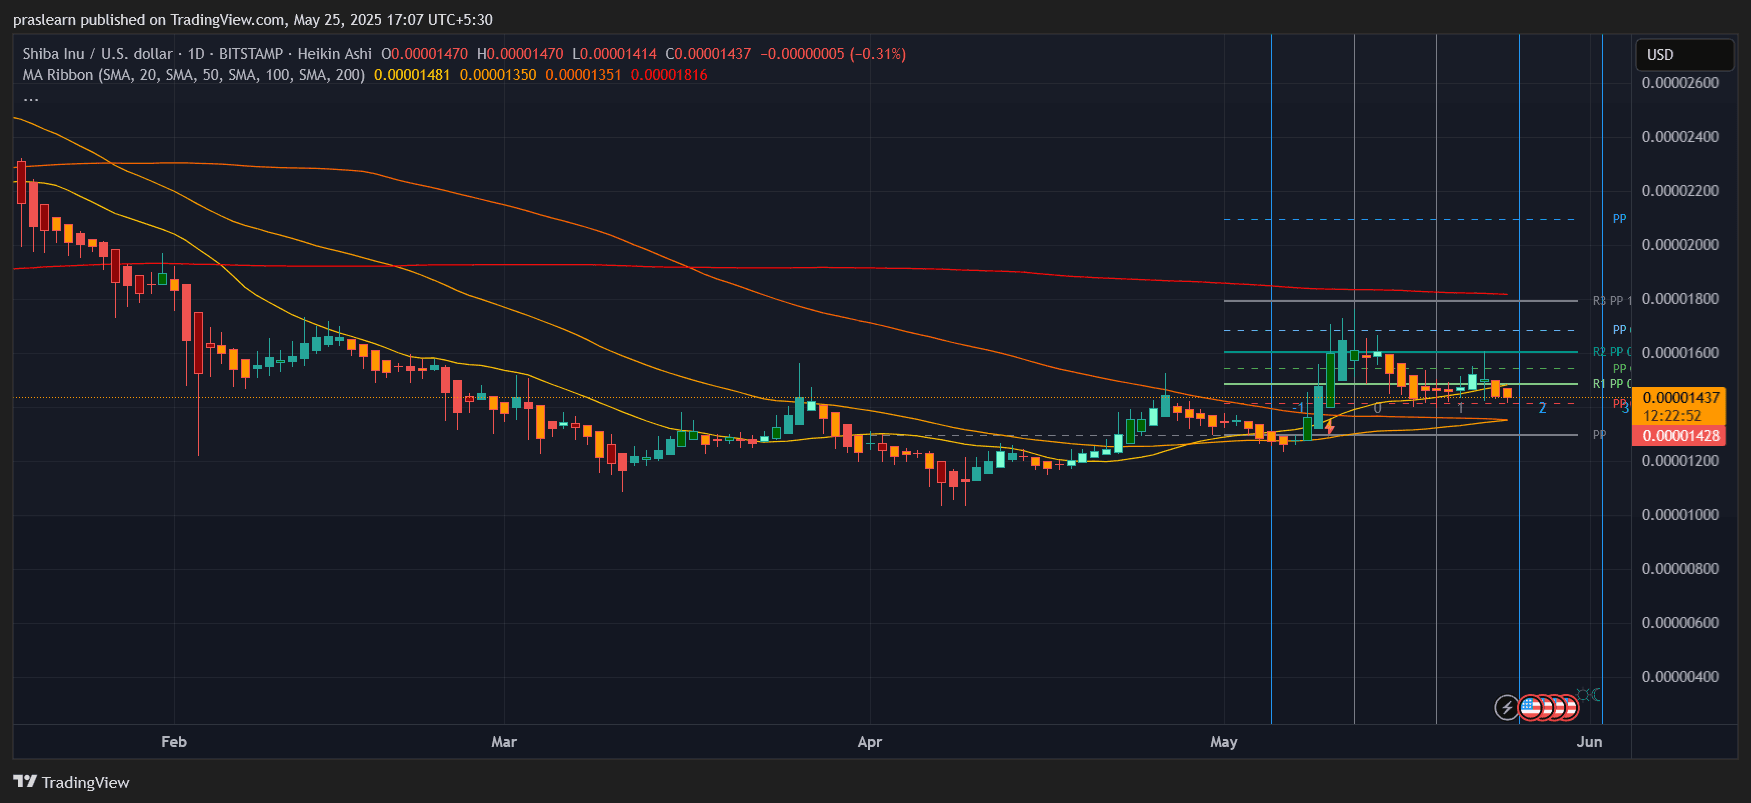
On the daily chart, Shiba Inu price has managed to crawl back above its 50-day and 100-day simple moving averages (SMA), currently hovering just around $0.00001428–$0.00001481. The price tried to pierce through the resistance cluster at $0.000016, marked by the R2 pivot, but failed to hold the momentum. The rejection there confirms a strong barrier that bulls must conquer to sustain any further rally.
Interestingly, the 200-day SMA is far above the current price at $0.00001816, and until that level is cleared, SHIB price remains in macro bearish territory. But the base seems to be forming. The candle formations show higher lows since early May, and the Heikin Ashi candles are flattening, signaling reduced volatility — a sign often seen before large moves.
What’s Happening in the Short-Term Hourly Chart?
 SHIB/USD 1 Hr Chart- TradingView
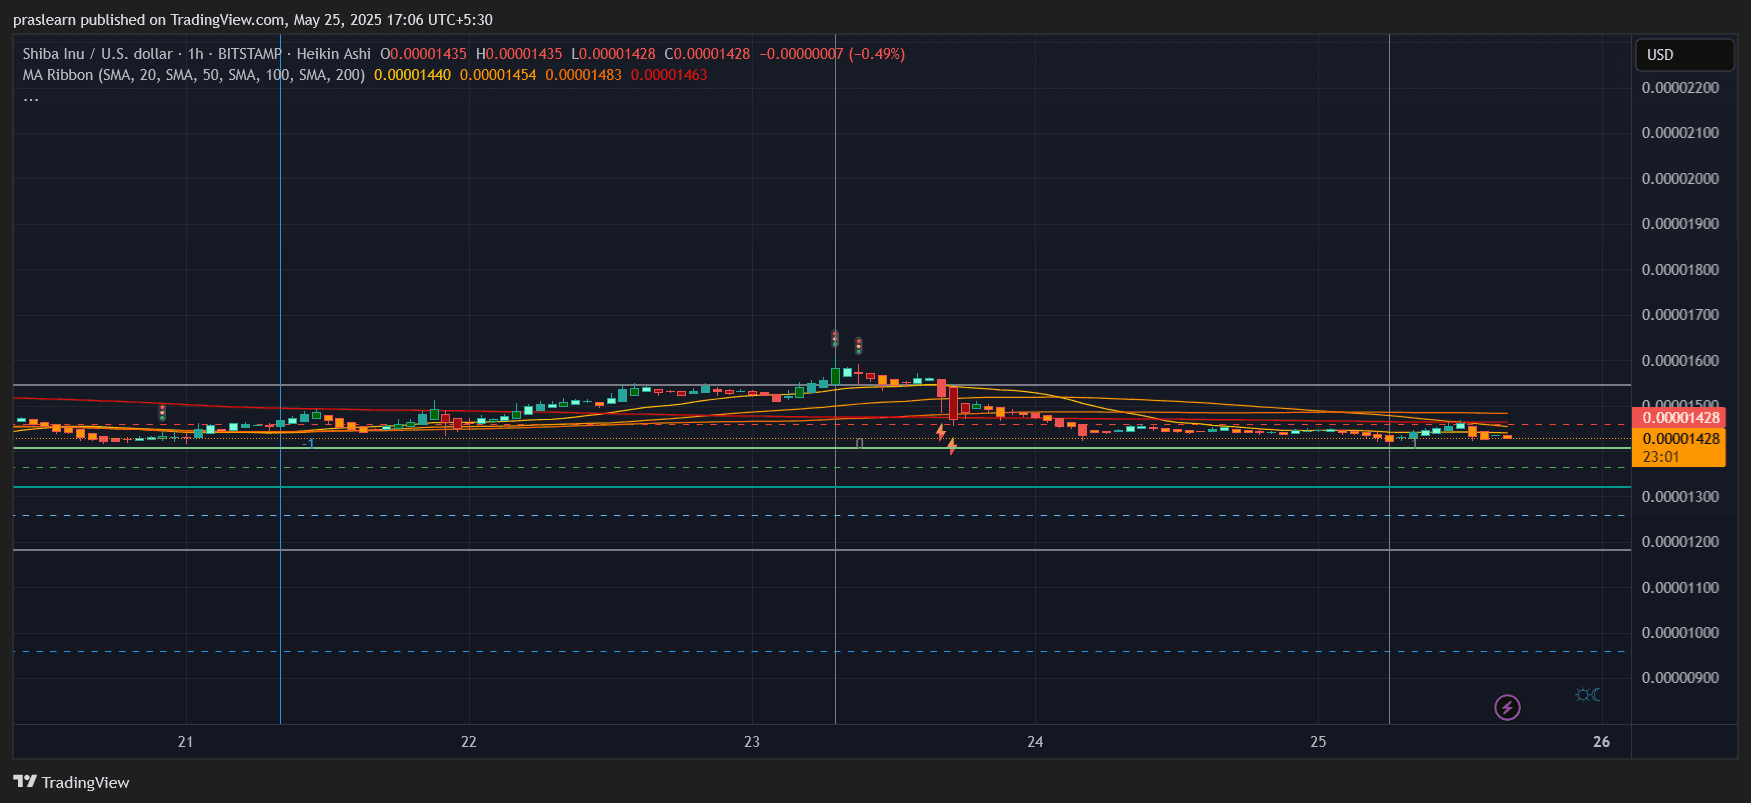
On the hourly chart, Shiba Inu price recently faced rejection from around $0.00001560, followed by a sharp drop that breached multiple short-term supports. It then stabilized and is now ranging between $0.00001420 and $0.00001450.
The 50-SMA and 100-SMA have converged around $0.00001440, which could now act as a make-or-break level. Volume has tapered off significantly since May 23, suggesting that traders are waiting for confirmation before making big moves. If SHIB sustains above the hourly 200-SMA at $0.00001463, it would flip sentiment toward bullish in the short term.
How Far Can SHIB Go If It Breaks Out?
If SHIB price breaks above $0.000015 , a Fibonacci retracement from the early-May high suggests targets at:
- $0.00001610 (R2 Pivot and 38.2% Fib)
- $0.00001800 (200-DMA and previous top)
Assuming SHIB price climbs from $0.00001430 to $0.00001800, that’s a 26% upside from current levels.
However, downside risk also exists. A breakdown below $0.00001400 could push SHIB price toward the next major support at $0.00001320, which aligns with the 100-day SMA and the daily pivot support (S1). That represents a 7.6% drop from current levels.
Shiba Inu Price Prediction: Will SHIB Break Out or Break Down?
Shiba Inu price is clearly coiling within a tight band, with its 50-SMA, 100-SMA, and pivot point levels forming a compression zone. Historically, such tight MA clusters often lead to volatile directional moves. The setup resembles a classic squeeze pattern.
If bulls reclaim $0.00001560 with strong volume, a swift run to $0.00001800 is possible. On the other hand, losing $0.00001400 support may open doors to $0.00001320 or lower.
Until the breakout or breakdown is confirmed, Shiba Inu price remains in a holding pattern. Traders should watch closely for volume surges and price closures outside this consolidation range.
As of now, SHIB price is in neutral gear — but the engine is revving. A breakout beyond $0.000015 or breakdown below $0.000014 could determine the next 20–25% move.
Shiba Inu (SHIB) price is showing signs of pressure building up as it consolidates tightly between major moving averages. Based on both the daily and hourly TradingView charts as of May 25, 2025, Shiba Inu price appears to be entering a critical decision zone. The current price is hovering around $0.00001428, and both bulls and bears are fighting for dominance.
Shiba Inu Price Prediction: What’s the Bigger Picture on the Daily Chart?
SHIB/USD Daily Chart- TradingView
On the daily chart, Shiba Inu price has managed to crawl back above its 50-day and 100-day simple moving averages (SMA), currently hovering just around $0.00001428–$0.00001481. The price tried to pierce through the resistance cluster at $0.000016, marked by the R2 pivot, but failed to hold the momentum. The rejection there confirms a strong barrier that bulls must conquer to sustain any further rally.
Interestingly, the 200-day SMA is far above the current price at $0.00001816, and until that level is cleared, SHIB price remains in macro bearish territory. But the base seems to be forming. The candle formations show higher lows since early May, and the Heikin Ashi candles are flattening, signaling reduced volatility — a sign often seen before large moves.
What’s Happening in the Short-Term Hourly Chart?
SHIB/USD 1 Hr Chart- TradingView
On the hourly chart, Shiba Inu price recently faced rejection from around $0.00001560, followed by a sharp drop that breached multiple short-term supports. It then stabilized and is now ranging between $0.00001420 and $0.00001450.
The 50-SMA and 100-SMA have converged around $0.00001440, which could now act as a make-or-break level. Volume has tapered off significantly since May 23, suggesting that traders are waiting for confirmation before making big moves. If SHIB sustains above the hourly 200-SMA at $0.00001463, it would flip sentiment toward bullish in the short term.
How Far Can SHIB Go If It Breaks Out?
If SHIB price breaks above $0.000015 , a Fibonacci retracement from the early-May high suggests targets at:
- $0.00001610 (R2 Pivot and 38.2% Fib)
- $0.00001800 (200-DMA and previous top)
Assuming SHIB price climbs from $0.00001430 to $0.00001800, that’s a 26% upside from current levels.
However, downside risk also exists. A breakdown below $0.00001400 could push SHIB price toward the next major support at $0.00001320, which aligns with the 100-day SMA and the daily pivot support (S1). That represents a 7.6% drop from current levels.
Shiba Inu Price Prediction: Will SHIB Break Out or Break Down?
Shiba Inu price is clearly coiling within a tight band, with its 50-SMA, 100-SMA, and pivot point levels forming a compression zone. Historically, such tight MA clusters often lead to volatile directional moves. The setup resembles a classic squeeze pattern.
If bulls reclaim $0.00001560 with strong volume, a swift run to $0.00001800 is possible. On the other hand, losing $0.00001400 support may open doors to $0.00001320 or lower.
Until the breakout or breakdown is confirmed, Shiba Inu price remains in a holding pattern. Traders should watch closely for volume surges and price closures outside this consolidation range.
As of now, SHIB price is in neutral gear — but the engine is revving. A breakout beyond $0.000015 or breakdown below $0.000014 could determine the next 20–25% move.
Disclaimer: The content of this article solely reflects the author's opinion and does not represent the platform in any capacity. This article is not intended to serve as a reference for making investment decisions.
You may also like
SOL Price Alert: Key Breakout Incoming
Top 3 Reasons to Buy XRP Coin Today

539,000,000,000,000 Shiba Inu (SHIB) Level Born
Spot Bitcoin ETFs See $2.75B Weekly Inflows as BTC Hits New Highs
The figure represents a nearly 4.5x increase over the previous week’s $608 million inflow, according to data from Farside.