Will Shiba Inu Price Crash to 0 in June?

Shiba Inu (SHIB) price has been teetering on the edge lately, with price action growing weaker each week. Traders and investors alike are beginning to wonder: could SHIB price be heading toward a total collapse? June 2025 has started on a cautious note for the meme coin, and the charts are signaling danger ahead.
Shiba Inu Price Crash: Is SHIB Showing Signs of Weakness Already?
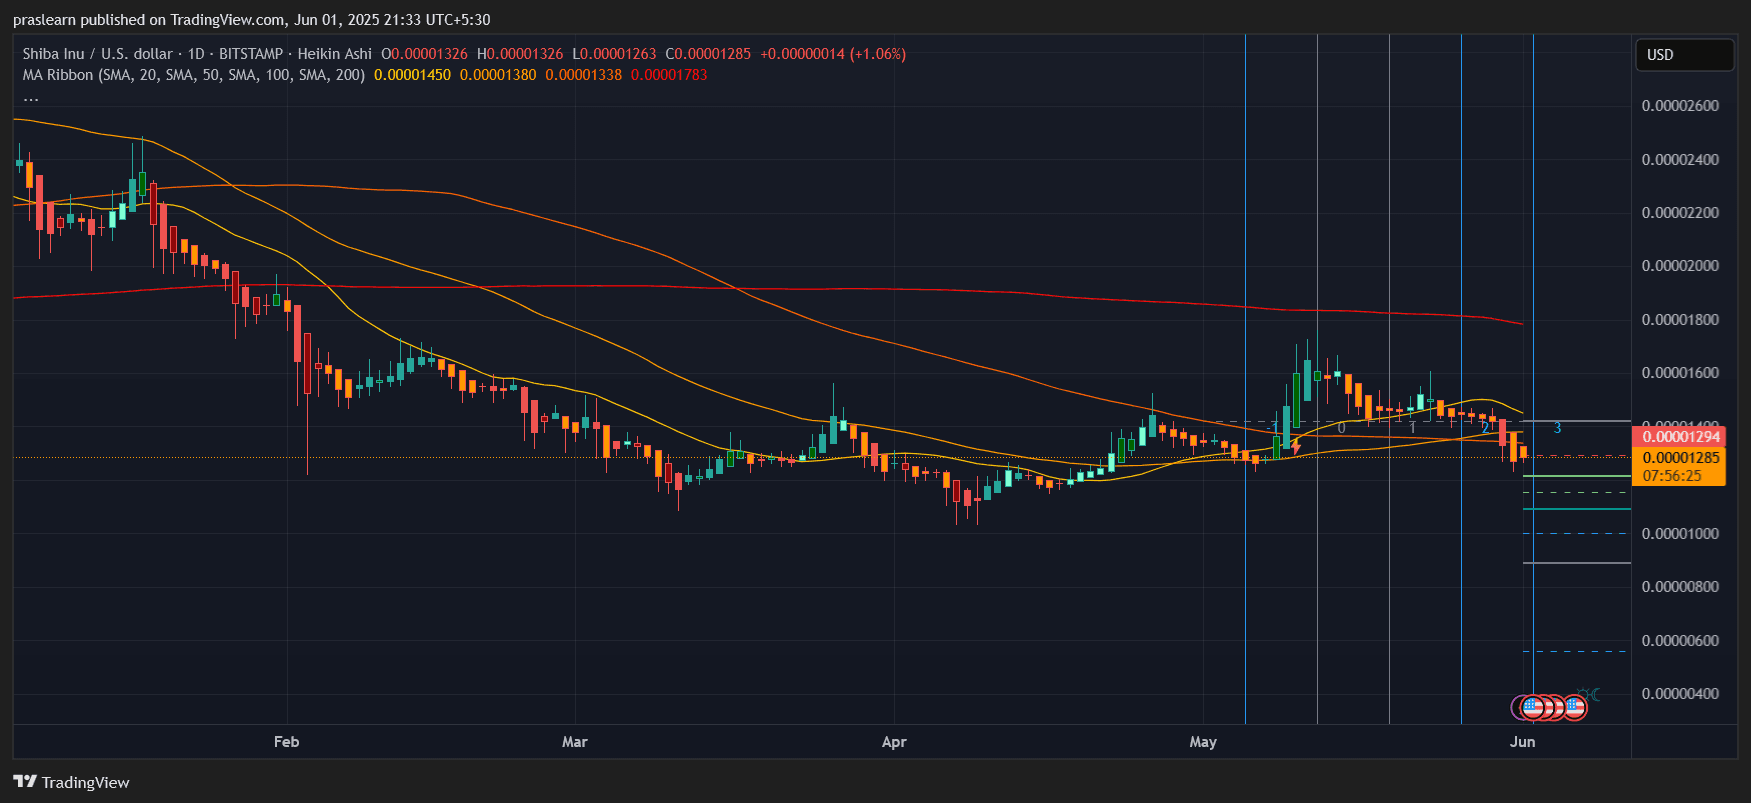 SHIB/USD Daily Chart- TradingView
Looking at the daily chart, Shiba Inu price has lost critical support near the $0.00001500 region and is now trading around $0.00001285, with a bearish Heikin Ashi candle structure confirming continued downside pressure. The price is now well below the 20-day, 50-day, and 100-day moving averages, which sit around $0.00001380 to $0.00001450. This confirms that SHIB is entrenched in a bearish trend.
A notable concern is the death cross formation that occurred weeks ago when the 50-day MA crossed below the 200-day MA, currently around $0.00001783. Historically, such a setup precedes prolonged downturns unless invalidated by sharp breakouts. Given current volume levels and momentum, a reversal appears unlikely in the near term.
Hourly Chart Confirms Bearish Continuation Pattern
 SHIB/USD 1 hr Chart- TradingView
Zooming into the hourly chart, SHIB’s short-term price action is struggling to reclaim even basic resistances. As of now, the token is barely holding at $0.00001295, while the hourly resistance at $0.00001342 (100-hour SMA) and $0.00001391 (200-hour SMA) are acting as solid rejection points.
There was a recent attempt at a minor rebound, but each uptick was met with strong selling pressure, especially near the MA ribbon. Moreover, a descending wedge structure that briefly broke upward has already failed to sustain momentum. This rejection aligns with the classic "bear flag breakdown", a pattern that typically results in further declines.
If we project the breakdown target using the flagpole method:
- Height of the previous flagpole: $0.00001550 – $0.00001200 = $0.00000350
- Breakdown point: ~$0.00001200
- Measured move target: $0.00001200 – $0.00000350 = $0.00000850
This suggests that SHIB price could fall to $0.00000850 in the coming weeks unless a major reversal invalidates the pattern.
What Price Levels Could Trigger a Panic Sell-Off?
The key support to watch is $0.00001200. If this level is lost, there is virtually no significant horizontal support until $0.00000950, which served as the last major accumulation range back in early 2024. A breach below this could activate automated stop losses and lead to panic selling.
Even more alarming is the possibility of SHIB price entering a “capitulation zone” between $0.00000700 and $0.00000500, where long-term holders might also start exiting. These zones align with historical volume nodes seen on volume profile analysis.
Shiba Inu Price Prediction: Could Shiba Inu Go to Zero? Let’s Do the Math
Let’s break down what it would take for SHIB price to hit zero . Currently, SHIB’s supply is around 589 trillion tokens. With a current price of $0.00001285, that gives a market cap of around $7.58 billion. For SHIB to crash to $0.00000001, the market cap would need to drop to under $6 million — a 99.99% collapse. That’s highly improbable without a complete failure of the ecosystem or total market exit from all meme coins.
So while crashing to absolute zero is more theoretical than likely, the realistic danger is a price collapse to sub-$0.000007 levels, which still means a 45%–60% drawdown from current prices.
Shiba Inu Price Crash: What Could Trigger the Collapse?
Several factors could act as catalysts:
- Bitcoin weakness: If BTC drops below $60,000 again, meme coins like SHIB will bleed harder.
- Lack of utility narrative: Shibarium has not delivered ecosystem traction to counteract the hype cycle downturn.
- Whale exits: Any major wallet unloading positions will spook retail investors.
- Macro pressure: Rising interest rates or a U.S. recession could drain liquidity from speculative assets.
Shiba Inu Price Prediction: What’s the Verdict for June 2025?
While a literal crash to zero is highly unlikely due to exchange delisting safeguards and whale holdings, the charts clearly show a breakdown structure with more room to fall. If Shiba Inu fails to hold the $0.00001200 level in the first week of June, we could very well see it spiral toward $0.00000850 or lower.
Investors should brace for volatility and be cautious of fakeouts. The momentum, trend indicators, and volume behavior all currently support a bearish bias for Shiba Inu in June 2025.
Shiba Inu (SHIB) price has been teetering on the edge lately, with price action growing weaker each week. Traders and investors alike are beginning to wonder: could SHIB price be heading toward a total collapse? June 2025 has started on a cautious note for the meme coin, and the charts are signaling danger ahead.
Shiba Inu Price Crash: Is SHIB Showing Signs of Weakness Already?
SHIB/USD Daily Chart- TradingView
Looking at the daily chart, Shiba Inu price has lost critical support near the $0.00001500 region and is now trading around $0.00001285, with a bearish Heikin Ashi candle structure confirming continued downside pressure. The price is now well below the 20-day, 50-day, and 100-day moving averages, which sit around $0.00001380 to $0.00001450. This confirms that SHIB is entrenched in a bearish trend.
A notable concern is the death cross formation that occurred weeks ago when the 50-day MA crossed below the 200-day MA, currently around $0.00001783. Historically, such a setup precedes prolonged downturns unless invalidated by sharp breakouts. Given current volume levels and momentum, a reversal appears unlikely in the near term.
Hourly Chart Confirms Bearish Continuation Pattern
SHIB/USD 1 hr Chart- TradingView
Zooming into the hourly chart, SHIB’s short-term price action is struggling to reclaim even basic resistances. As of now, the token is barely holding at $0.00001295, while the hourly resistance at $0.00001342 (100-hour SMA) and $0.00001391 (200-hour SMA) are acting as solid rejection points.
There was a recent attempt at a minor rebound, but each uptick was met with strong selling pressure, especially near the MA ribbon. Moreover, a descending wedge structure that briefly broke upward has already failed to sustain momentum. This rejection aligns with the classic "bear flag breakdown", a pattern that typically results in further declines.
If we project the breakdown target using the flagpole method:
- Height of the previous flagpole: $0.00001550 – $0.00001200 = $0.00000350
- Breakdown point: ~$0.00001200
- Measured move target: $0.00001200 – $0.00000350 = $0.00000850
This suggests that SHIB price could fall to $0.00000850 in the coming weeks unless a major reversal invalidates the pattern.
What Price Levels Could Trigger a Panic Sell-Off?
The key support to watch is $0.00001200. If this level is lost, there is virtually no significant horizontal support until $0.00000950, which served as the last major accumulation range back in early 2024. A breach below this could activate automated stop losses and lead to panic selling.
Even more alarming is the possibility of SHIB price entering a “capitulation zone” between $0.00000700 and $0.00000500, where long-term holders might also start exiting. These zones align with historical volume nodes seen on volume profile analysis.
Shiba Inu Price Prediction: Could Shiba Inu Go to Zero? Let’s Do the Math
Let’s break down what it would take for SHIB price to hit zero . Currently, SHIB’s supply is around 589 trillion tokens. With a current price of $0.00001285, that gives a market cap of around $7.58 billion. For SHIB to crash to $0.00000001, the market cap would need to drop to under $6 million — a 99.99% collapse. That’s highly improbable without a complete failure of the ecosystem or total market exit from all meme coins.
So while crashing to absolute zero is more theoretical than likely, the realistic danger is a price collapse to sub-$0.000007 levels, which still means a 45%–60% drawdown from current prices.
Shiba Inu Price Crash: What Could Trigger the Collapse?
Several factors could act as catalysts:
- Bitcoin weakness: If BTC drops below $60,000 again, meme coins like SHIB will bleed harder.
- Lack of utility narrative: Shibarium has not delivered ecosystem traction to counteract the hype cycle downturn.
- Whale exits: Any major wallet unloading positions will spook retail investors.
- Macro pressure: Rising interest rates or a U.S. recession could drain liquidity from speculative assets.
Shiba Inu Price Prediction: What’s the Verdict for June 2025?
While a literal crash to zero is highly unlikely due to exchange delisting safeguards and whale holdings, the charts clearly show a breakdown structure with more room to fall. If Shiba Inu fails to hold the $0.00001200 level in the first week of June, we could very well see it spiral toward $0.00000850 or lower.
Investors should brace for volatility and be cautious of fakeouts. The momentum, trend indicators, and volume behavior all currently support a bearish bias for Shiba Inu in June 2025.
Disclaimer: The content of this article solely reflects the author's opinion and does not represent the platform in any capacity. This article is not intended to serve as a reference for making investment decisions.
You may also like
Satoshi’s Bitcoin Holdings May Surpass Bill Gates’ Amid May Exchange Netflow Trends

Bitcoin traders predict ‘larger correction’ as BTC price eyes sub-$100K liquidity
Is a New Altcoin Season Dawning? Comparing Bitcoin and Altcoins Outlook
Unpacking Predictions and Uncertainties Surrounding the Potential Onset of Altcoin Season

Is Ethereum (ETH) Gearing Up for a Rally? Key Fractal Hints at Bullish Continuation