Is Aave Price Looking for a Breakout Soon?

Aave (AAVE) is showing renewed strength in the market, up 15% in the last 24 hours and nearly 40% over the past 30 days. Its market cap now sits at $4.6 billion. This surge has put AAVE back in focus among DeFi leaders, supported by bullish technical indicators.
The altcoin has entered overbought territory, and CMF shows strong capital inflows. As AAVE approaches key resistance zones, traders watch closely for a breakout or signs of a reversal.
RSI Hits Overbought Zone: What Comes Next?
Aave’s Relative Strength Index (RSI) is currently at 75.83, having climbed sharply from 44.51 two days ago. It has remained above 70 since yesterday, firmly in “overbought” territory.
This rapid increase reflects strong buying momentum and suggests heightened market interest in AAVE.
The move also follows a broader uptick in DeFi token activity, aligning with a surge in trading volume and price action across the sector.
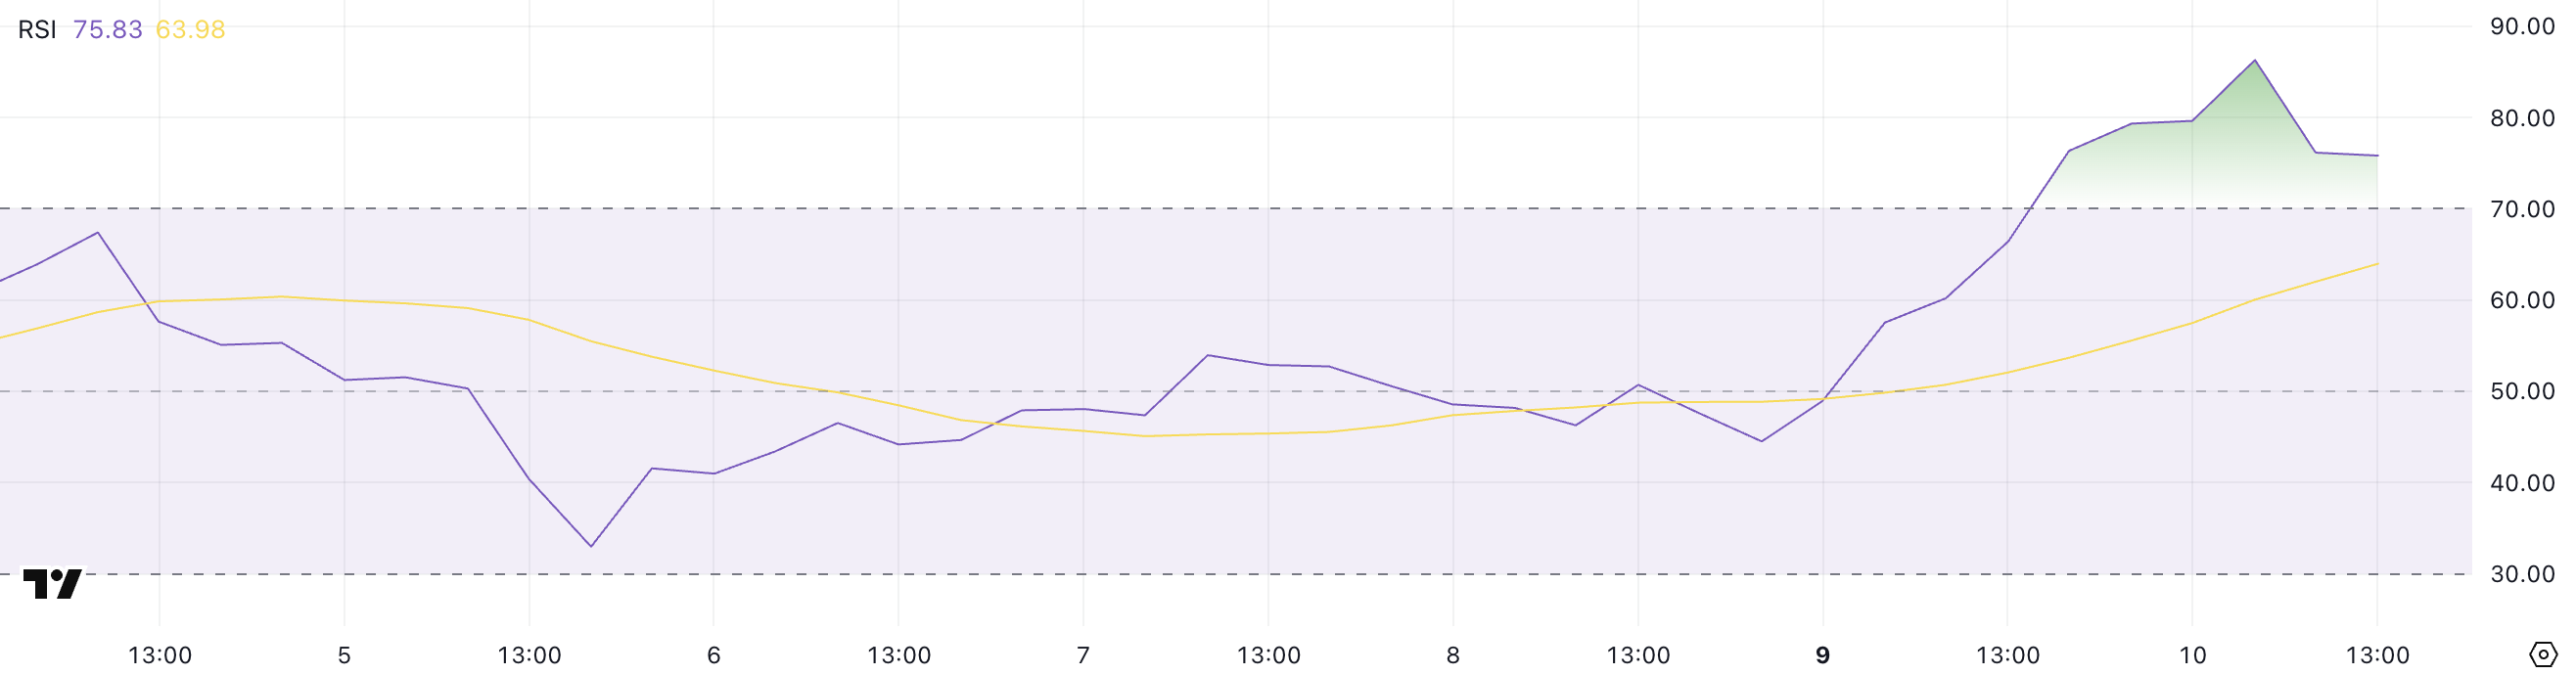
The RSI is a technical indicator that measures the speed and magnitude of recent price changes to assess whether an asset is overbought or oversold.
An RSI above 70 typically signals that a token may be overbought, potentially due for a pullback or consolidation. At the same time, an RSI below 30 indicates oversold conditions that may lead to a rebound.
With AAVE’s RSI at 75.83, traders may begin to anticipate short-term resistance or cooling off.
However, strong RSI readings during uptrends can signal strength, meaning AAVE could continue pushing higher if momentum remains intact.
Bullish Inflows Signal Accumulation
Aave’s Chaikin Money Flow (CMF) is currently at 0.24, rising from -0.04 two days ago, although down from an earlier peak of 0.41 just a few hours ago.
This shift into positive territory reflects a recent influx of buying pressure and capital inflow into AAVE, despite the slight intraday pullback.
The overall trend indicates strengthening demand, with buyers stepping in more aggressively than earlier in the week.
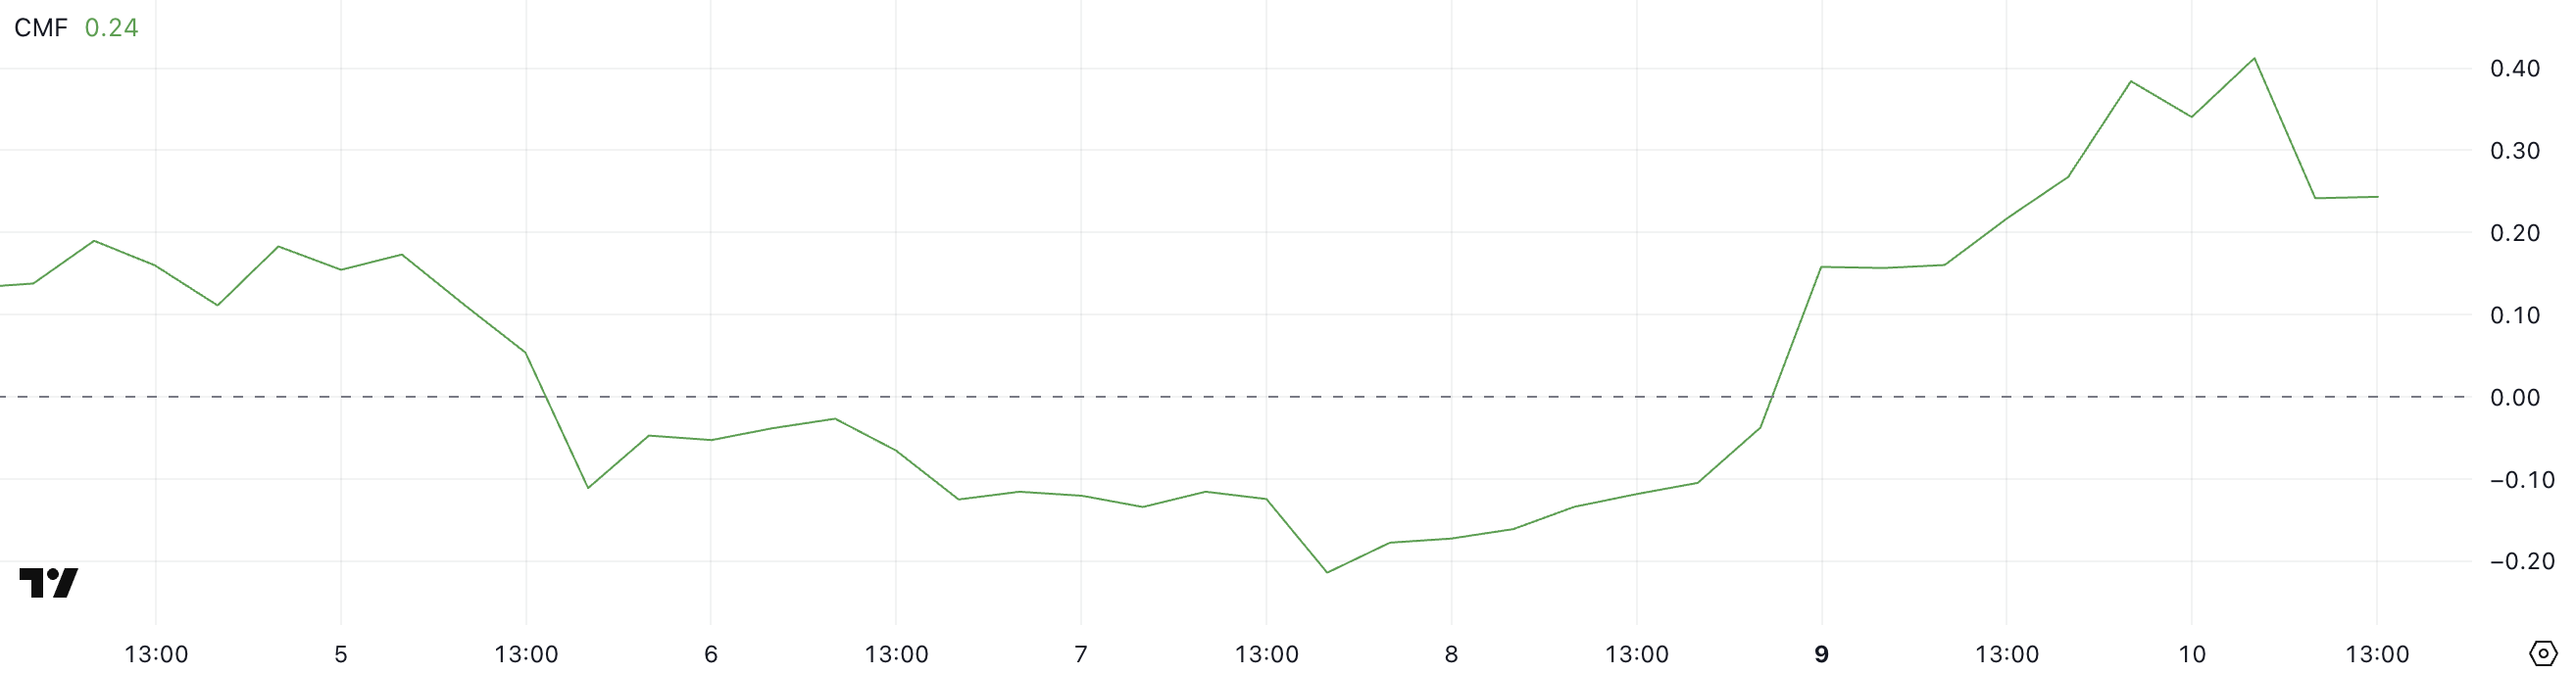
The CMF is a volume-weighted indicator that measures money flow into and out of an asset over a specific period. It typically ranges from -1 to +1, where values above 0 suggest buying pressure (accumulation) and below 0 indicate selling pressure (distribution).
With its CMF at 0.24, the data points to sustained accumulation, though the drop from 0.41 signals that some buyers may be locking in profits or momentum could be cooling slightly.
If CMF remains positive, AAVE may continue to see upward price pressure in the short term.
AAVE EMA Signals Bullish Strength — But Watch These Key Levels
AAVE’s EMA lines are currently showing a strong bullish trend. The short-term averages are positioned well above the long-term ones, and there is a notable gap between them, often a sign of sustained upward momentum.
This setup reflects a healthy trend structure and supports the possibility of further price appreciation.
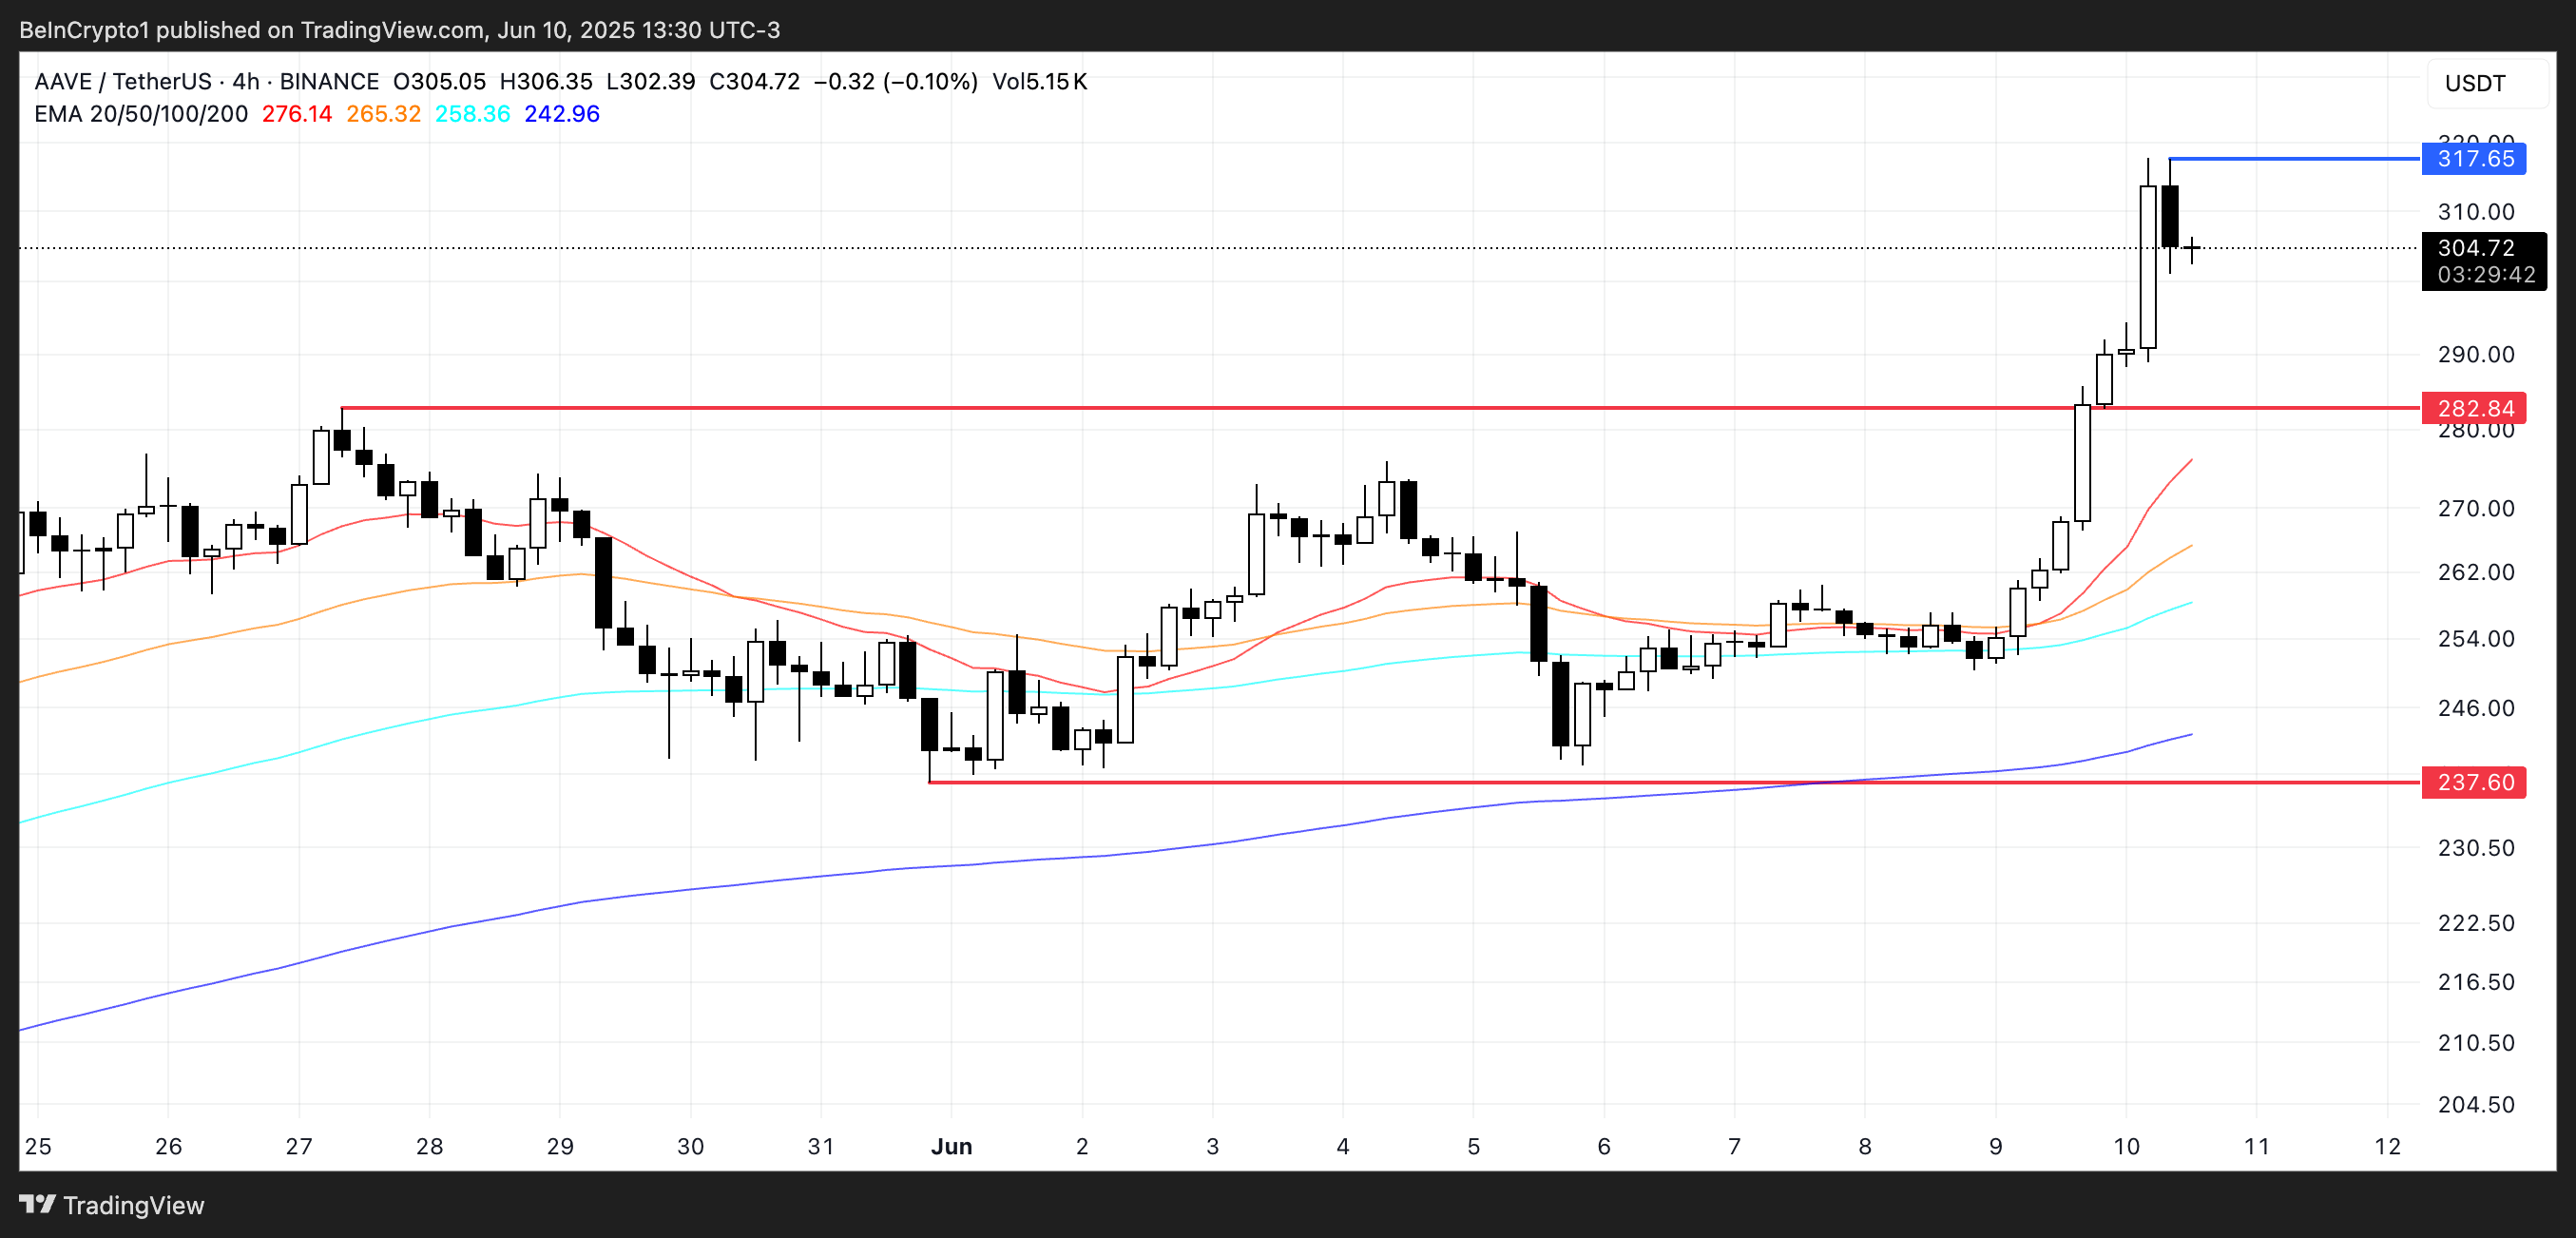
If AAVE price manages to break through its current resistance at $317, the next upside target could be levels above $340, as momentum traders and breakout buyers step in.
However, a rejection at the $317 resistance or a broader market pullback could bring the lower support level at $282 into play.
If that level fails, it could retrace to around $237, marking a significant reversal from current levels.
Disclaimer: The content of this article solely reflects the author's opinion and does not represent the platform in any capacity. This article is not intended to serve as a reference for making investment decisions.
You may also like
BREAKING! US PPI Data Announced! What Was Bitcoin's (BTC) First Reaction?
Bitcoin Pepe price outlook as Swedish firms plans major BTC acquisition

Best crypto presales to buy as GameStop may be planning another massive BTC purchase

No one will sell their Bitcoin once it taps $130K: Bitwise CEO
