Date: Sat, Aug 02, 2025 | 06:45 AM GMT
The cryptocurrency market continues to face strong selling pressure. Ethereum (ETH), which recently tested resistance near $3,940, has dropped to $3,460—marking a 5% daily decline. This pullback has rippled through the altcoin space, with Virtuals Protocol (VIRTUAL) falling 2% today and wiping out all of its monthly gains, now down 29%.
While some assets are showing signs of stabilization, VIRTUAL’s daily chart suggests the selloff may not be over just yet.
 Source: Coinmarketcap
Harmonic Pattern Suggests Further Downside
On the daily chart, VIRTUAL is forming a Bullish ABCD harmonic pattern — a structure that, despite its “bullish” name, often leads to a deeper downside move before any reversal can take shape.
The pattern began at Point A (~$2.58), dipped sharply to Point B, then rebounded toward Point C (~$1.95) in late July. Since hitting Point C, price action has been firmly in decline, marking the beginning of the CD leg—typically the final leg before the completion of the pattern.
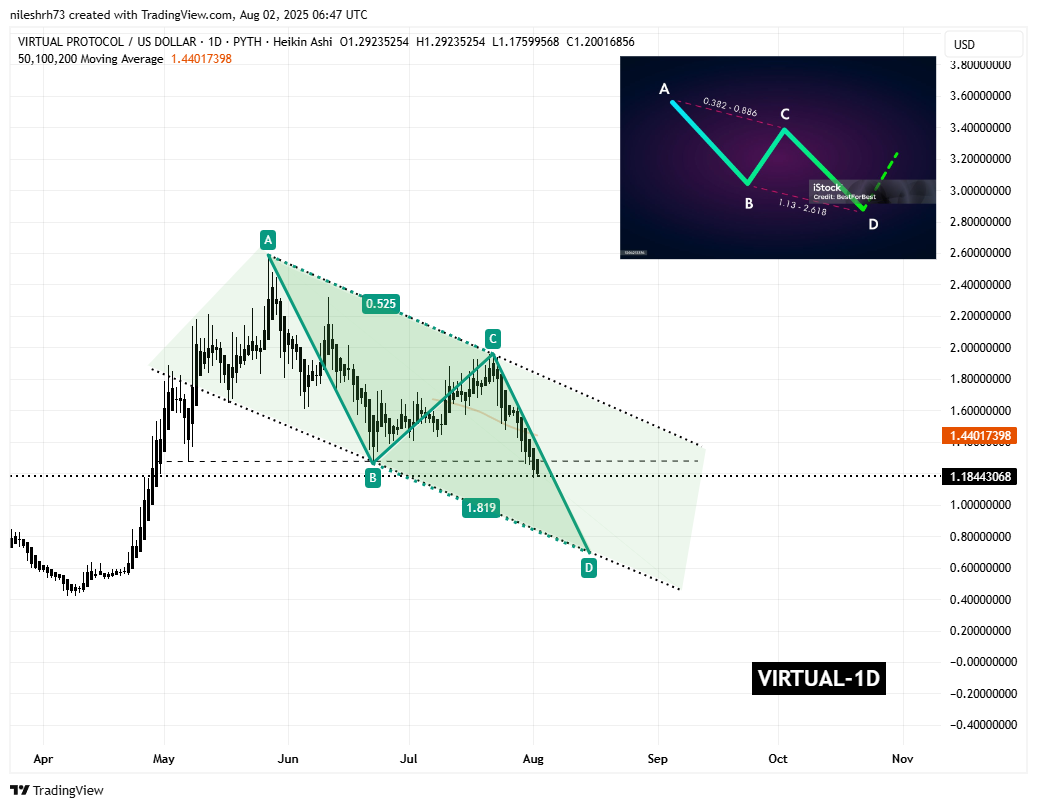 Virtuals Protocol (VIRTUAL) Daily Chart/Coinsprobe (Source: Tradingview)
Currently, VIRTUAL is trading near $1.18, and if the pattern completes as expected, the 1.81 Fibonacci extension of the BC leg suggests a Potential Reversal Zone (PRZ) around $0.69. This implies that VIRTUAL could face up to 41% more downside from current levels before finding a solid support base.
What’s Next for VIRTUAL?
If the CD leg continues to play out, VIRTUAL may continue its descent toward the projected support zone around $0.69. This level is considered technically significant and may attract buying interest, especially from harmonic pattern traders looking for a bounce from the PRZ.
That said, the broader market context remains cautious, and VIRTUAL’s structure stays bearish as long as the price remains below the 200-day moving average, currently sitting at $1.44. Any sustained move above that level would be needed to shift sentiment.