Swallowing 7% of Circulating Supply: How Are Bitcoin ETFs Quietly Reshaping the Market Supply Structure?

Bitcoin ETFs have become a key force in reshaping market supply and demand, now holding over 1.4 million BTC (more than 7% of total circulation). Their capital flows reveal investor behaviors of chasing gains and cutting losses. New indicators, such as cumulative flow difference and flow-weighted average price, help analyze market sentiment and cost basis. As ETFs are absorbing BTC far faster than new coins are mined, long-term scarcity may intensify, though short-term fluctuations are still influenced by retail investor psychology. These tools offer innovative perspectives for understanding market dynamics. Summary generated by Mars AI This summary was generated by the Mars AI model, and the accuracy and completeness of its content are still being iteratively updated.
There is currently a quietly influential force reshaping the market's supply dynamics: Bitcoin Exchange-Traded Funds (ETFs). These products have already absorbed 7% of Bitcoin’s total circulating supply. If you haven’t been paying attention to them, you’re missing the most crucial piece of the puzzle.
In this article, we will delve into ETF capital flows, analyze newly developed indicators at the forefront of flow analysis to help measure the impact of ETFs, and reflect on the market dynamics and human behavior revealed by these flows.
Let’s get started.
Key Takeaways
- Absorbing a large supply: Global Bitcoin ETFs currently hold over 1.4 million BTC, accounting for more than 7% of the total supply, impacting scarcity and price stability.
- Flow patterns and psychology: Daily and cumulative flow data reflect investor behavior, highlighting opportunities to buy during outflows and sell during inflows.
- Custom indicators for in-depth analysis: New tools such as cumulative flow deviation, flow volatility, and flow-weighted average price provide signals for market tops, bottoms, and investor cost basis.
- Long-term bullish outlook: The number of Bitcoins purchased by ETFs exceeds the number newly mined, and this structural shift may support future price increases.
A New Era of Bitcoin Adoption
Since their launch in January 2024, U.S. Exchange-Traded Funds (ETFs) have become a transformative force in the Bitcoin ecosystem. These financial products allow both retail and institutional giants to gain exposure to Bitcoin without directly holding it. Given Bitcoin’s fixed supply of 21 million coins, this mechanism has a significant impact on Bitcoin’s supply and demand dynamics.
However, it is estimated that about 3 to 6 million Bitcoins are permanently lost due to lost private keys, deceased holders, or other unrecoverable circumstances. This reduces the actual circulating Bitcoin to about 15 to 18 million coins, which is the effective upper limit of Bitcoin’s total supply.
Against this backdrop, ETFs currently hold over 1.4 million BTC, equivalent to more than 7% of the maximum supply, or possibly over 10% of the circulating supply. This fact underscores the growing dominance of ETFs.
Quarterly and Monthly Dynamics
Let’s first take a broad look at the health of ETFs.
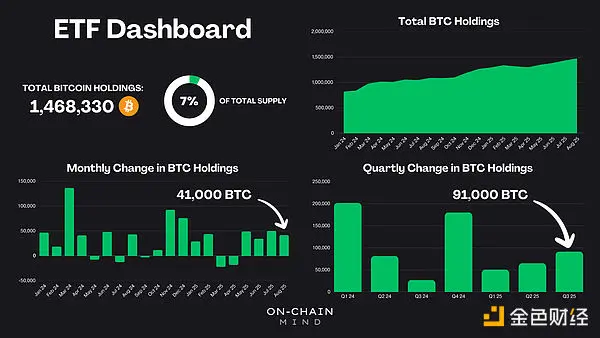
The total BTC held by all global Bitcoin ETFs has exceeded 1.4 million coins. Even though this quarter is not yet over, these ETFs have already absorbed more than 91,000 BTC. This is a strong quarter, second only to the inflows seen at the initial ETF launches late last year and the post-election rally.
Breaking it down by month, the inflows are even more striking:
- May to August 2025: Continuous inflows, steadily withdrawing more Bitcoin from the market.
- In August alone, 41,000 BTC were absorbed.
- Bitcoins mined daily: about 450, or roughly 14,000 per month.
Simply put, this month’s ETF inflows have already exceeded three times the new supply entering the system through miners. This absorption tightens available liquidity, putting sustained upward pressure on prices, which may explain why we have been passively climbing to new highs so far.
Analysis of Capital Flows
Cumulative Capital
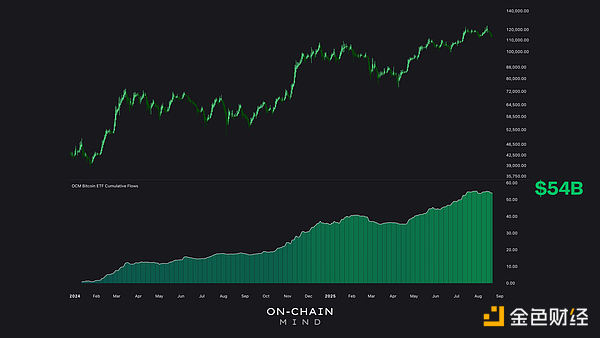
Looking at cumulative ETF flows, net inflows since January 2024 have reached an astonishing $54 billion. The overall trend is “continuously rising,” with only brief pauses, indicating a persistent influx of passive capital.
Cumulative Flow Deviation
One of the most insightful custom indicators derived from this data is the cumulative flow deviation, an oscillating indicator that measures the deviation of ETF flows from their long-term trend. This indicator accounts for non-trading days (such as weekends) by carrying forward their values and applies a 75-day moving average to smooth the data while avoiding excessive noise. The deviation is the difference between daily flows and this average, highlighting the acceleration or deceleration of net flows.
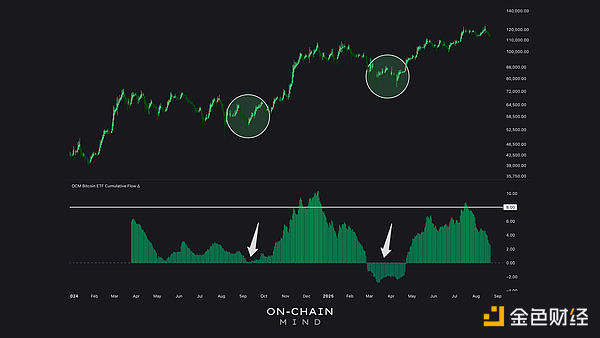
Data since March 2024 shows that when the cumulative flow deviation is above +8, it indicates local price highs and inflows above normal levels, with heightened local market sentiment. When the deviation is near zero or negative, it marks lows, suggesting potentially undervalued investment opportunities. This indicator essentially quantifies retail investor behavior and encourages contrarian action.
Daily Capital Flows
A close look at daily ETF flows reveals a strong correlation with Bitcoin’s price movements. During uptrends, inflows dominate, while during pullbacks, outflows surge. This correlation is obvious: the majority of ETF participants—retail investors—exhibit momentum-chasing behavior. They rush in at highs due to FOMO and exit at lows due to fear, uncertainty, and doubt.
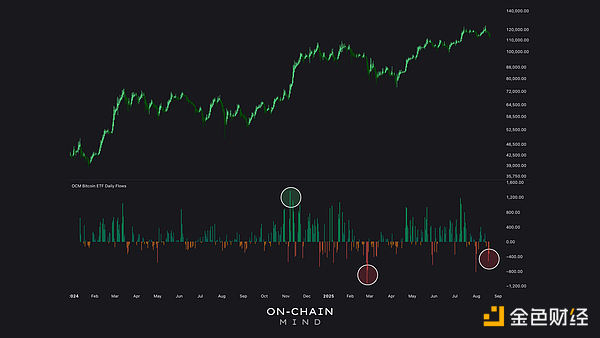
The largest outflow occurred in February 2025, when Bitcoin fell from $100,000 to $83,000, a 17% drop that triggered panic selling. Conversely, the largest inflow occurred during the November 2024 rebound, when Bitcoin rose from $70,000 to $90,000. These patterns are real-time manifestations of behavioral finance principles, such as herd mentality and loss aversion.
From an educational perspective, these numbers
offer a contrarian strategy:
- Buy heavily on red trading days with large outflows.
- Reduce purchases on green trading days with surging inflows.
It could be just that simple.
Flow Volatility
Another layer of my analysis is flow volatility, which tracks the degree of daily flow fluctuations relative to historical averages. The red areas in the chart below indicate high volatility, usually coinciding with significant price swings.
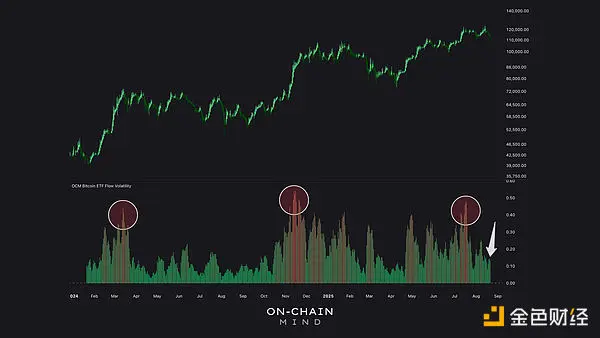
Interestingly, during the recent $10,000 drop from all-time highs, volatility has remained low. This reflects Bitcoin’s maturity: what used to be a “crash” is now just routine volatility. Three to five years ago, similar moves could have halved the price; now, with a market cap exceeding $2 trillion, such swings are just minor episodes.
Flow-Weighted Average Price (FWAP)
Perhaps the most innovative indicator is the Flow-Weighted Average Price (FWAP), an experimental metric that weights Bitcoin’s price by daily ETF flows. This indicator calculates the sum of price-flow products and the decaying cumulative sum of flows, emphasizing recent activity to reflect the current sentiment of holders.
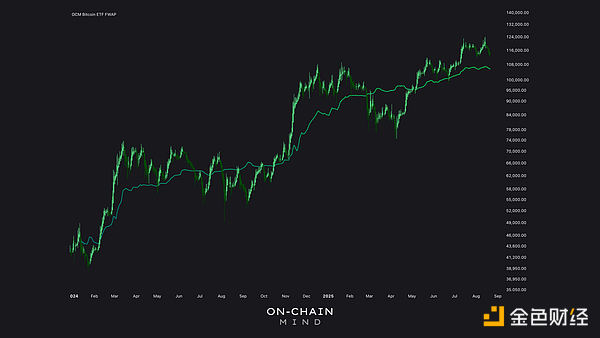
I’ve started to view this as the ETF version of “realized price”—a cornerstone of on-chain analysis representing the average price at which all tokens last changed hands. FWAP similarly attempts to estimate the average cost basis, but specifically for ETF investors.
Currently, the average cost is $105,000, which is also close to the realized price for short-term holders. This suggests that even during this pullback, ETF holders may still be in profit. Recent history shows that when the price falls below this level, panic selling occurs, marking local bottoms amid extreme pessimism.
The potential of this indicator also extends to derivatives, such as FWAP-based oscillators and risk metrics, so I will further refine these indicators in the coming weeks. But even now, it provides a unique perspective on the institutional/retail cost basis—something I haven’t seen elsewhere.
Bullish Signals from Tightening Supply
From a more macro perspective, it’s clear: ETFs are structurally absorbing Bitcoin supply at a pace far exceeding mining output, fundamentally reshaping the supply landscape. This “supply absorption” is bullish in the long term, as it reduces the amount of Bitcoin available for spot trading.
But this doesn’t mean it will “always go up.” As we can clearly see from the flow data, when prices fall, investors are also happy to sell their coins (or shares). So this is something I will be watching closely.
This data also reveals some surprising insights. Although ETFs are quietly absorbing large amounts of Bitcoin, flow data provides a fascinating window into human psychology. The emerging indicators discussed here represent the cutting edge of flow-based Bitcoin analysis and will undoubtedly become key tools in my future accumulation strategies.
At the current pace, as the market evolves, these ETFs and the metrics tracking them will only become more and more important.
Disclaimer: The content of this article solely reflects the author's opinion and does not represent the platform in any capacity. This article is not intended to serve as a reference for making investment decisions.
You may also like
Hong Kong Sets Global Standard by Regulating Virtual Assets with New Self-Policing Body
- Hong Kong launches VALA, a self-regulatory body to standardize virtual asset exchanges and boost market transparency. - VALA mandates AML/CTF compliance, cybersecurity, and governance to safeguard assets and ensure fair trading practices. - The initiative aligns with global fintech trends, aiming to attract institutional investors and solidify Hong Kong's digital asset leadership.

Investors Bet Against Nvidia Despite Earnings Win, Question China Stumble
- Nvidia's Q2 2025 earnings beat expectations but stock fell due to China H20 sales absence and regulatory burdens. - Missing $4-8B in China revenue highlights U.S. export restrictions' impact on growth and operational flexibility. - New 15% China revenue-sharing deal with U.S. government reduces profitability and raises margin concerns. - Despite AI innovations like Blackwell Ultra, market doubts persist over China market resilience and valuation sustainability. - As S&P 500 bellwether, Nvidia's performan

Nvidia's AI Empire Grows, But China Clouds Loom
- Nvidia's Q2 revenue surged 56% to $46.7B, driven by $41.1B in data center sales amid AI infrastructure demand. - Data center compute revenue dipped 1% due to $4B H20 chip sales drop to China, now excluded from guidance. - Gaming revenue exceeded $4.3B, while Q3 outlook rose to $54B±2%, excluding China-linked H20 sales. - Blackwell AI chips generated $27B in prior quarter sales, positioning Nvidia to meet U.S. export rules and Chinese market needs. - Despite 88% sales concentration in data centers, market

Investors Turn to VeChain as Stable Alternative to Speculative Altcoins
- VeChain (VET) gains traction in 2025 as a stable enterprise-focused crypto asset amid broader market rallies. - VET's $0.02597 price (October 2025) reflects 10.39% weekly gains driven by supply constraints and institutional adoption. - Strategic partnerships with luxury brands, pharmaceuticals, and agriculture sectors enhance VET's real-world utility and credibility. - Analysts project $0.0265+ price targets by year-end, contingent on sustained institutional interest and favorable regulatory shifts. - VE