XRP price is consolidating around $3.00 after a run above $3.50, trading inside a symmetrical triangle with rising risk of a downside break if support near $2.90 fails; Bitcoin tests the 100-day EMA and Ethereum targets $5,000 as the market awaits renewed buying pressure.
-
XRP price faces a potential breakdown if it closes below $2.90, despite longer-term support at the 200-day EMA.
-
Bitcoin is testing the 100-day EMA near $111,000; a decisive loss could push BTC toward the 200-day EMA around $103,800–$100,000.
-
Ethereum remains resilient near $4,600 with RSI ~61; a breakout above $4,800 would open a path to $5,000 and a fresh leg higher.
XRP price consolidation near $3.00 risks breakdown; Bitcoin tests its 100-day EMA and Ethereum eyes $5,000 — read COINOTAG’s concise technical update now.
What is the XRP price outlook?
XRP price is consolidating near $3.00 after a sharp run-up, trading inside a symmetrical triangle that increases the probability of a downside breakout if support levels fail. Short-term momentum is fading, and a daily close below $2.90 would raise the risk of a deeper correction toward EMA support.
The daily chart shows buyers struggling to sustain rallies above $3.20, while the Relative Strength Index sits near 48, indicating neutral momentum with room to fall. The 100-day EMA at approximately $2.76 provides the first meaningful support; the 200-day EMA near $2.49 is a stronger long-term floor.
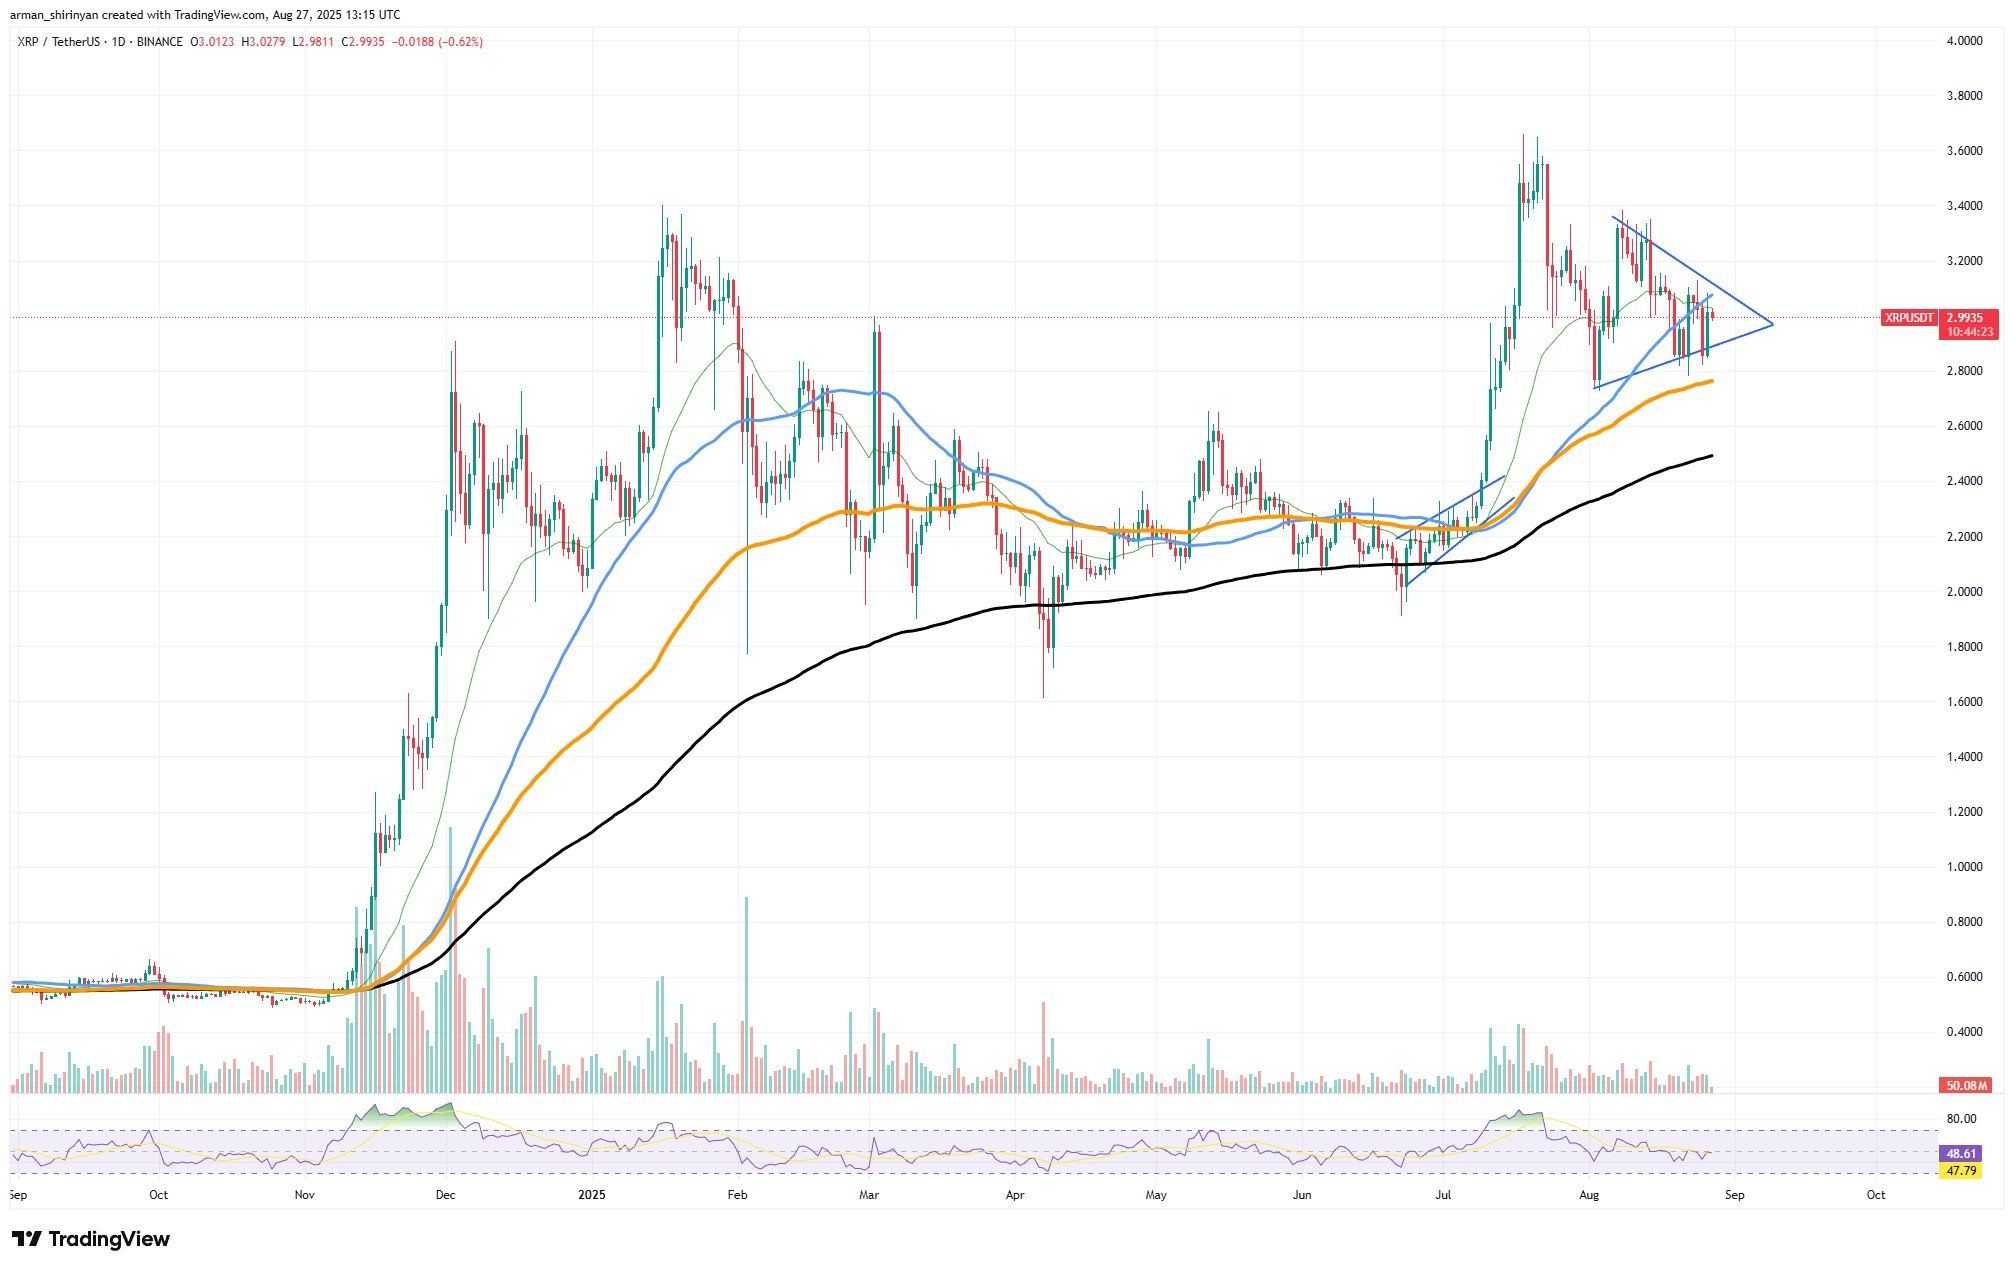
XRP/USDT Chart by TradingView
How does volume and momentum influence the XRP setup?
Volume has declined since the July rally, signaling a lack of fresh inflows and raising the likelihood that consolidation converts to correction if the triangle breaks down. Neutral RSI and repeated rejections at $3.20 illustrate weakening buyer conviction.
How does Bitcoin’s 100-day EMA test affect the market?
Bitcoin 100-day EMA is a critical technical battleground as BTC trades near $111,000 after topping around $126,000 earlier in the cycle. Repeated failures to reclaim the $115,000–$116,000 band suggest sellers control near-term direction, increasing downside risk.
If the 100-day EMA gives way, the 200-day EMA near $103,800 and the psychological $100,000 level become the next structural supports. Because $100,000 lacks prior consolidation, a breach could accelerate liquidations and push BTC into the mid-$90,000s quickly.
What do momentum indicators say about Bitcoin?
RSI at roughly 41 is the weakest since spring, and declining volumes on bounces confirm a lack of buyer conviction. A decisive rally above $115,000 would shift the narrative back to bullish and open tests of $120,000+; until then, bears have the edge.
Why does Ethereum still target $5,000?
Ethereum $5,000 remains an attainable target as ETH trades around $4,600 and has used the 20-day EMA as reliable dynamic support. Higher lows since July and an RSI near 61 indicate bullish momentum without overextension.
A breakout above $4,800 would likely accelerate upside pressure and increase the probability of a run to $5,000 and higher. Relative outperformance versus Bitcoin and some altcoins has kept ETH structurally stronger in recent volatility.
What technical signals support an ETH push to $5,000?
Consistent support at short-term EMAs, steady volume on advances, and constructive momentum indicators underlie the bullish case. Absence of deep corrections and the persistence of higher lows strengthen ETH’s path to a new leg higher.
Frequently Asked Questions
What immediate levels should traders watch for XRP?
Watch support at $2.90 (triangle lower boundary) and EMA support at $2.76 (100-day) and $2.49 (200-day). A break below $2.90 increases the risk of a deeper correction.
How can traders interpret Bitcoin’s current test?
Interpret the 100-day EMA test as a gauge of medium-term strength: reclaiming $115k-$116k favors bulls, but failing it points to the 200-day EMA near $103,800 as the next major test.
Key Takeaways
- XRP price consolidation: Symmetrical triangle near $3.00 risks downside if $2.90 is lost.
- Bitcoin technical test: 100-day EMA near $111,000 is decisive; loss leads to 200-day EMA and $100,000 risk zone.
- Ethereum momentum: ETH near $4,600 with RSI ~61; a clear break above $4,800 targets $5,000.
Conclusion
This technical update highlights increased short-term risk across major assets: XRP price sits at a critical inflection, Bitcoin must defend the 100-day EMA to avoid deeper declines, and Ethereum looks poised for a potential run to $5,000. Monitor EMAs, volume, and RSI for confirmation; COINOTAG will provide updates as conditions evolve.