Bitcoin Price Prediction: Will the Fed’s Rate Cut Push BTC to 140K?

Bitcoin price is once again at a pivotal point. The Federal Reserve just delivered its first interest rate cut since December 2022, and the daily BTC price chart is hinting at an attempt to push higher. The big question is whether this policy shift will give Bitcoin price enough momentum to reclaim fresh highs, or if the market is setting up for another round of consolidation.
Fed’s rate cut and why it matters for Bitcoin Price Prediction
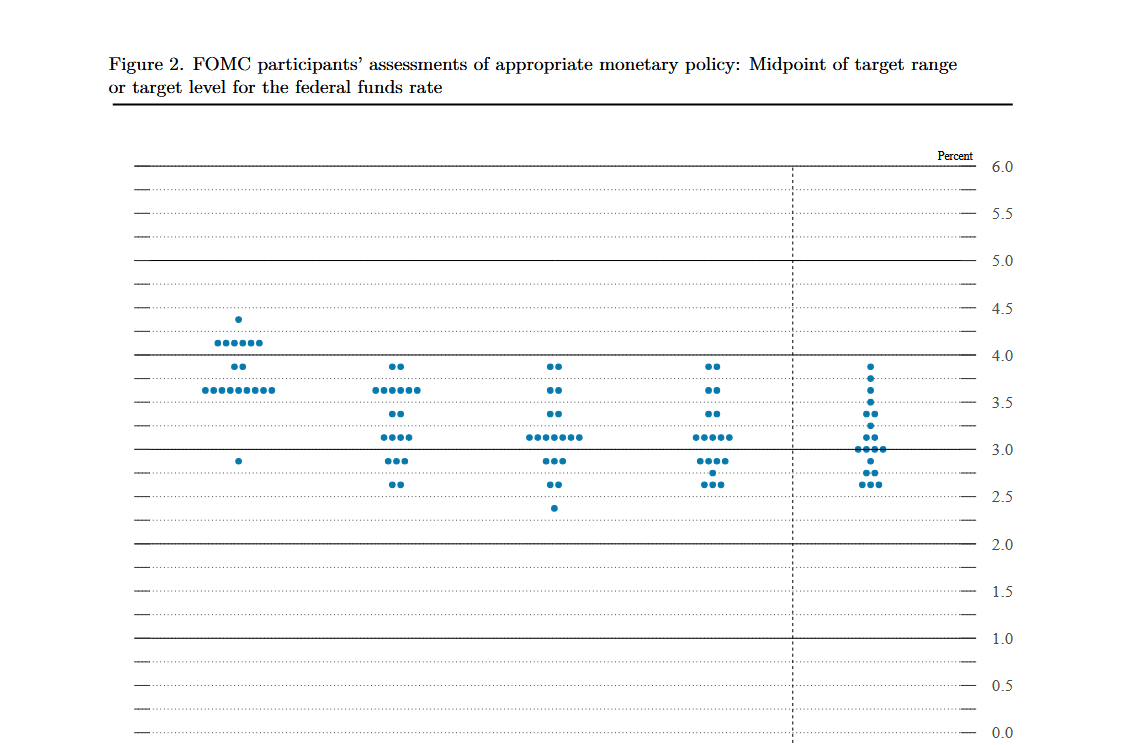
The Fed lowered its key rate by 25 basis points to a range of 4 to 4.25 percent. More importantly, officials signaled that two more cuts could follow this year, bringing rates down to 3.5 to 3.75 percent. On paper, lower interest rates reduce borrowing costs, encourage liquidity, and push investors toward risk assets. Bitcoin often thrives in these liquidity-driven environments because it is treated like a hedge against both loose monetary policy and political uncertainty.
At the same time, the divided vote inside the Fed committee shows a dilemma. Inflation is still above target, but the risks of unemployment are rising. This uncertainty means markets will remain volatile. For Bitcoin price, that usually translates into sharper moves rather than flat trading.
Apart from that, adding to the spectacle surrounding the Fed’s decision, a 12-foot golden statue of President Donald Trump holding a Bitcoin was temporarily installed outside the U.S. Capitol. The display, funded by a collective of cryptocurrency investors, was timed to coincide with the announcement and designed to spark debate about digital currency’s role in modern finance.
Organizers framed it as a symbol of the intersection between politics and monetary innovation, underscoring how Bitcoin is increasingly tied to national economic conversations. The unusual installation served as a reminder that crypto is no longer operating on the sidelines but is now part of the broader discourse on policy and financial power.
Current technical setup
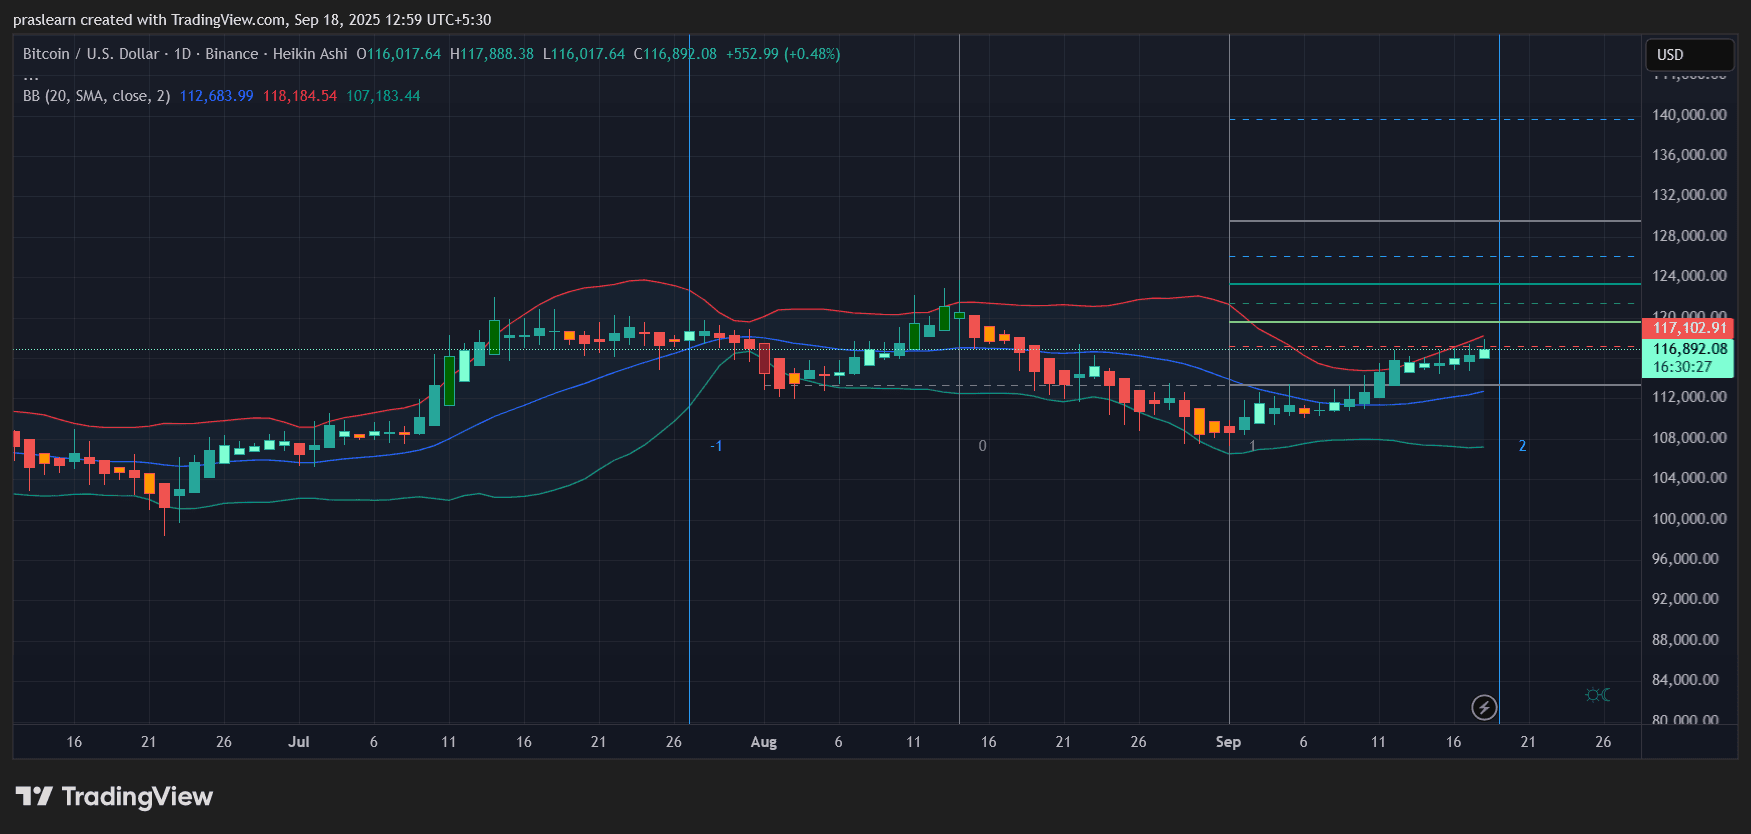 BTC/USD Daily Chart- TradingView
Looking at the BTC price daily chart , price is trading around 116,800 USD. After weeks of sideways action in August and early September, Bitcoin has broken above its mid-Bollinger Band and is pushing toward the upper band, now near 118,000 USD. This suggests building bullish momentum.
The Fibonacci retracement levels plotted above the current price highlight potential resistance zones. The nearest challenge sits around 120,000 USD, with extended targets at 124,000 USD and 128,000 USD. If momentum accelerates, the psychological 140,000 USD mark comes into play.
Support remains firm around 112,000 USD, where the lower Bollinger Band and recent consolidation align. A break below that would expose 108,000 USD and possibly drag sentiment lower.
Macro meets chart action
Historically, Bitcoin price rallies tend to gain traction when the Fed signals easing. Investors reallocate into risk-on trades as real yields fall. However, this time political pressure on the Fed adds a layer of unpredictability. Trump’s push for deeper cuts and attempts to reshuffle the Fed board show the institution is under stress, which could amplify Bitcoin’s role as a hedge against systemic risk.
If the Fed follows through with more cuts this year, the backdrop could resemble 2020’s liquidity wave that pushed BTC into price discovery. But in the short term, Bitcoin still needs to clear technical resistance levels before bulls can take control.
What to watch next?
Near-term direction hinges on whether BTC price can close daily candles above 117,500–118,000 USD. Sustained strength here opens the door toward 120,000 USD and beyond. Failure to break this band, however, could trap Bitcoin in another consolidation range between 112,000 and 118,000 USD.
Macro events will drive volatility. Traders should keep an eye on Fed communications, inflation prints, and labor market data. If unemployment ticks up faster than expected, the Fed may accelerate its easing path, which would almost certainly boost Bitcoin.
Bitcoin Price Prediction: Where BTC Price goes from here?
Short term, $Bitcoin price looks set to test 120,000 USD . If it clears that resistance with conviction, the next leg toward 124,000–128,000 USD could unfold quickly. On the downside, a pullback to 112,000 USD remains possible if bulls fail to maintain current momentum.
Medium term, as liquidity returns and the Fed leans dovish, the probability skews toward higher highs for Bitcoin. The path will be choppy, but the structure suggests $BTC could challenge the 130,000–140,000 USD range before year-end if macro conditions stay supportive.
📈 Want to Trade Bitcoin?
Start now on Bitget: Sign Up Here
Check Live BTC Chart: BTC/USDT on Bitget
or You an check the Crypto Exchange Comparison.
Disclaimer: The content of this article solely reflects the author's opinion and does not represent the platform in any capacity. This article is not intended to serve as a reference for making investment decisions.
You may also like
The Bank of England keeps interest rates unchanged as expected and slows the pace of balance sheet reduction.
The Bank of England reiterated its cautious stance on future interest rate cuts, emphasizing that inflationary pressures remain significant. The government's autumn budget may become the decisive factor for the interest rate cut path for the remainder of the year.
Highlights of the Federal Reserve FOMC Statement and Powell's Press Conference
This FOMC decision and Powell’s speech sent a clear signal: the Federal Reserve is resuming rate cuts, but at a more cautious pace, with the core focus on balancing inflation stickiness and the risk of a slowdown in employment.
Initial Jobless Claims Data Stages a "Magic Show": From the Highest in Nearly Four Years to the Largest Drop in Nearly Four Years in an Instant!
Just a week ago, initial jobless claims had surged to their highest level in nearly four years, sparking market concerns over a spike in layoffs. However, the latest data released today presents a dramatic turnaround.
Tokenized Deposits Used to Optimize Cross-Border Settlements