- XRP is trading at $2.80 and experiencing a daily fall of 2.2 percent but it is holding at $2.79 and $2.92 on the resistance and support side respectively.
- The 3-day chart shows a cup-and-flag pattern which shows consolidation followed by possible continuation of breakout.
- The RSI of 37.62 and near-neutral MACD indicators demonstrate low volatility but gradual accumulation in the present position.
The most recent chart format of XRP is orienting towards an emerging bullish trending pattern because, according to the market statistics, market conditions are in tightening range patterns awaiting a potential breakout. The token is currently trading at $2.80, which constitutes a 2.2 percent decrease in the last 24 hours.
Compared to Bitcoin, XRP increased by 1.6 percent and traded at 0.00002303 BTC. Technical indicators provide strong support on the level of $2.79 and resistance on the level of $2.92 which creates a strict but decisive price range. The chart patterns and oscillator values point out to the possible accumulation of momentum that might cause a major volatility as soon as a breakout takes place.
Cup Formation Suggests Base Strength
The 3-day XRP/USDT chart reveals a rounded bottom formation, which has gradually transitioned into a descending flag pattern. This structure often develops following extended upward movement, allowing consolidation before another attempt higher.
Notably, the curved recovery phase earlier in the year established a strong foundation near the $2.20 to $2.40 zone. This region continues to act as a crucial support base during current market retracements.
Price movements within the flag boundaries demonstrate controlled pullbacks and repeated rebounds near the lower range. The resistance slope at approximately $2.92 remains the next critical area for confirmation of direction. Sustained pressure above this level may indicate that XRP is preparing for a sharper upward extension following the base-building phase.
Momentum Indicators Reflect Weak but Stable Activity
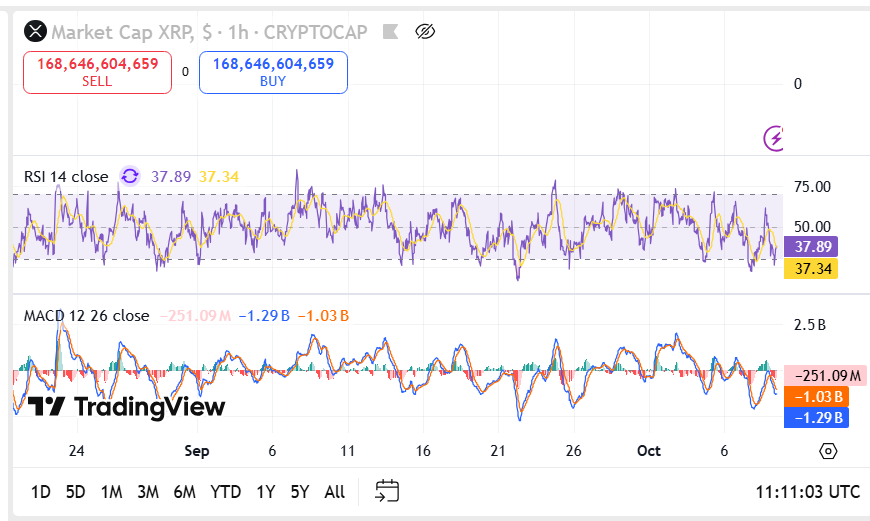
According to hourly technical information provided by Trading View, the Relative Strength Index (RSI) has moved around 37.62, with a signal of 37.32. This positioning shows that XRP is trading in the lower neutral range with weak signs of being oversold but no strong downplay pressures. Nevertheless, the rebounds of the index around this level being repeated during the last week indicate the accumulating activity in a steady manner.
 Source: TradingView
The MACD readings confirm this observation, showing a histogram contraction toward equilibrium. The MACD line remains close to the signal line at -253.76M against -1.03B, revealing minor negative momentum but no sharp divergence. Such behavior frequently precedes a price compression stage before a strong market move.
Market Balance and Short-Term Range Outlook
Market volume statistics reveal that the current market is almost evenly divided between the buyers and the sellers, with each party having approximately 168.6 billion with regard to market cap flow. Such balance highlights existing uncertainty in the trading range, but slight purchasing power continues over the level of support of $2.79.
With XRP still coined in this structure, the question is whether the price action will be able to preserve itself above the curved base and meet the resistance of the upper boundary of the falling channel. By exceeding the breakout point of $2.92, there is a possibility that the move will continue to higher resistance levels whereas failure to secure the bottom limit may escalate more consolidation.