- PEPE is stable with the support level at the range of $0.056964 and resistance close to $0.057426.
- The RSI of 43.42-52.67 is a neutral momentum, which implies that there are equal buying and selling forces.
- MACD values are stable and show a cool period in the market and a potential accumulation before becoming directional.
Pepe (PEPE) has exhibited consistent movement in a narrow trading of price, which depicts a short-term equilibrium. PEPE is currently trading at $0.057289, which is a 1.7 per cent decrease in the last 24 hours. Although there is this minority dip, the token continues to be stuck above the level of $0.056964 with the resistance indicated to be around $0.057426.
Relative Strength Index (RSI) and MACD on the hourly chart indicate the presence of the initial signs of the market stabilization, which indicates a decreased volatile environment. The RSI is close to 52.67, which represents the neutral momentum and the MACD depicts little divergence, which represents the equilibrium between the selling and buying pressures.
Technical Indicators Reflects Tight Trading Structure
The RSI data highlights a restrained trading environment, with values oscillating between 43.42 and 52.67 during the latest session. This narrow band implies limited directional strength as traders await a more decisive move. The indicator remains positioned around the midpoint of its range, showing neither overbought nor oversold conditions. Consequently, price movement has stayed confined between established levels, reflecting cautious sentiment.
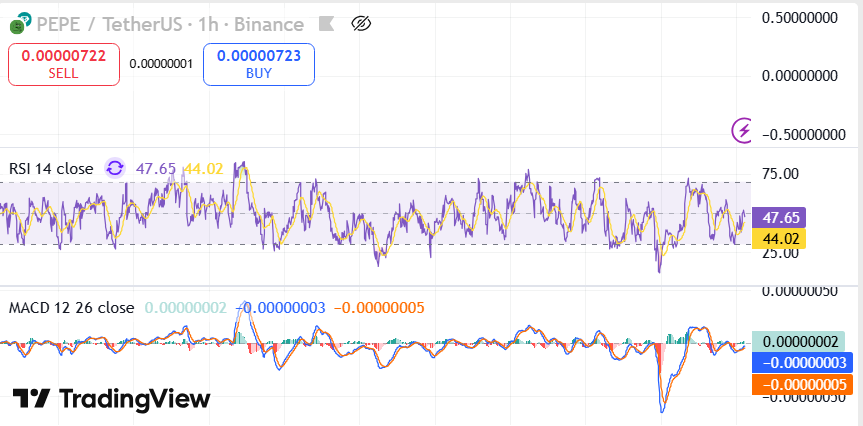 Source: TradingView
The MACD (12, 26, close) values show minimal deviation, with the histogram displaying limited expansion. Current readings of 0.00000002, –0.00000003, and –0.00000005 demonstrate the absence of major momentum shifts. Such narrow separation between moving averages confirms that the market remains in a neutral phase.
In this context, PEPE’s short-term structure reflects controlled activity rather than volatility-driven trading. The reduced amplitude on the MACD histogram supports this observation, indicating that neither buyers nor sellers have gained a decisive advantage. The pattern mirrors a consolidation setup where liquidity pools form before a more directional movement occurs.
Support and Resistance Define Near-Term Outlook
The price activity still maintains a 24hs range between $0.056964 (support) and $0.057426 (resistance). Both tests of the upper limit have been slightly rejected and rebounds of the lower limit are steady. This is the defined range, which describes the current equilibrium which prevails in the trading conditions.
The market data also indicates that PEPE is trading 1.5 per cent higher at 0.0106536 BTC, and the increase in PEPE is also 0.8 per cent at 0.081799 ETH. These comparative advantages over leading cryptos are indicative of the fact that, even when it is weak in the short term, basic demand has been maintained. A breakout out of this tight range would however require sustained trading above the current resistance. At the moment, the arrangement is contained, and traders will monitor the growth of the volumes close to the critical price brackets.