Alpaca Finance price today is trading near $0.265, attempting to stabilize after an early May correction that followed a parabolic rally above $1.20. Despite the sharp pullback, Alpaca Finance Price Action is showing signs of volatility compression near key horizontal support, with short-term technicals hinting at a potential reversal if bulls reclaim control above the $0.30–$0.32 resistance band.
What’s Happening with Alpaca Finance’s Price? Compression After Price Spikes
 ALPACA price dynamics (Source: TradingView.)
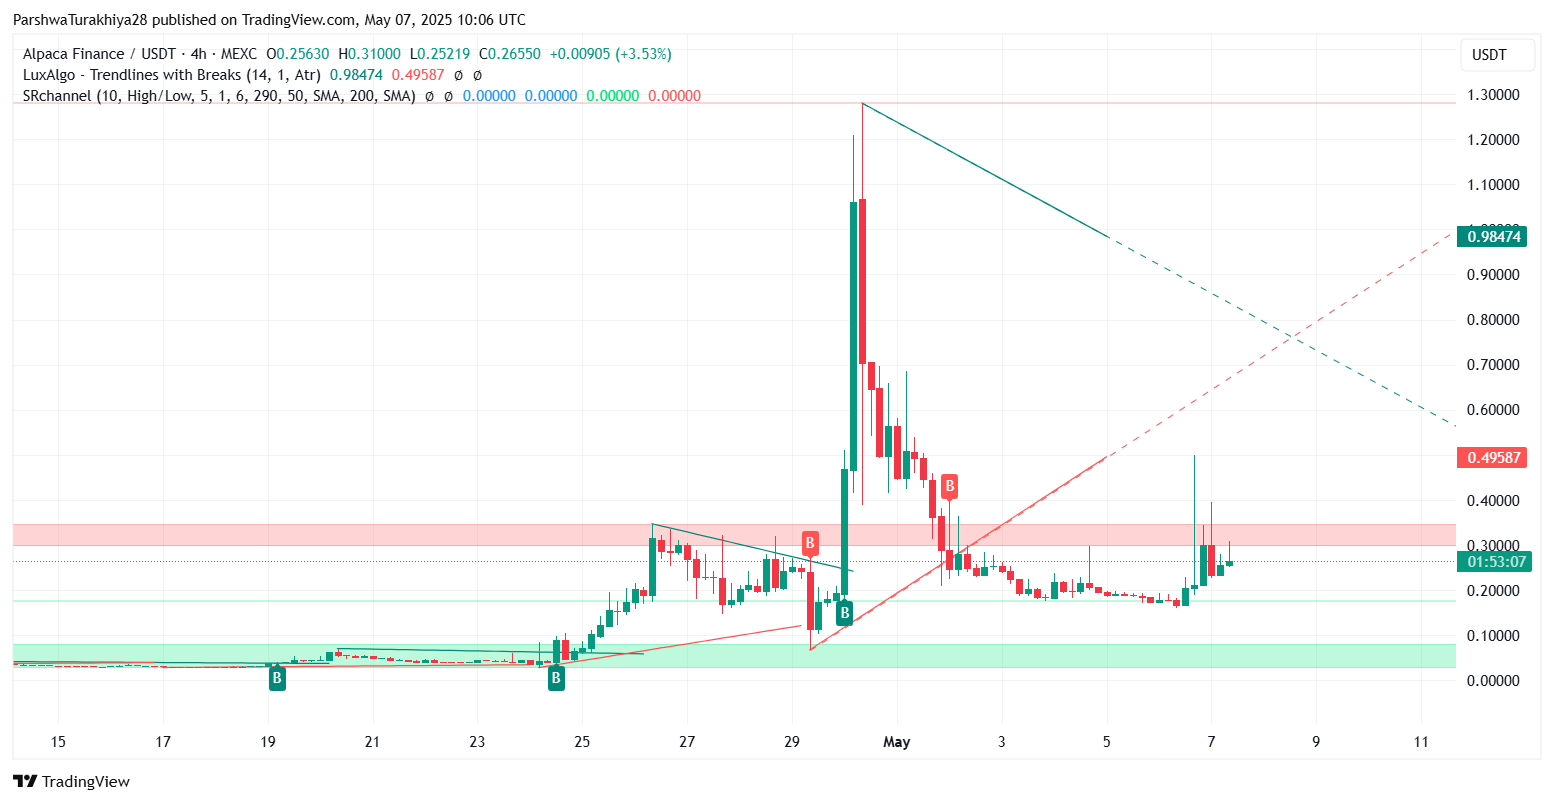
 On the 4-hour chart, ALPACA remains inside a descending triangle structure, with support building near $0.252 and resistance just above $0.31. Price action has been reacting sharply within this range, as seen during the May 6–7 intraday spike that briefly tested the upper bounds before fading back below $0.30.
Alpaca Finance Price Spikes last month propelled the token above $1.20, but the rejection from the peak triggered a retracement toward the breakout origin zone around $0.25. This zone has since acted as a short-term floor, with traders closely watching for higher lows to confirm the formation of a base.
Bulls must reclaim the mid-channel resistance near $0.31 to invalidate the current bearish triangle pattern. A confirmed break of this zone could open the door toward the $0.495–$0.50 level, where a previous trendline and horizontal resistance intersect.
Alpaca Finance Price Prediction 2025: Weak Follow-Through and EMA Pressure
 ALPACA price dynamics (Source: TradingView.)
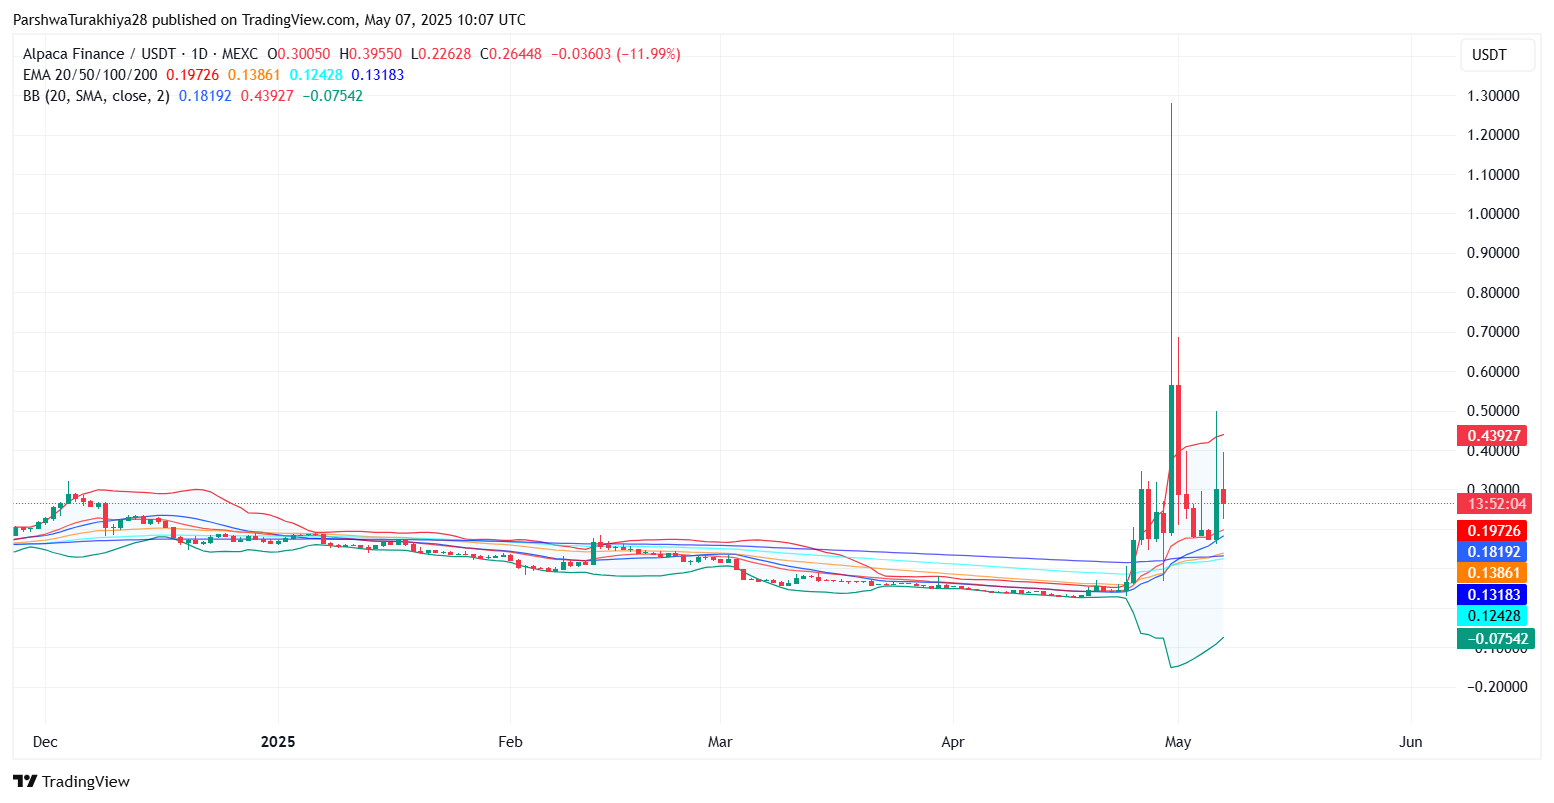
 The daily chart shows the Alpaca Finance price slipping after a failed breakout above the upper Bollinger Band at $0.43, which coincided with heavy resistance near the 200-EMA. The current rejection from that area led to a sharp 12% intraday decline, pushing price back toward the mid-range Bollinger band at $0.18.
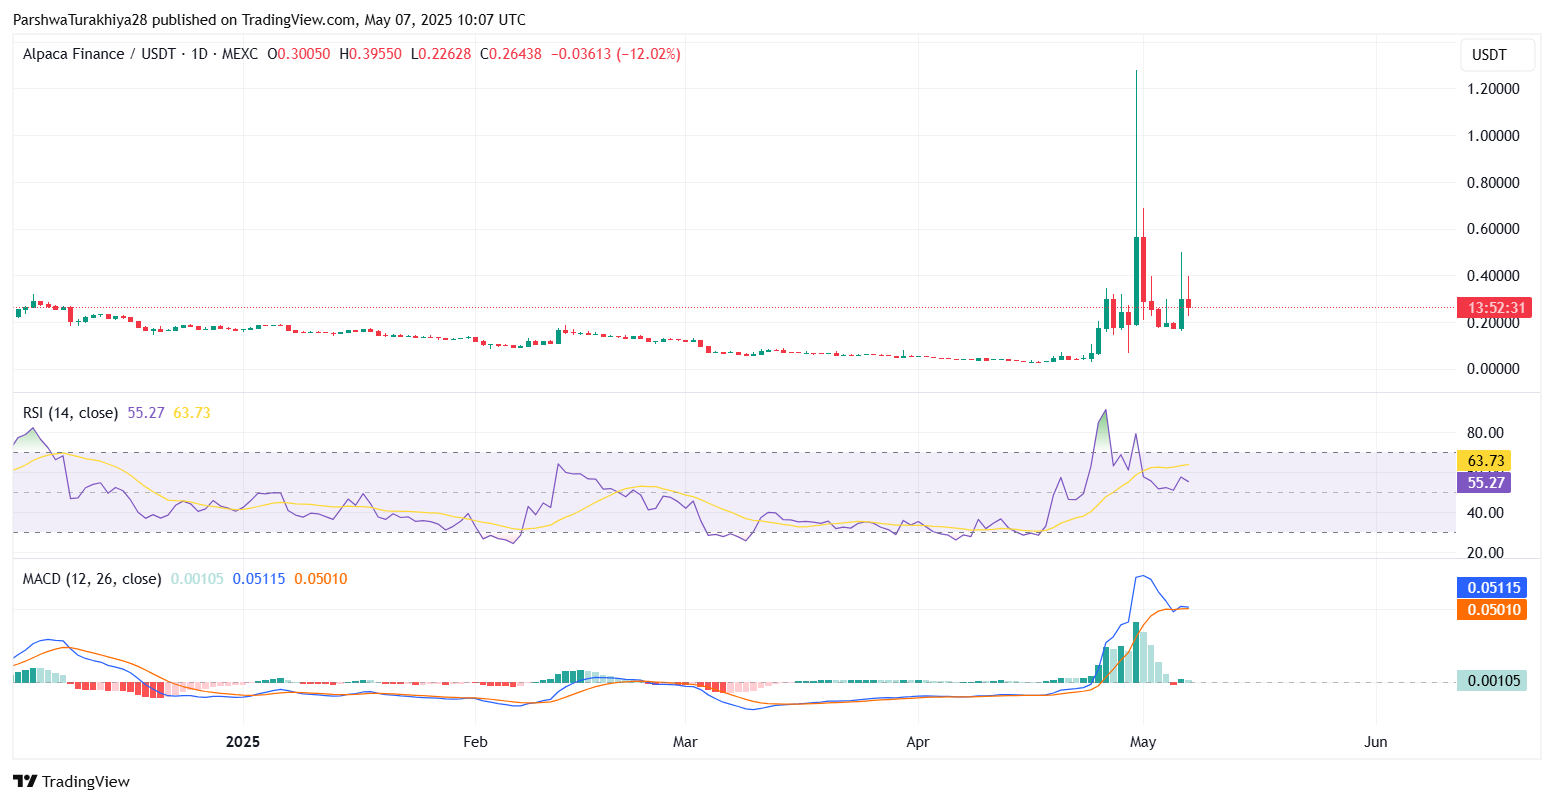
Momentum indicators remain mixed. The daily RSI has cooled off from its recent peak at 73 to 55, signaling weakening momentum but avoiding oversold territory. The MACD remains positive, but the histogram bars are shrinking—pointing to waning bullish momentum.
Crucially, the EMA cluster (20/50/100/200) now sits well below current price levels, with the 50-EMA at $0.13 and the 100-EMA at $0.12. This suggests room for deeper retracement if $0.25 breaks, although the overall bullish structure from late April remains valid above $0.18.
Alpaca Finance Price Forecast 2025: Is a Recovery Back Toward $0.50 Possible?
 ALPACA price dynamics (Source: TradingView.)
 From a broader perspective, Alpaca finance price volatility has surged since mid-April, but the current consolidation range between $0.25 and $0.31 will define the next major move. A confirmed push above $0.31 could allow ALPACA to retest the breakdown zone at $0.495, especially if the RSI rebounds above 60 and MACD histogram flips back into bullish expansion.
However, if bears force a clean break below the $0.25–$0.24 zone, the token risks sliding toward the $0.18 support, which aligns with the lower Bollinger band and prior accumulation zone.
Until one of these break zones is cleared, Alpaca finance price update suggests more sideways action with isolated volatility spikes. Traders should monitor volume alongside RSI/MACD divergence to spot early trend reversals.
Alpaca Finance (ALPACA) Price Prediction 2025: Forecast Table
| Indicator | Level / Signal | Bias |
| Current Price | $0.265 | Neutral |
| Key Support | $0.252 / $0.185 | Holding, Watch Closely |
| Key Resistance | $0.310 / $0.495 | Breakout Needed |
| RSI (Daily) | 55.27 | Neutral to Weak Bullish |
| MACD (Daily) | Histogram Shrinking | Loss of Momentum |
| EMA Levels (20/50/100/200) | $0.197 / $0.138 / $0.124 / $0.131 | All Below Price |
| Bollinger Bands (Daily) | Mid: $0.18 / Upper: $0.43 | Volatility Compression |
| Short-Term Outlook | Sideways-to-Bullish | Awaiting Breakout |
Disclaimer: The information presented in this article is for informational and educational purposes only. The article does not constitute financial advice or advice of any kind. Coin Edition is not responsible for any losses incurred as a result of the utilization of content, products, or services mentioned. Readers are advised to exercise caution before taking any action related to the company.