

Synchrony Financial
Terakhir diperbarui pada 2026-07-15 11:21 EST. Informasi harga saham bersumber dari TradingView dan merefleksikan harga pasar real time.
Perubahan harga saham SYF
Data utama SYF

Bitget membuka era baru Stocks 2.0:
Cara baru untuk trading saham — kapan saja, di mana saja, 24/7.
Akses likuiditas Wall Street, pembayaran dividen, dan dukungan margin futures.
Pelajari selengkapnyaRingkasan Synchrony Financial
SYF Pulse
Pembaruan harian tentang harga saham SYF, arus dana, dan berita pasar, yang dihasilkan oleh AI dan ditinjau oleh tim analis kami. Selalu DYOR.
Prakiraan Harga Saham SYF
Berdasarkan indikator teknis untuk saham SYF, harga diperkirakan akan berfluktuasi di kisaran 70.95–81.40 USD selama seminggu ke depan. Analis pasar memprediksi bahwa harga saham SYF kemungkinan akan berfluktuasi di kisaran 60.04–110.10 USD selama beberapa bulan ke depan.
Berdasarkan prakiraan harga selama 1 tahun dari 82 analis, estimasi tertinggi adalah 113.09 USD, sementara estimasi terendah adalah 58.68 USD.
Saham trending
Trading saham spot di Bitget
Trading perpetual saham di Bitget
Tentang Bitget
Berita saham SYF terbaru
Weave Communications, Inc (NYSE: WEAV) baru-baru ini mengumumkan bahwa mereka telah mencapai kerja sama strategis penting dengan penyedia layanan pembiayaan pasien terkemuka di industri, Synchrony®.
Raksasa fintech Synchrony Financial baru-baru ini mengumumkan perluasan kemitraan strategis dengan perusahaan ritel bahan bangunan rumah terkemuka di Amerika Serikat, Lowe's, dan secara resmi akan menjadi penerbit kartu kredit co-brand baru bagi para profesional renovasi rumah Lowe's.
Kompetitor SYF
| Nama | Kap. pasar | Harga | Perubahan % | Rasio P/E | EPS terdilusi (12 Bulan Terakhir) | Imbal hasil deviden (12 Bulan Terakhir) |
|---|---|---|---|---|---|---|
24.24BUSD | 113.11USD | -4.59% | 12.12 | 9.330 USD | 4.34% | |
26.49BUSD | 31.05USD | +0.08% | 12.87 | 2.411 USD | 3.42% | |
 TPG Inc. TPG | 16.20BUSD | 42.16USD | -1.21% | 192.75 | 0.219 USD | 5.25% |
23.90BUSD | 116.14USD | +1.00% | 14.75 | 7.872 USD | 0.22% | |
 Credicorp BAP | 31.06BUSD | 390.53USD | +0.34% | 15.00 | 26.028 USD | 3.72% |
 KeyCorp KEY | 25.04BUSD | 23.20USD | -0.43% | 14.21 | 1.633 USD | 3.52% |


Tren terbaru di industri saham dan strategi perdagangan saham Bitget
Tokenisasi saham muncul sebagai tren utama di persimpangan antara keuangan tradisional dan pasar mata uang kripto. Dengan membawa aset seperti saham ke dalam blockchain dan memfasilitasi perdagangan global 24/7, ini meningkatkan aksesibilitas, efisiensi, dan transparansi bagi para investor.
Bitget memandang dukungan perdagangan saham sebagai arah strategis utama dalam pengembangan platform. Bitget saat ini mendukung perdagangan token saham dan futures saham, dan telah menetapkan diri sebagai pemain utama di bidang ini.
Keunggulan utama dari futures saham Bitget terletak pada inovasi dan desain yang berfokus pada pengguna:
1. Pertama di dunia: Futures indeks saham yang ditokenisasi pertama di industri, didukung oleh berbagai sumber harga untuk transparansi dan keamanan yang lebih besar.
2. Leverage tinggi: Mendukung leverage hingga 25x, memaksimalkan efisiensi modal dan potensi imbal hasil.
3. Aset pendasar yang beragam: Mencakup ratusan saham populer, mendukung berbagai strategi perdagangan.
4. Biaya transaksi rendah: Biaya ditetapkan sebesar 0,06%, sehingga mengurangi biaya bagi para trader dengan frekuensi tinggi.
5. Mekanisme perhitungan indeks: Berdasarkan harga USDT dari aset yang ditokenisasi dari berbagai emiten (misalnya, xStocks, Ondo). Bobot dihitung ulang secara berkala atau setiap kali terjadi peristiwa pasar besar untuk memastikan indeks tetap sejalan dengan kondisi pasar.
Per awal bulan Desember 2025, Bitget telah mencatat volume perdagangan lebih dari $18 miliar di pasar futures saham, menjadikannya salah satu platform terpopuler untuk token saham dan futures saham. Pada akhir tahun 2026, volume perdagangan kumulatif Bitget di pasar futures saham diperkirakan akan melebihi $100 miliar.
Lanjutkan membaca untuk mempelajari lebih lanjut tentang aset yang didukung untuk diperdagangkan di Bitget, serta informasi detail tentang token saham Bitget dan futures saham.


Perbedaan utama antara Bitget dan broker tradisional
Apa saja keunggulan utama dari Bitget Stocks 2.0?
1. Akses kedalaman pasar saham AS yang sesungguhnya, dengan eksekusi trading yang cepat dan latensi rendah.
2. Perdagangkan saham yang dijamin 1:1 oleh aset dasar di dunia nyata, dan dividen ditambahkan langsung ke akunmu.
3. Gunakan aset sahammu di seluruh ekosistem margin dan yield Bitget.
Bagaimana cara memulai trading saham di Bitget?
1. Buat akun, lalu selesaikan verifikasi identitas.
2. Depositkan USDT ke akun spot-mu.
3. Buka bagian trading saham.
4. Lakukan trading dan kelola posisimu.
Artikel yang berkaitan dengan token saham dan futures saham
Selama bertahun-tahun, saham yang ditokenisasi dianggap sebagai gagasan ambisius: cara untuk membawa ekuitas tradisional ke atas rel blockchain, mengurangi hambatan penyelesaian, memperluas akses global, dan membuat aset dunia nyata lebih dapat digunakan di seluruh sistem keuangan native kripto. Pada 2026, gagasan itu menjadi infrastruktur pasar yang nyata. Exchange kripto, penyedia infrastruktur broker, platform Tokenisasi aset, dan institusi keuangan tradisional kini sedang mengeksplorasi bagaimana saham, ETF, dan sekuritas lainnya dapat hadir on-chain dalam bentuk yang lebih transparan dan dapat diprogram. Bitget melaporkan bahwa volume trading spot saham tokenisasi kumulatifnya telah melampaui $1M pada Januari 2026, sementara futures sahamnya telah melewati volume trading kumulatif sebesar $10M, menunjukkan bahwa ekuitas yang ditokenisasi sedang menjadi kategori pasar yang aktif, bukan sekadar use case teoretis.
Reality Protocol, platform penerbitan aset dunia nyata dalam ekosistem Bitget, memasuki pasar ini dengan model yang dibangun di sekitar rTokens: aset on-chain yang dirancang untuk merepresentasikan eksposur ekonomi terhadap ekuitas dan ETF AS yang diperdagangkan secara publik. Alih-alih memosisikan saham tokenisasi sebagai pembungkus kripto sederhana, Reality menghubungkan aset berbasis blockchain dengan infrastruktur broker, kustodi, verifikasi cadangan, dan penyelesaian. Peluncuran Bitget Stocks 2.0 pada Juni 2026 menambahkan lebih dari 500 aset terkait saham, termasuk ekuitas utama dan ETF seperti Apple, Tesla, NVIDIA, Microsoft, Amazon, Alphabet, dan Meta. Ini menempatkan rTokens di pusat pergeseran yang lebih luas, di mana aset dunia nyata tidak lagi terbatas pada platform keuangan tradisional, tetapi juga dapat menjadi bagian dari ekonomi Aset digital.
Artikel ini mengulas Reality Protocol dan rTokens sebagai jembatan baru antara Wall Street dan DeFi, dengan fokus pada cara kerja model ini, mengapa ini penting, dan apa yang perlu diketahui calon investor sebelum memperlakukan ekuitas tokenisasi sebagai bagian dari portofolio mereka.
Apa Itu Reality?

Reality adalah platform penerbitan aset dunia nyata (RWA) berlisensi dalam ekosistem Bitget. Platform ini dirancang untuk menghubungkan pasar keuangan tradisional dengan infrastruktur keuangan berbasis blockchain melalui penerbitan aset on-chain yang merepresentasikan eksposur ekonomi terhadap sekuritas dunia nyata. Pada fase utama pertamanya, Reality berfokus pada ekuitas dan ETF AS yang ditokenisasi, sehingga memungkinkan pengguna yang memenuhi syarat dan platform mitra untuk mengakses aset terkait saham melalui rel blockchain.
Reality vs. platform RWA tokenisasi lainnya
Pada intinya, Reality bertindak sebagai lapisan penerbitan di balik rTokens. Platform ini bekerja sama dengan infrastruktur broker berlisensi untuk mengakses sekuritas dasar yang terdaftar di bursa utama AS seperti Nasdaq dan NYSE. Kemudian, platform ini menggunakan saluran broker dan kustodi yang teregulasi untuk membeli dan menyimpan aset tersebut, sebelum menerbitkan token on-chain yang sesuai dan mencerminkan nilai ekonominya. Artinya, Reality bukan sekadar menciptakan pelacak harga digital. Modelnya bergantung pada hubungan antara suplai token, sekuritas dasar yang disimpan sebagai cadangan, eksekusi broker, pengaturan kustodi, dan proses verifikasi yang mendukung transparansi.
Reality termasuk dalam pasar aset dunia nyata atau RWA yang lebih luas. RWA adalah aset tradisional seperti saham, obligasi, dana, komoditas, dan instrumen pasar uang yang direpresentasikan secara on-chain. Tujuan utama Tokenisasi aset-aset ini adalah untuk membuatnya lebih mudah diakses, ditransfer, diselesaikan, dan diintegrasikan ke dalam sistem keuangan digital. Bagi investor, gagasan utamanya sederhana: Reality berupaya menghadirkan aset keuangan yang familier ke dalam format native kripto sambil tetap mengandalkan infrastruktur pasar yang teregulasi untuk dukungan aset dan eksekusi.
Platform ini juga dibangun untuk Interoperabilitas. rTokens dirancang untuk berpindah di berbagai wallet yang kompatibel, venue trading, dan aplikasi DeFi, tergantung pada dukungan platform dan persyaratan kelayakan. Ini memberi Reality dua peran: menghubungkan ke Wall Street melalui broker dan kustodian, sekaligus menghubungkan ke DeFi melalui token on-chain standar. Struktur ganda inilah yang membuat Reality relevan untuk fase berikutnya dari keuangan tokenisasi.
Apa Itu rTokens?
rTokens adalah Aset digital on-chain yang diterbitkan oleh Reality untuk merepresentasikan eksposur ekonomi terhadap sekuritas dunia nyata. Setiap rToken terhubung dengan aset dasar yang sesuai, seperti saham atau ETF AS yang diperdagangkan secara publik. Struktur penamaannya sederhana: token menambahkan prefiks “r” ke ticker tradisional.
Contohnya meliputi:
-
Apple → rAAPL
-
Tesla → rTSLA
-
NVIDIA → rNVDA
-
Invesco QQQ ETF → rQQQ
Tujuan rToken adalah menyediakan eksposur terkait saham dalam format native blockchain. Alih-alih mengakses ekuitas dan ETF tertentu hanya melalui akun broker tradisional, pengguna yang memenuhi syarat dapat mengakses versi tokenisasi dari aset tersebut melalui Reality, venue mitra terintegrasi, wallet yang didukung, atau produk exchange yang kompatibel.
Model Reality dibangun di atas pemetaan ekonomi 1:1. Artinya, setiap rToken dirancang untuk mencerminkan nilai sekuritas dasar yang sesuai. Menurut dokumentasi Reality, aset dasar dibeli dan disimpan dalam akun kustodi cadangan terpisah melalui broker-dealer yang terdaftar di FINRA dan menjadi anggota SIPC, dengan pendaftaran sekuritas akhir di DTCC. Cadangan dipertahankan pada rasio di atas 100% setiap saat, dan Reality melibatkan The Network Firm untuk menyediakan laporan atestasi cadangan independen yang dipublikasikan secara berkala dan dapat diakses publik.
Secara praktis, rTokens berpotensi digunakan untuk:
-
Memperdagangkan aset terkait saham tertentu dengan stablecoin seperti USDT
-
Menyimpan eksposur tokenisasi di wallet yang kompatibel
-
Mentransfer aset di berbagai lingkungan on-chain yang didukung
-
Berintegrasi dengan produk DeFi atau produk berbasis exchange yang memenuhi syarat, tergantung pada aturan platform
-
Mengakses eksposur fraksional tanpa perlu membeli satu token penuh
rTokens dapat dicetak dan ditebus 24 jam sehari, lima hari seminggu, menggunakan stablecoin. Ketersediaan trading disusun dalam empat sesi yang selaras dengan jam pasar AS:
-
Pra-Pasar: 03.00 WIB – 08.29 WIB
-
Reguler: 08.30 WIB – 14.59 WIB
-
Pasca-Pasar: 15.00 WIB – 18.59 WIB
-
Semalam: 19.00 WIB – 02.59 WIB
Ketersediaan dan batas sesi dapat berbeda menurut aset. Jeda singkat juga dapat terjadi antar-sesi, selama aksi korporasi seperti dividen atau stock split, atau sebagai respons terhadap kondisi pasar yang tidak biasa. Trading tidak tersedia pada akhir pekan atau hari libur pasar AS melalui Reality, meskipun venue sekunder dapat menetapkan aturan ketersediaannya sendiri.
Ketika pengguna yang memenuhi syarat membeli rToken dengan stablecoin, saham dasar yang sesuai dibeli secara real-time melalui broker berlisensi, dan rToken dikirim ke wallet yang ditentukan. Untuk keluar dari posisi, pengguna dapat menjual kembali rTokens ke Reality, setelah itu saham dasar dijual melalui broker berlisensi dan nilai yang setara dikembalikan dalam stablecoin. rTokens juga dapat diperdagangkan di venue sekunder, di mana harga dan biaya bergantung pada platform terkait.
Bagaimana Model rToken Bekerja
Model rToken dirancang untuk menghubungkan token on-chain dengan sekuritas off-chain. Secara sederhana, Reality menghubungkan catatan kepemilikan berbasis blockchain dengan infrastruktur pasar tradisional, sehingga sebuah token dapat merepresentasikan eksposur ekonomi terhadap saham atau ETF nyata.
Prosesnya umumnya mengikuti empat langkah:
-
Permintaan pengguna memulai alur: Pengguna yang memenuhi syarat atau platform terintegrasi mengajukan order untuk membeli rToken yang didukung menggunakan stablecoin seperti USDT.
-
Aset dasar diakses melalui broker: Reality bekerja sama dengan infrastruktur broker berlisensi untuk mengakses sekuritas terkait yang terdaftar di bursa utama AS, seperti Nasdaq atau NYSE.
-
rToken diterbitkan secara on-chain: Setelah eksposur dasar dibuat melalui infrastruktur pasar yang relevan, rToken yang sesuai dicetak atau dikirimkan kepada pengguna melalui venue atau wallet yang didukung.
-
Token dapat disimpan, diperdagangkan, atau ditebus: Pengguna dapat menyimpan rToken untuk mendapatkan eksposur, memperdagangkannya di platform yang didukung, atau menebusnya sesuai aturan penerbit dan venue.
Fitur utama model Reality adalah dukungannya untuk penyelesaian real-time dan penyelesaian asinkron. Dalam penyelesaian real-time, token dicetak atau dibakar pada saat transaksi, yang cocok untuk lingkungan di mana pengguna mengharapkan pengiriman on-chain secara langsung. Dalam penyelesaian asinkron, transaksi dapat dinetting pada akhir hari trading, sehingga hanya posisi agregat yang diselesaikan secara on-chain. Model ini dapat mengurangi kompleksitas operasional dan meningkatkan efisiensi modal bagi platform yang menangani arus trading besar.
Dalam kedua mode penyelesaian, tujuan yang dinyatakan tetap sama: menjaga suplai rToken tetap selaras dengan sekuritas dasar yang mendukungnya. Keselarasan ini penting karena ekuitas tokenisasi bergantung pada kepercayaan pengguna bahwa token tersebut bukan sekadar referensi harga, melainkan klaim atas eksposur ekonomi yang didukung oleh aktivitas pasar nyata dan kontrol cadangan.
rToken berada di antara dua sistem. Di satu sisi, ia terhubung ke pasar sekuritas tradisional melalui broker, kustodian, dan verifikasi cadangan. Di sisi lain, ia berperilaku seperti aset blockchain yang dapat berpindah di wallet, exchange, dan lingkungan DeFi yang didukung. Kekuatan model ini bergantung pada seberapa baik kedua sistem tersebut tetap tersinkronisasi.
Sisi Wall Street: Broker, Kustodi, dan Likuiditas Pasar Nyata
Agar ekuitas tokenisasi dapat berfungsi, token on-chain harus terhubung ke infrastruktur pasar keuangan nyata. Di sinilah sisi Wall Street dari model Reality menjadi penting. rTokens tidak dirancang untuk hanya ada sebagai referensi harga berbasis blockchain. Token ini disusun berdasarkan akses ke sekuritas dasar melalui infrastruktur broker berlisensi, pengaturan kustodi, dan likuiditas pasar dari bursa utama AS.
Reality bekerja sama dengan broker berlisensi untuk mengakses sekuritas yang terdaftar di venue seperti Nasdaq dan NYSE. Ini penting karena likuiditas pada saham tokenisasi sangat bergantung pada apakah token dapat tetap selaras dengan pasar aset dasarnya. Jika ekuitas tokenisasi hanya mengandalkan buku order kripto yang tipis atau pool likuiditas on-chain yang kecil, bahkan aktivitas trading yang moderat pun dapat menciptakan kesenjangan harga antara token dan saham nyata. Dengan terhubung ke rel pasar tradisional, Reality bertujuan untuk mengurangi kesenjangan tersebut dan menyediakan eksposur ekonomi yang lebih konsisten.
Kustodi adalah bagian sentral lain dari model ini. Sekuritas dasar yang mendukung rTokens disimpan melalui saluran broker dan kustodi yang teregulasi, bukan oleh pemegang token secara langsung. Struktur ini memungkinkan Reality mempertahankan hubungan antara suplai token dan sekuritas nyata yang disimpan sebagai cadangan. Struktur ini juga memperkenalkan perbedaan yang jelas: investor memegang rToken, sementara saham dasar tetap berada dalam kerangka kustodi yang digunakan oleh penerbit dan mitranya.
Verifikasi cadangan membantu membuat struktur ini lebih transparan. Materi Reality menjelaskan pelaporan Proof of Asset dan atestasi cadangan independen sebagai bagian dari kerangka integritas asetnya. Mekanisme ini dimaksudkan untuk menunjukkan apakah jumlah rTokens yang beredar didukung oleh sekuritas terkait yang disimpan sebagai cadangan. Bagi calon investor, jenis transparansi ini penting karena saham tokenisasi tidak hanya membutuhkan kepercayaan pada smart contract, tetapi juga pada sistem cadangan dan kustodi off-chain di belakangnya.
Likuiditas pasar nyata adalah salah satu alasan utama mengapa ekuitas tokenisasi semakin mendapat perhatian. Selama jam pasar tradisional AS, likuiditas untuk saham dasar seperti Apple, Tesla, NVIDIA, atau Microsoft jauh lebih dalam daripada sebagian besar pasar native kripto untuk token terkait saham. Jika produk tokenisasi dapat mengakses likuiditas tersebut melalui infrastruktur broker, produk itu dapat menawarkan harga yang lebih ketat, eksekusi yang lebih baik, dan slippage yang lebih rendah dibanding model yang hanya bergantung pada likuiditas kripto terisolasi. Di luar jam pasar normal, likuiditas dapat bervariasi menurut venue, permintaan pengguna, dan market making di tingkat platform.
Poin utamanya adalah bahwa model Reality menggabungkan dua lapisan infrastruktur. Yang pertama adalah lapisan tradisional: broker, kustodian, sekuritas yang terdaftar di bursa, dan kontrol cadangan. Yang kedua adalah lapisan blockchain: rTokens, wallet, smart contract, dan kompatibilitas DeFi. Kualitas produk bergantung pada seberapa andal lapisan-lapisan ini berinteraksi, terutama selama periode volume trading tinggi, volatilitas pasar, aksi korporasi, dan aktivitas penebusan.
Sisi DeFi: Mengapa rTokens Lebih dari Sekadar IOU Broker
Sisi DeFi dari rTokens adalah hal yang membedakannya dari banyak produk tradisional terkait broker. Posisi saham konvensional biasanya tetap berada di dalam akun broker. Posisi itu dapat dibeli, dijual, atau digunakan dalam produk margin terbatas, tetapi tidak secara alami berpindah di berbagai wallet, smart contract, pool likuiditas, atau aplikasi terdesentralisasi. rTokens dirancang untuk membuat eksposur terkait saham lebih portabel dalam lingkungan blockchain yang kompatibel.
Karena rTokens adalah aset on-chain, token ini berpotensi mendukung use case yang melampaui trading spot dasar. Bergantung pada dukungan platform, aturan kelayakan, dan kontrol risiko, rTokens dapat digunakan dengan beberapa cara:
-
Disimpan di wallet self-custody yang kompatibel
-
Ditransfer di berbagai lingkungan on-chain yang didukung
-
Digunakan sebagai jaminan dalam sistem pinjaman atau margin yang memenuhi syarat
-
Dipasangkan dengan stablecoin atau aset lain di pasar likuiditas
-
Diintegrasikan ke produk terstruktur, strategi trading, atau alat imbal hasil
-
Dikombinasikan dengan aset kripto dalam strategi portofolio multiaset
Komposabilitas ini adalah salah satu alasan utama mengapa Tokenisasi aset dunia nyata penting bagi DeFi. Ketika aset tradisional menjadi token on-chain, aset itu dapat berinteraksi dengan aset digital dan aplikasi keuangan lainnya. Secara teori, pengguna dapat memegang eksposur tokenisasi terhadap suatu saham, menggunakannya sebagai jaminan, meminjam stablecoin dengan jaminan tersebut, atau memasukkannya ke strategi DeFi yang lebih luas. Ini berbeda dari IOU broker yang tetap terkunci di satu platform tertutup.
Namun, komposabilitas juga menghadirkan risiko baru. Setelah token terkait saham masuk ke DeFi, token itu dapat berinteraksi dengan smart contract, pool likuiditas, Oracle harga, dan sistem likuidasi otomatis. Setiap lapisan menambah risiko operasional dan teknis. Token yang melacak saham dunia nyata tetap dapat menghadapi masalah native kripto seperti keterlambatan oracle, bug smart contract, fragmentasi likuiditas, atau tekanan likuidasi saat pasar bergejolak.
Karena itu, rTokens harus dipahami sebagai jembatan antara dua sistem, bukan peningkatan bebas risiko atas ekuitas tradisional. Token ini mungkin menawarkan utilitas yang lebih luas daripada posisi broker standar, tetapi nilainya bergantung pada integritas aset off-chain dan kualitas eksekusi on-chain. Investor perlu menilai bukan hanya eksposur saham itu sendiri, tetapi juga platform, protokol, wallet, dan struktur pasar yang mendukung token tersebut.
Signifikansi jangka panjang rTokens terletak pada utilitas yang diperluas ini. Jika ekuitas tokenisasi dapat tetap didukung dengan baik, likuid, transparan, dan patuh regulasi, token ini dapat menjadi building block baru bagi pasar DeFi. Alih-alih DeFi sebagian besar hanya mengandalkan aset native kripto dan stablecoin, DeFi dapat memperoleh akses ke versi tokenisasi dari saham, ETF, obligasi, dan aset dunia nyata lainnya. Hal itu akan menjadikan rTokens bagian dari pergerakan yang lebih luas menuju pasar keuangan di mana aset tradisional dan infrastruktur blockchain beroperasi semakin dekat satu sama lain.
Bitget Stocks 2.0: Lapisan Distribusi
Bitget Stocks 2.0 merepresentasikan lapisan distribusi dan trading untuk rTokens dalam ekosistem Bitget. Platform ini dirancang untuk membuat ekuitas tokenisasi dapat diakses oleh berbagai jenis pengguna sekaligus menghubungkan model rToken on-chain dengan lingkungan trading yang fungsional.
Fitur utama Stocks 2.0 meliputi:
-
Daftar Aset yang Diperluas: Stocks 2.0 menambahkan lebih dari 500 aset terkait saham, yang mencakup ekuitas utama dan ETF AS, termasuk Apple, Tesla, NVIDIA, Microsoft, Amazon, Alphabet, dan Meta.
-
Integrasi Likuiditas: Order untuk rTokens memanfaatkan likuiditas dari pasar saham dasar AS melalui broker berlisensi, meningkatkan eksekusi dan mengurangi slippage dibandingkan buku order kripto yang terisolasi.
-
Sistem Akun Terpadu: Pengguna dapat mengelola ekuitas tokenisasi bersamaan dengan aset kripto dalam satu akun, memungkinkan konsolidasi portofolio dan alokasi modal yang lebih mudah.
-
Margin dan Alat Trading: rTokens yang memenuhi syarat dapat digunakan dalam akun margin, strategi grid, sistem Copy trading, dan produk imbal hasil tertentu.
-
Trading Berbasis Stablecoin: Transaksi dilakukan dengan USDT, sementara dividen tunai dari sekuritas dasar juga dikreditkan dalam stablecoin.
-
Biaya Rendah: Bitget telah meluncurkan diskon biaya trading 50% untuk waktu terbatas bagi trading spot saham, dengan biaya maker dan taker masing-masing ditetapkan sebesar 0,05% hingga 31 Agustus 2026. Struktur biaya ini membantu memosisikan Stocks 2.0 sebagai venue yang kompetitif untuk trading ekuitas tokenisasi.
Dengan menghubungkan rTokens ke lingkungan exchange yang sepenuhnya fungsional, Bitget Stocks 2.0 bertindak sebagai antarmuka operasional tempat pengguna dapat mengakses, memperdagangkan, dan mengelola ekuitas tokenisasi secara efisien. Desain platform ini menekankan integrasi yang mulus dengan akun dan alat kripto yang sudah ada, sambil memastikan bahwa eksposur tokenisasi tetap didukung oleh sekuritas dunia nyata.
Dividen, Split, dan Aksi Korporasi
Salah satu pertanyaan terpenting untuk saham tokenisasi adalah bagaimana aset ini menangani peristiwa yang memengaruhi sekuritas dasarnya. Di pasar ekuitas tradisional, investor dapat menerima dividen tunai, dividen saham, saham yang disesuaikan karena split, atau perubahan lain setelah merger, reverse split, atau pembaruan ticker. Untuk ekuitas tokenisasi, peristiwa-peristiwa ini harus tercermin secara akurat agar eksposur ekonomi pemegang token tetap selaras dengan aset dasar.
Model rToken Reality dirancang untuk menjaga harga token tetap bersih dan mudah dipahami. Dividen tunai dari sekuritas dasar ditangani secara terpisah dari harga token dan didistribusikan dalam stablecoin, seperti USDT, melalui antarmuka platform yang relevan. Artinya, token itu sendiri tidak perlu melakukan rebase atau menyesuaikan harganya untuk memasukkan dividen yang diinvestasikan kembali. Sebagai contoh, satu rAAPL dimaksudkan untuk terus melacak nilai ekonomi dari satu saham AAPL, sementara dividen tunai yang memenuhi syarat diperlakukan sebagai distribusi stablecoin yang terpisah.
Aksi korporasi seperti stock split dan reverse split dipetakan ke saldo token. Jika suatu saham dasar melakukan split, saldo rToken yang sesuai dapat disesuaikan untuk mencerminkan struktur saham yang baru sambil menjaga total eksposur ekonomi pengguna tetap selaras. Prinsip yang sama berlaku untuk reverse split, di mana jumlah token dapat berkurang sementara nilai per token menyesuaikan secara proporsional.
Pendekatan ini penting karena aksi korporasi dapat menimbulkan kebingungan di pasar tokenisasi. Jika dividen dimasukkan ke dalam harga token atau ditangani melalui mekanisme rebasing, pengguna mungkin akan lebih sulit membandingkan token dengan saham dasarnya. Model Reality memisahkan eksposur harga dari distribusi pendapatan, yang membantu membuat hubungan antara rToken dan aset dasar lebih mudah dipahami.
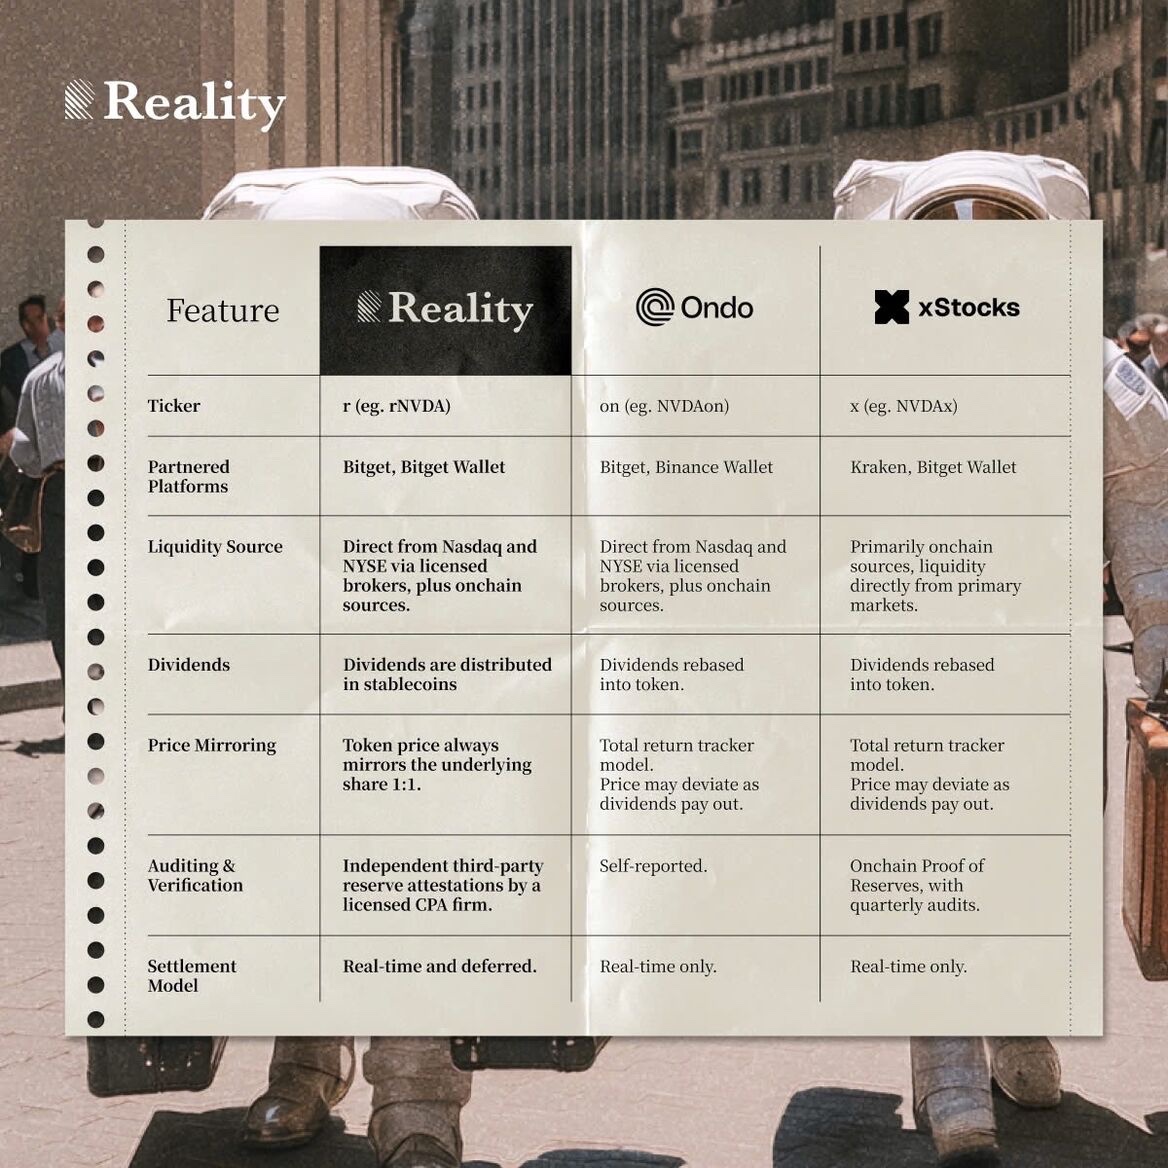
Reality vs. Model Saham Tokenisasi Lainnya
Saham tokenisasi tidak semuanya disusun dengan cara yang sama. Beberapa produk didukung oleh saham atau ETF dasar, sementara yang lain berfungsi lebih seperti instrumen sintetis, kontrak, atau klaim khusus platform. Bagi investor, perbedaan ini penting karena setiap model membawa implikasi yang berbeda untuk dukungan aset, likuiditas, transferabilitas, dividen, penebusan, dan hak hukum.
| Titik Perbandingan |
Reality rTokens |
Ekuitas Tokenisasi yang Didukung Penuh |
Token Saham Sintetis |
Token Saham Berbasis Platform |
Wrapper Saham Native DeFi |
| Struktur inti |
Token on-chain yang dirancang untuk merepresentasikan eksposur ekonomi terhadap saham dan ETF AS nyata |
Token yang didukung oleh saham dasar atau unit ETF yang disimpan sebagai cadangan |
Token yang melacak harga saham melalui Derivatif, kontrak, atau mekanisme berbasis Oracle |
Produk terkait saham yang tersedia terutama di dalam satu exchange, broker, atau aplikasi |
Wrapper on-chain yang dirancang terutama untuk use case DeFi |
| Dukungan aset |
Ditujukan untuk mempertahankan eksposur ekonomi 1:1 dengan sekuritas dasar yang disimpan melalui infrastruktur teregulasi |
Biasanya didukung oleh aset dasar yang sesuai |
Mungkin tidak memegang saham dasar secara langsung |
Bergantung pada struktur hukum dan kustodi platform |
Bervariasi menurut protokol; bisa didukung aset, sintetis, atau overcollateralized |
| Sumber likuiditas |
Bertujuan terhubung dengan likuiditas pasar ekuitas nyata melalui broker berlisensi, dengan Bitget sebagai venue trading |
Sering terhubung dengan market maker, broker, atau likuiditas yang dikelola penerbit |
Biasanya bergantung pada likuiditas derivatif, harga oracle, atau likuiditas platform |
Sebagian besar bergantung pada buku order internal platform atau market maker |
Sering bergantung pada AMM, pool likuiditas, dan kedalaman pasar DeFi |
| Transferabilitas |
Dirancang sebagai aset on-chain yang dapat berpindah di berbagai wallet, venue, dan lingkungan DeFi yang kompatibel serta didukung |
Bervariasi; beberapa dapat ditransfer, sementara yang lain tetap dibatasi |
Sering dibatasi oleh platform, yurisdiksi, atau desain produk |
Biasanya terbatas pada platform penerbit |
Biasanya sangat mudah ditransfer jika diterapkan sebagai standar token |
| Perlakuan dividen |
Dividen tunai ditangani secara terpisah dalam stablecoin jika berlaku; split dan aksi korporasi dipetakan ke saldo token |
Dapat meneruskan dividen, menginvestasikannya kembali, atau menanganinya secara terpisah bergantung pada aturan penerbit |
Mungkin tidak menyediakan perlakuan dividen tradisional |
Bergantung pada syarat produk platform |
Sangat bervariasi; beberapa mungkin tidak mendukung aksi korporasi dengan jelas |
| Kompatibilitas DeFi |
Dirancang untuk potensi penggunaan di berbagai lingkungan on-chain dan DeFi yang kompatibel |
Bergantung pada standar token dan pembatasan transfer |
Biasanya terbatas kecuali produk diterbitkan secara on-chain dan dapat ditransfer |
Sering terbatas karena aset tetap berada di dalam satu platform |
Biasanya kuat, tetapi dapat membawa risiko smart contract dan likuiditas yang lebih tinggi |
| Hak hukum |
Menyediakan eksposur ekonomi, bukan kepemilikan pemegang saham secara langsung |
Sering menyediakan eksposur ekonomi alih-alih hak pemegang saham secara langsung |
Umumnya hanya menyediakan eksposur harga |
Bergantung pada penerbit dan yurisdiksi |
Bergantung pada desain protokol dan struktur hukum |
| Keunggulan utama |
Menggabungkan akses aset yang terhubung dengan broker, verifikasi cadangan, penyelesaian berbasis stablecoin, dan kegunaan DeFi |
Model dukungan yang jelas saat cadangan transparan |
Fleksibel dan lebih mudah didaftarkan, dengan kebutuhan kustodi operasional yang lebih sedikit |
Pengalaman pengguna sederhana di dalam satu platform yang familier |
Komposabilitas tinggi dan utilitas on-chain yang luas |
| Risiko utama |
Membutuhkan kepercayaan pada penerbit, broker, kustodi, verifikasi cadangan, dan aturan venue |
Risiko kustodi, penebusan, dan regulasi tetap ada |
Risiko pelacakan, Risiko Pihak Lawan, dan hukum yang lebih tinggi |
Portabilitas terbatas dan ketergantungan pada satu platform |
Risiko smart contract, oracle, likuiditas, dan regulasi |
Diferensiasi Reality berasal dari penggabungan beberapa elemen dalam satu model: akses broker ke bursa utama AS, penerbitan yang didukung cadangan, pelaporan Proof of Asset, penyelesaian berbasis stablecoin, dan kompatibilitas DeFi. Kombinasi ini penting karena ekuitas tokenisasi membutuhkan kredibilitas off-chain sekaligus kegunaan on-chain. Token dengan utilitas DeFi yang kuat tetapi dukungan yang lemah mungkin akan kesulitan mendapatkan kepercayaan investor. Token dengan dukungan yang kuat tetapi transferabilitas terbatas mungkin akan terlihat terlalu mirip dengan produk broker tradisional.
Bagi investor, cara terbaik untuk membandingkan model saham tokenisasi adalah dengan mengajukan pertanyaan praktis: Apa yang mendukung token ini? Siapa yang memegang aset dasar? Apakah cadangan dapat diverifikasi? Apakah token dapat berpindah ke luar satu platform? Bagaimana dividen ditangani? Apa yang terjadi saat pasar tertekan? Hak apa yang sebenarnya dimiliki pemegang token? Model Reality berupaya menjawab pertanyaan-pertanyaan ini melalui struktur yang menghubungkan rel pasar teregulasi dengan utilitas token on-chain, tetapi investor tetap harus mengevaluasi detailnya sebelum berpartisipasi.
Realitas Hukum: Eksposur Tidak Sama dengan Kepemilikan
Salah satu poin terpenting yang perlu dipahami investor adalah bahwa eksposur saham tokenisasi tidak sama dengan kepemilikan saham langsung. rToken dapat melacak nilai ekonomi sekuritas dasar, tetapi memegang token tersebut tidak menjadikan pengguna sebagai pemegang saham perusahaan di balik saham itu.
Dengan rTokens, sekuritas dasar disimpan melalui infrastruktur broker dan kustodi yang teregulasi, sementara pemegang token menerima eksposur ekonomi melalui aset on-chain yang diterbitkan. Struktur ini berarti memegang rToken tidak selalu memberikan:
-
Hak legal atas saham dasar
-
Hak suara dalam rapat pemegang saham
-
Hak informasi pemegang saham
-
Tempat dalam daftar pemegang saham perusahaan
-
Partisipasi langsung dalam tata kelola korporasi
Sebaliknya, rTokens dirancang untuk memberikan eksposur ekonomi. Ini dapat mencakup eksposur harga, perlakuan dividen berbasis stablecoin jika berlaku, dan penyesuaian untuk aksi korporasi seperti stock split atau reverse split. Pemegang token dapat memperoleh manfaat dari kinerja ekonomi aset dasar, tetapi tidak dari seluruh rangkaian hak yang biasanya menyertai kepemilikan saham langsung.
Model ini umum ditemukan di banyak produk ekuitas tokenisasi, tetapi juga menghadirkan pertimbangan hukum, regulasi, dan pihak lawan. Investor bergantung pada penerbit, broker, kustodian, proses verifikasi cadangan, smart contract, dan aturan venue trading. Mereka juga perlu mempertimbangkan apakah produk ini tersedia di yurisdiksi mereka dan apakah mereka memenuhi persyaratan kelayakan.
Untuk Reality dan rTokens, kesimpulan hukum utamanya sederhana: produk ini dirancang untuk menciptakan jembatan menuju eksposur pasar ekuitas, bukan untuk menggantikan struktur hukum kepemilikan saham secara langsung. Jembatan tersebut dapat menawarkan bentuk akses dan utilitas baru, tetapi pengguna tetap perlu memahami dengan tepat apa yang mereka pegang dan hak apa yang tidak mereka miliki.
Mengapa Ekuitas Tokenisasi Menjadi Mega-Tren 2026
Ekuitas tokenisasi mendapat perhatian besar pada 2026 karena kombinasi pertumbuhan pasar, adopsi teknologi, dan evolusi regulasi. Exchange kripto, platform broker, dan penyedia tokenisasi sedang memperluas penawaran untuk saham AS dan global, sehingga investor dapat mengakses aset dunia nyata melalui jaringan blockchain.
Faktor utama yang mendorong tren ini meliputi:
-
Ukuran pasar dan likuiditas: Ekuitas publik dan ETF tetap menjadi salah satu kelas aset terbesar dan paling likuid di dunia. Men-tokenisasi aset-aset ini memberikan akses yang lebih luas tanpa mengganggu struktur pasar tradisional.
-
Penyelesaian yang dapat diprogram: Jaringan blockchain memungkinkan proses penyelesaian yang lebih cepat, otomatis, dan dapat diaudit, sehingga mengurangi hambatan dibandingkan sistem kliring tradisional.
-
Kepemilikan Fraksional: Investor dapat memegang saham tokenisasi dalam fraksi, sehingga menurunkan hambatan masuk untuk saham dan ETF berharga tinggi.
-
Aksesibilitas global: Ekuitas tokenisasi memungkinkan investor di seluruh dunia berpartisipasi di pasar AS ketika regulasi dan pembatasan broker membatasi akses.
-
Komposabilitas DeFi: Aset on-chain dapat berinteraksi dengan protokol pinjaman, likuiditas, dan keuangan terstruktur, sehingga menciptakan cara baru untuk menggunakan eksposur ekuitas.
Platform yang mendukung ekuitas tokenisasi terus berinovasi dalam sumber likuiditas, penanganan aksi korporasi, dan transparansi kustodi, yang memperkuat kredibilitas pasar ini. Secara bersama-sama, tren-tren ini menunjukkan bahwa ekuitas tokenisasi sedang bergerak dari eksperimen ceruk menuju segmen yang semakin utama dalam ekosistem keuangan digital. Platform seperti Reality dan rTokens menggambarkan bagaimana aset tokenisasi yang teregulasi dan didukung penuh dapat menggabungkan integritas pasar tradisional dengan fleksibilitas native blockchain, sehingga menempatkannya di garis depan lanskap yang terus berkembang ini.
Apa Arti Reality bagi Wall Street dan DeFi
Reality merepresentasikan lebih dari sekadar produk saham tokenisasi baru. Ini mencerminkan upaya yang lebih luas untuk menghubungkan dua sistem keuangan yang secara historis beroperasi terpisah: pasar sekuritas tradisional dan keuangan berbasis blockchain. Jika model ini terus berkembang, model ini dapat memengaruhi cara investor mengakses ekuitas, cara platform mengelola penyelesaian, dan cara protokol DeFi mengintegrasikan aset dunia nyata.
Bagi Wall Street, ekuitas tokenisasi dapat menciptakan saluran distribusi baru untuk aset tradisional. Saham dan ETF yang sebelumnya membutuhkan akun broker, akses pasar lokal, dan proses penyelesaian konvensional dapat tersedia melalui platform aset digital, dengan tunduk pada regulasi dan aturan kelayakan. Ini tidak menghilangkan kebutuhan akan broker, kustodian, atau sistem kepatuhan. Sebaliknya, hal ini dapat memperluas peran mereka ke pasar berbasis blockchain, tempat stablecoin, wallet, dan smart contract menjadi bagian dari pengalaman pengguna.
Bagi DeFi, rTokens dapat menambahkan kategori baru untuk jaminan dan aset portofolio. Alih-alih terutama bergantung pada token native kripto dan stablecoin, aplikasi DeFi dapat mengintegrasikan versi tokenisasi dari saham, ETF, obligasi, dan aset dunia nyata lainnya. Ini dapat mendukung pasar pinjaman yang lebih terdiversifikasi, produk terstruktur, dan strategi multiaset. Namun, protokol DeFi juga memerlukan penetapan harga yang andal, kontrol likuiditas, kejelasan hukum, dan Manajemen risiko sebelum aset-aset ini dapat berkembang dengan aman.
Dampak yang lebih luas bergantung pada eksekusi. Jika Reality dapat mempertahankan dukungan aset yang kuat, cadangan yang transparan, likuiditas yang andal, dan perlindungan investor yang jelas, rTokens dapat membantu membuat ekuitas tokenisasi menjadi lebih praktis bagi pengguna umum. Jika perlindungan ini lemah, saham tokenisasi dapat menghadapi kekhawatiran yang sama seperti eksperimen sebelumnya: kesenjangan harga, hak yang tidak jelas, likuiditas tipis, dan Risiko Pihak Lawan.
Dalam arti tersebut, Reality paling tepat dipahami sebagai bagian dari transisi, bukan tujuan akhir. Ini menunjukkan bagaimana infrastruktur Wall Street dan arsitektur DeFi mungkin mulai saling tumpang tindih, tetapi juga menyoroti pekerjaan yang masih diperlukan untuk membuat ekuitas tokenisasi menjadi tepercaya, likuid, dan berguna dalam skala besar.
Garis Pemisah yang Jelas Antara rTokens dan BGB
Dalam ekosistem Bitget, rTokens dan Bitget Token (BGB) memiliki tujuan yang berbeda. Memahami perbedaan ini membantu memperjelas apa yang sebenarnya sedang dibangun oleh Reality.
rTokens adalah token terkait aset yang diterbitkan oleh Reality. Token ini dirancang untuk merepresentasikan eksposur ekonomi terhadap sekuritas dunia nyata, termasuk saham dan ETF AS tertentu. Strukturnya bergantung pada hubungan antara token on-chain dan infrastruktur pasar off-chain, termasuk broker, kustodi, cadangan, verifikasi, dan penyelesaian.
BGB bekerja secara berbeda. Ini adalah token utilitas native Bitget dan tidak terkait dengan nilai saham atau ETF AS mana pun. Token ini digunakan untuk manfaat platform, reward pengguna, kampanye, dan fungsi ekosistem lainnya di dalam Bitget.
Karena itu, rTokens harus dilihat melalui lensa tokenisasi aset dunia nyata, sedangkan BGB harus dilihat melalui lensa utilitas platform. Pembedaan ini menjaga fokus tetap jelas: Reality sedang membangun lapisan penerbitan aset untuk pasar tokenisasi, sementara BGB mendukung partisipasi dalam ekosistem Bitget yang lebih luas.
Pelajari lebih lanjut: Bitget Stock Token (rToken) vs. Bitget Token (BGB): Aset Berbeda, Peran Berbeda, Satu Ekosistem Bitget
Kesimpulan
Reality Protocol dan rTokens menunjukkan bagaimana ekuitas tokenisasi dapat menciptakan koneksi praktis antara pasar keuangan tradisional dan infrastruktur blockchain. Dengan menggabungkan akses broker berlisensi, sistem kustodi, verifikasi cadangan, penyelesaian stablecoin, dan desain token on-chain, model ini menawarkan cara baru bagi investor yang memenuhi syarat untuk mengakses eksposur ekonomi terhadap saham dan ETF AS. Model ini tidak menghilangkan pentingnya perlindungan pasar tradisional, tetapi menunjukkan bagaimana perlindungan tersebut dapat bekerja berdampingan dengan alat native kripto untuk membuat aset dunia nyata lebih mudah diakses dan lebih fleksibel.
Pada saat yang sama, rTokens paling tepat dipahami sebagai jembatan, bukan pengganti penuh untuk kepemilikan saham langsung. Pemegang token perlu memahami perbedaan antara eksposur ekonomi dan hak pemegang saham, tetapi arah yang lebih luas sudah jelas: ekuitas tokenisasi sedang menjadi bagian serius dari pasar RWA. Jika platform seperti Reality terus meningkatkan transparansi, likuiditas, kepatuhan, dan kompatibilitas DeFi, rTokens dapat membantu membentuk sistem keuangan yang lebih terhubung, di mana aset Wall Street dan pasar on-chain bekerja semakin erat bersama.
Penafian: Pendapat yang diungkapkan dalam artikel ini hanya untuk tujuan informasi. Artikel ini tidak merupakan dukungan terhadap produk dan layanan apa pun yang dibahas atau nasihat investasi, keuangan, maupun trading. Profesional yang berkualifikasi harus dikonsultasikan sebelum membuat keputusan keuangan.
Sebagai exchange kripto terkemuka, Bitget menawarkan beragam produk derivatif, termasuk futures perpetual kripto klasik (seperti BTCUSDT dan ETHUSDT) serta futures saham yang inovatif—futures perpetual USDT-margin yang melacak indeks saham AS yang ditokenisasi (seperti TSLA, NVDA, AAPL).
Kedua jenis produk ini mendukung leverage, mode hedging (long/short), dan penyelesaian USDT. Keduanya juga merupakan futures perpetual tanpa kedaluwarsa, menggunakan mekanisme tingkat pendanaan untuk menjaga harga tetap terikat pada harga spot aset pendasar. Namun, keduanya berbeda secara signifikan dalam hal karakteristik aset dasar, volatilitas, profil risiko, dan pengalaman perdagangan secara keseluruhan. Futures saham memungkinkan kamu untuk meningkatkan imbal hasil dengan leverage sambil didukung oleh fundamental yang relatif stabil dan pengawasan regulasi pasar saham AS. Dibandingkan dengan futures kripto murni, mereka jauh lebih tahan terhadap fluktuasi harga ekstrem (seperti penurunan mendadak), sehingga risiko secara keseluruhan lebih terkelola. Hal ini menjadikannya pilihan ideal bagi trader yang ingin menggabungkan stabilitas keuangan tradisional dengan fleksibilitas kripto.
Keunggulan inti perps saham Bitget dibandingkan futures kripto
Futures saham menggabungkan aset keuangan tradisional dengan derivatif kripto, menawarkan keunggulan yang jelas di berbagai dimensi. Produk ini sangat cocok untuk pengguna dengan toleransi risiko moderat atau investor yang ingin diversifikasi portofolio mereka dari volatilitas tinggi kripto.
| Dimensi |
Futures saham Bitget (saham AS, futures perpetual) |
Futures kripto Bitget (kripto seperti BTC/ETH, futures perpetual) |
Mengapa futures saham lebih unggul |
| Volatilitas aset dasar |
Rendah hingga menengah (pergerakan harian 1–5%, kadang lebih tinggi untuk nama seperti NVDA) |
Sangat tinggi (pergerakan harian BTC 5–15%; bisa melampaui 20% dalam kondisi ekstrem) |
Saham AS lebih jarang mengalami flash crash dan lebih didorong oleh fundamental, sehingga mengurangi risiko likuidasi black swan. |
| Flash crash/pergerakan ekstrem |
Risiko lebih rendah (harga lebih stabil karena pasar teregulasi dan agregasi indeks dari banyak sumber) |
Risiko lebih tinggi (pasar yang terdesentralisasi rentan terhadap order besar dan manipulasi) |
Perps saham menggunakan indeks komposit dari berbagai sumber yang ditokenisasi untuk penemuan harga yang lebih adil, sehingga flash crash jauh lebih kecil kemungkinannya dibanding kripto. |
| Leverage |
Hingga 100x pada saham populer, 10–25x pada indeks |
Hingga 125x (untuk kripto utama seperti BTC) |
Leverage moderat memperbesar pengembalian sambil mengendalikan risiko berlebihan, sehingga lebih cocok untuk menambah posisi secara bertahap. |
| Tingkat pendanaan / biaya menahan posisi |
Biasanya lebih rendah (tergantung rasio long/short), stabil pada periode tertentu |
Sangat fluktuatif (pemegang posisi long sering membayar biaya tinggi saat pasar bullish) |
Biaya menahan posisi jangka panjang lebih dapat diprediksi, mengurangi risiko tergerusnya profit akibat Biaya Pendanaan. |
| Biaya Transaksi |
Sangat rendah (biaya maker bisa 0%, biaya taker serendah 0,0065%, dengan banyak promo waktu terbatas) |
Standar di 0,02% untuk order maker dan 0,06% untuk order taker |
Biaya transaksi yang jauh lebih rendah berarti Anda bisa membuka posisi lebih besar atau trading lebih sering dengan modal yang sama. |
| Level risiko keseluruhan |
Relatif lebih rendah (didukung fundamental saham dan volatilitas yang lebih rendah) |
Lebih tinggi (didorong spekulasi murni dan volatilitas tinggi) |
Meski leverage memperbesar pengembalian, probabilitas likuidasi lebih rendah, sehingga cocok untuk strategi jangka menengah hingga panjang. |
| Diversifikasi dan hedging |
Mudah dikombinasikan dengan portofolio kripto untuk mengurangi risiko aset tunggal |
Sangat berkorelasi (sebagian besar kripto bergerak sejalan dengan BTC) |
Memberikan eksposur langsung ke keuangan tradisional, memungkinkan diversifikasi aset yang sebenarnya. |
| Pengguna target |
Pengguna kripto dengan toleransi risiko sedang yang menginginkan eksposur saham AS tetapi tidak menyukai volatilitas tinggi |
Pemain kripto murni dengan toleransi risiko tinggi yang mengejar pengembalian maksimum |
Jembatan yang lebih mudah diakses dan stabil ke pasar tradisional, menurunkan peluang trader baru kehilangan seluruh investasi mereka. |
Singkatnya, futures saham Bitget mempertahankan fleksibilitas perdagangan kripto (leverage, penyelesaian USDT, mode hedging) sambil secara signifikan mengurangi volatilitas dan risiko ekstrem. Mereka bertindak sebagai jembatan ideal bagi pengguna kripto yang ingin naik kelas ke keuangan tradisional.
Trading perps saham vs. futures kripto: Skenario penggunaan
Mari kita asumsikan seorang pengguna memiliki 1000 USDT dan menggunakan leverage 10x di Bitget, dengan tujuan menahan posisi tersebut selama satu minggu. Contoh sederhana ini (tidak termasuk biaya/tingkat pendanaan untuk ilustrasi) menunjukkan perbedaan potensial dalam hasil dan risiko.
Skenario 1: Long pada saham teknologi (NVDA)
-
Futures saham: Asumsikan NVDA naik 8% dalam satu minggu (pergerakan khas pasca-laporan penghasilan). Dengan leverage 10x, profit kira-kira 80%. 1000 USDT menjadi 1800 USDT. Volatilitas ringan dengan nyaris tanpa penurunan mendadak, memberi ketenangan dan risiko likuidasi yang sangat rendah.
-
Futures kripto: Asumsikan BTC naik 8% dalam lingkungan bullish yang sama. Profit teoritisnya juga 80% dengan leverage 10x. Namun, BTC sering mengalami koreksi sebesar 10–15%. Posisi tersebut dapat dengan mudah dilikuidasi atau dilikuidasi sebagian di tengah jalan, yang berpotensi membuat kamu kehilangan modal awal meskipun arah akhir benar.
Skenario 2: Volatilitas pasar ekstrem (berita negatif)
-
Futures saham: Pasar turun 4% dalam sehari karena komentar The Fed. Dengan leverage 10x, kerugian 40%, menyisakan saldo 600 USDT. Saham AS jarang turun lebih dari 10% dalam satu hari dan cenderung pulih, dengan lebih sedikit likuidasi berantai.
-
Futures kripto: Dengan leverage 10x yang sama, flash crash 10% (umum di kripto) akan menghasilkan kerugian 100%, menghapus akun.
Contoh-contoh ini menunjukkan bahwa futures saham memungkinkan leverage untuk memperbesar imbal hasil tanpa memperbesar risiko kerugian total. Hal ini sangat berharga selama musim laporan penghasilan atau peristiwa makro, memungkinkan kamu untuk menangkap aset alpha di pasar saham AS sambil menghindari penurunan drastis yang umum terjadi di pasar kripto.
Siapa yang paling cocok menggunakan perps saham Bitget?
1. Investor bullish atau bearish terhadap saham AS tanpa akun tradisional: Kamu bisa trading pergerakan arah pada saham populer seperti Apple, Tesla, Nvidia, dan Coinbase secara langsung dengan USDT di dompet kripto kamu, tanpa perlu repot dengan akun broker tradisional, transfer lintas batas, dan batasan geografis.
2. Native kripto yang sudah familiar dengan futures kripto dan pasar 24/7: Antarmuka perdagangan, jenis order (limit, pasar, dan order bersyarat), penyesuaian leverage, manajemen posisi, dan mekanisme pendanaan sangat mirip dengan futures perpetual BTC/USDT atau ETH/USDT. Bagi trader kripto berpengalaman, kurva pembelajaran hampir tidak ada, dan jam perdagangan merupakan peningkatan besar dibandingkan jam pasar tradisional.
3. Trader agresif/spekulatif yang mencari leverage tinggi: Dengan leverage yang jauh melebihi margin 2–4x yang ditawarkan oleh broker saham tradisional, ini sangat cocok untuk menggunakan modal kecil untuk menangkap reli besar (seperti di Tesla atau Nvidia) atau untuk mengambil posisi short besar pada saham teknologi yang dinilai terlalu tinggi. Perlu diingat bahwa hal ini juga berarti risiko yang sangat tinggi dan hanya cocok untuk pengguna dengan toleransi risiko yang tinggi.
4. Trader hibrida yang aktif di pasar kripto dan saham: Dengan satu akun Bitget dan satu pool modal USDT, kamu bisa beralih dengan mulus antara futures kripto dan futures saham. Ini memaksimalkan efisiensi modal dan kecepatan operasional, terutama buat mereka yang sering melakukan penyeimbangan ulang atau mencari lindung nilai lintas pasar.
5. Trader profesional atau semi-profesional yang mencari akses tanpa hambatan, 24/7: Ini mencakup mereka yang ingin melindungi portofolio kripto, berspekulasi pada saham/indeks teknologi, atau menjalankan bot grid/kuantitatif. Platform ini mendukung grafik TradingView, API, dan alat profesional seperti order TP/SL.
Kesimpulan
Jika kamu adalah seorang veteran kripto yang bosan dengan volatilitas tinggi yang berlebihan tetapi tetap ingin ikut serta dalam pertumbuhan perusahaan global terkemuka (seperti Apple, Tesla, Nvidia), futures saham Bitget adalah pilihan yang sangat baik. Mereka menggabungkan yang terbaik dari kedua dunia—leverage, akses 24/7, dan hambatan rendah, sambil secara signifikan mengurangi emosi FOMO yang khas dalam kripto.
Perdagangan melibatkan risiko yang signifikan. Mulailah dengan jumlah kecil, gunakan leverage rendah, selalu pasang TP/SL, dan trading secara bertanggung jawab. Silakan mencobanya di Bitget!
OpenEden adalah platform berbasis blockchain yang berfokus pada tokenisasi aset dunia nyata, membawa aset nyata seperti Surat Utang Negara AS diintegrasikan ke dalam blockchain secara teratur, aman, dan mudah diakses. Didirikan oleh Jeremy Ng pada tahun 2022 dan didukung oleh YZi Labs dengan pendanaan sebesar $5 juta, OpenEden (EDEN) akan segera tersedia di Bitget!
Apa itu OpenEden (EDEN)?
OpenEden adalah platform tokenisasi aset dunia nyata yang mengubah produk keuangan tradisional seperti surat utang pemerintah dan obligasi menjadi token digital di blockchain. Produk unggulan platform ini meliputi TBILL (Surat Utang Negara AS yang ditokenisasi) dan USDO (stablecoin yang menghasilkan imbal hasil), yang memungkinkan pengguna untuk mengakses aset keuangan berkualitas institusional melalui teknologi blockchain.

Platform ini mengatasi hambatan akses, keterbatasan likuiditas, proses penyelesaian yang tidak efisien, dan gesekan regulasi yang dihadapi oleh aset tradisional saat bergerak di pasar global. OpenEden memungkinkan kepemilikan fraksional dan transfer yang lancar di blockchain sambil menyediakan platform yang diatur dan transparan yang memberikan kepercayaan kepada pengguna dalam pengelolaan aset.
Inovasi Inti: OpenEden menggunakan blockchain untuk mentokenisasi aset dunia nyata, artinya aset-aset ini diubah menjadi token digital yang mewakili kepemilikan atau hak. Hal ini memungkinkan pengguna untuk berinvestasi, trading, dan mengelola produk keuangan tradisional secara langsung di blockchain dengan transparansi dan efisiensi.
Siapa yang menciptakan OpenEden (EDEN)?
OpenEden didirikan pada tahun 2022 oleh Jeremy Ng, seorang eksekutif berpengalaman dengan latar belakang di bidang keuangan tradisional dan sektor kripto.

Jeremy Ng (Founder & CEO):
● Mantan Managing Director dan Head of APAC di Gemini
● Mantan CEO Leonteq Asia
● Mantan FICC Derivatives Head Goldman Sachs
● Posisi sebelumnya di Deutsche Bank dan Morgan Stanley
● Memiliki sertifikasi CFA
Anggota Tim Utama:
● Duke Du (CTO): Memimpin pengembangan teknis dengan pengalaman di organisasi fintech dan blockchain
● Wayne Tan (General Counsel): Bertanggung jawab atas kepatuhan hukum dan regulasi, sebelumnya bekerja di OKX dan Bybit
● Frederick Chng (Head of Product): Mengawasi strategi dan pengembangan produk
Tim ini memiliki puluhan tahun pengalaman dari Goldman Sachs, Morgan Stanley, Deutsche Bank, Gemini, OKX, Bybit, SEA, Accenture, dan BlockFi, menggabungkan keahlian keuangan institusional dengan kemampuan pengembangan blockchain.
Siapa saja investor modal ventura yang mendukung OpenEden (EDEN)?
OpenEden telah mengumpulkan dana sebesar $5 juta melalui beberapa putaran pendanaan dari investor kripto dan keuangan, disertai dengan kemitraan institusional tambahan.
Putaran Pendanaan:
● Mei 2023: $5 juta berhasil dikumpulkan
● September 2024: Putaran strategis (jumlah tidak diungkapkan)
Investor Modal Ventura Utama:
● YZi Labs (sebelumnya Binance Labs): Investor tahap awal terkemuka dan mitra strategis
● UXD Protocol: Investor dan mitra ekosistem
Kemitraan Institusi:
● Bank of New York Mellon (BNY): Ditunjuk sebagai manajer investasi utama dan kustodian utama untuk dana Surat Utang Negara AS yang ditokenisasi milik OpenEden, menyediakan layanan kustodian dan manajemen berkualitas institusional
Kombinasi dukungan modal ventura dari YZi Labs dan kemitraan institusional dengan BNY Mellon menunjukkan keyakinan yang kuat terhadap pendekatan yang diatur oleh OpenEden dalam tokenisasi aset dunia nyata.
Cara Kerja OpenEden (EDEN)
OpenEden memungkinkan pengguna untuk mengakses dan berinvestasi dalam produk keuangan dunia nyata melalui token berbasis blockchain sambil tetap mematuhi standar regulasi dan keamanan yang ketat.
Proses Tokenisasi Aset
OpenEden mengintegrasikan aset tradisional seperti Obligasi AS dan menyimpannya dengan aman di bank-bank tepercaya atau kustodian. Untuk setiap aset nyata yang dimiliki, OpenEden menerbitkan token digital di jaringan blockchain. Setiap token didukung secara 1:1 oleh aset dunia nyata dan secara rutin diaudit untuk membuktikan bahwa aset nyata disimpan dalam cadangan.
Infrastruktur Kontrak Pintar
Platform ini menggunakan kontrak pintar di blockchain untuk secara otomatis mengelola penciptaan, penebusan, dan perpindahan token, sehingga proses menjadi cepat, transparan, dan biaya rendah. Program-program ini berjalan di atas blockchain dengan aturan yang transparan dan eksekusi otomatis.
Dukungan Multi-Chain
OpenEden beroperasi di Ethereum dengan perluasan ke Arbitrum, Base, Solana, BNB Chain, dan XRP Ledger. Hal ini memberikan fleksibilitas dan biaya transaksi yang lebih rendah di berbagai jaringan, memungkinkan pengguna untuk memilih lingkungan blockchain yang mereka inginkan.
Proof-of-Reserves dan Keamanan
Mitra independen dan protokol secara rutin membuktikan bahwa setiap token sepenuhnya didukung oleh aset nyata melalui audit dan data blockchain. Aset nyata dilindungi oleh institusi-institusi yang diatur seperti BNY Mellon melalui layanan kustodian tingkat institusi, bukan penyimpanan perusahaan.
Interoperabilitas Cross-Chain
Integrasi dengan protokol CCIP Chainlink memungkinkan data proof-of-reserve cross-chain, penetapan harga on-chain untuk stablecoin, dan perpindahan token yang lancar di seluruh blockchain yang didukung.
Kamu bisa mengakses platform tersebut di openeden.com.
Token OpenEden (EDEN) dan Ekonomi
Token EDEN berfungsi sebagai aset digital native ekosistem OpenEden, memfasilitasi tata kelola, staking, dan partisipasi dalam ekosistem.
Detail Token
● Nama Token: OpenEden
● Simbol Token: EDEN
● Total Suplai: 1.000.000.000 token (1 miliar)
● Implementasi Blockchain: ERC-20 (Ethereum), dengan implementasi di Arbitrum, Solana, Base, BNB Chain, dan XRPL
● Alamat Kontrak Ethereum: 0x7c2a792acafcfc9dece3396e2119ccd036bab182
Distribusi Token
● Ekosistem: 30,22% - Pembukaan TGE 100%
● Tim & Penasihat: 20% - Pembukaan TGE 5%, cliff 6 bulan, vesting linear 24 bulan
● Investor: 15,28% - Pembukaan TGE 5%, cliff 6 bulan, vesting linear 24 bulan
● Perbendaharaan: 15% - Pembukaan TGE 50%, cliff 6 bulan untuk sisa 50%
● Mitra: 10% - Pembukaan TGE 81,25%, pembukaan bulanan 25% dengan denda klaim awal
● Kampanye Airdrop: 9,5% - Pembukaan TGE 25%, pembukaan bulanan 25% dengan denda klaim awal
Struktur Vesting: Token untuk tim, penasihat, dan investor mencakup jadwal vesting multi-tahun untuk menjamin keselarasan jangka panjang dengan protokol dan mencegah tekanan jual mendadak.
Utilitas Token
● Tata Kelola: Voting untuk peningkatan protokol, struktur biaya, dan keputusan ekosistem
● Staking: Staking token EDEN untuk membantu mengamankan jaringan dan menghasilkan hadiah platform
● Hadiah Ekosistem: Hasilkan insentif untuk penyediaan likuiditas, adopsi awal, dan partisipasi komunitas
● Diskon Biaya: Nikmati biaya platform yang lebih rendah dan fitur premium
● Komposabilitas DeFi: Digunakan sebagai agunan dalam pool likuiditas dan strategi penghasil imbal hasil pada protokol mitra
Mengapa OpenEden?
Aset tradisional di dunia nyata menghadapi hambatan signifikan dalam hal aksesibilitas dan likuiditas. OpenEden mengatasi tantangan-tantangan ini dengan beberapa keunggulan:
Kepemimpinan Berpengalaman: Didirikan oleh Jeremy Ng dengan pengalaman di Gemini, Goldman Sachs, Morgan Stanley, dan Deutsche Bank, menggabungkan keahlian keuangan institusional dengan pengetahuan industri kripto.
Kemitraan Institusional: BNY Mellon bertindak sebagai manajer investasi dan kustodian utama, menyediakan keamanan dan pengelolaan tingkat institusional untuk aset yang ditokenisasi.
Validasi Pendanaan: Penggalangan dana sebesar $5 juta dari YZi Labs dan UXD Protocol menunjukkan kepercayaan modal ventura terhadap tokenisasi aset dunia nyata yang teregulasi.
Infrastruktur Multi-Chain: Dukungan native untuk Ethereum, Arbitrum, Base, Solana, BNB Chain, dan XRP Ledger memungkinkan akses yang luas dan interoperabilitas cross-chain.
Kemitraan Utama: Kerja sama dengan Chainlink untuk interoperabilitas cross-chain, Curve dan Balancer untuk integrasi DeFi, Ceffu dan Anchorage untuk solusi penyimpanan, dan Bake untuk akses ritel.
Pendekatan Teregulasi: Platform yang mengutamakan kepatuhan dengan penyimpanan yang transparan, proof-of-reserves, dan kepatuhan terhadap regulasi memberikan kepercayaan pengguna dan kepercayaan institusional.
Integrasi DeFi: Token yang didesain untuk integrasi yang mudah ke dalam protokol DeFi utama seperti Curve, Balancer, Euler, Pendle, dan ZeroLend untuk pinjaman, peminjaman, dan peluang imbal hasil.
Produk dengan Imbal Hasil Nyata: TBILL dan USDO token memberikan imbal hasil aktual dari Surat Utang Negara AS daripada emisi token inflasi, menciptakan nilai yang berkelanjutan.
Platform ini berhasil mengintegrasikan keuangan tradisional dengan teknologi blockchain, sehingga produk keuangan berstandar institusional dapat diakses oleh pengguna global sambil tetap menjaga transparansi dan keamanan.

OpenEden (EDEN) Mulai Aktif di Bitget
Kami dengan bangga mengumumkan bahwa OpenEden (EDEN) akan listing di Zona Inovasi dan Zona RWA. Lihat detailnya di bawah ini:
Perdagangan Tersedia: 30 September 2025, pukul 18.00 WIB
Trading EDEN/USDT di Bitget!
Disclaimer: Opini yang diungkapkan dalam artikel ini hanya untuk tujuan informasi saja. Artikel ini bukan merupakan bentuk dukungan terhadap produk dan layanan apa pun yang dibahas atau pun saran investasi, keuangan, atau perdagangan. Disarankan untuk berkonsultasi dengan para profesional yang berkualifikasi sebelum membuat keputusan keuangan.
Peringatan risiko
Hanya dengan akun Bitget, kamu dapat trading saham dan mata uang kripto secara bersamaan.
Gabung Sekarang!FAQ
Berapa harga saham Synchrony Financial?
Apa ticker saham dari Synchrony Financial?
Berapa prakiraan harga saham SYF?
Berapa kapitalisasi pasar Synchrony Financial?
Apa itu rasio P/E (TTM)?
Rasio P/E (TTM) merupakan singkatan dari price-to-earnings ratio atau rasio harga terhadap pendapatan (12 bulan terakhir). Ini adalah metrik valuasi historis yang dihitung menggunakan pendapatan per saham (EPS) perusahaan selama 12 bulan terakhir secara berturut-turut, yang mencerminkan profitabilitas perusahaan di masa lalu.
Rasio P/E mengukur hubungan antara harga saham dan profitabilitas perusahaan, dan sering digunakan sebagai dasar untuk menilai apakah suatu saham “murah” atau “mahal.”
Rasio P/E = harga pasar (P) ÷ pendapatan per saham (EPS), atau rasio P/E = total kapitalisasi pasar ÷ profit bersih yang dapat diatribusikan kepada pemegang saham.
Interpretasi rasio P/E (TTM) harus selalu dipertimbangkan bersama faktor lain dan utamanya digunakan untuk perbandingan valuasi, bukan sebagai indikator tunggal.
- Rasio P/E (TTM) yang lebih rendah berarti investor membayar lebih sedikit untuk setiap unit pendapatan. Hal ini dapat mengindikasikan bahwa saham tersebut undervalued (dinilai terlalu rendah), atau bahwa pasar memiliki ekspektasi yang terbatas terhadap pertumbuhan masa depan perusahaan, seperti di industri yang sudah matang atau bertumbuh lambat.
- Rasio P/E yang lebih tinggi (TTM) berarti investor membayar lebih untuk setiap unit pendapatan. Ini sering mencerminkan ekspektasi pertumbuhan pendapatan yang kuat di masa depan, yang umum terjadi pada saham pertumbuhan atau teknologi, meskipun hal ini juga dapat menunjukkan bahwa saham tersebut overvalued (dinilai terlalu tinggi).
- Perbandingan dengan pesaing: Bandingkan P/E (TTM) perusahaan dengan rata-rata atau P/E median dari perusahaan lain dalam industri yang sama. P/E yang jauh lebih tinggi mungkin memerlukan analisis lebih lanjut untuk menentukan apakah valuasi tinggi perusahaan dijustifikasi oleh prospek pertumbuhan yang lebih kuat atau keunggulan kompetitif.
- Perbandingan dengan level historis: Bandingkan P/E (TTM) perusahaan saat ini dengan rata-rata historisnya (misalnya selama 5 atau 10 tahun terakhir) untuk menilai apakah valuasi saat ini berada pada level historis tertinggi atau terendah.
- Perbandingan dengan pasar yang lebih luas: Bandingkan P/E (TTM) perusahaan dengan indeks pasar utama (seperti S&P 500) untuk melihat bagaimana pasar menilai perusahaan secara keseluruhan.
Rasio P/E dapat bervariasi secara signifikan antar industri, dan tidak ada satu pun tingkat P/E yang “ideal”. Rentang P/E yang wajar bergantung pada industri, potensi pertumbuhan perusahaan, dan lingkungan ekonomi makro yang lebih luas. Keputusan investasi tidak boleh hanya mengandalkan rasio P/E (TTM), tetapi harus didasarkan pada analisis komprehensif yang mencakup kualitas perusahaan, prospek pertumbuhan, dan kesehatan keuangan.
Apakah saya bisa trading saham di Bitget?
Kamu bisa trading saham di Bitget, namun utamanya melalui token saham dan futures saham, bukan dengan membeli atau menjual saham tradisional secara langsung.
Pendekatan ini mencerminkan visi Bitget sebagai Exchange Universal (UEX), yang dirancang untuk menghubungkan pasar keuangan tradisional dengan pasar mata uang kripto.
Bitget saat ini menawarkan format perdagangan terkait saham berikut:
1. Token saham (spot)
Sifat: Token saham adalah token digital yang dipatok ke harga saham tradisional tertentu (seperti TSLAUSDT dan NVDAUSDT) dan diperdagangkan di pasar spot Bitget.
Fitur: Ketika kamu trading token saham, kamu membeli dan menyimpan token, bukan memiliki saham tradisional pendasar.
- Harga token-token ini umumnya mengikuti pergerakan harga saham yang menjadi patokannya, seperti Tesla atau Nvidia.
- Keunggulannya adalah kamu dapat berpartisipasi dalam pergerakan harga aset keuangan tradisional, seperti saham AS, menggunakan mata uang kripto (misalnya USDT), tanpa perlu memiliki akun broker tradisional.
2. Futures saham
Sifat: Bitget juga menawarkan futures perpetual USDT-margin, yang umumnya dirujuk sebagai futures saham, yang didasarkan pada saham blue-chip AS terkemuka seperti Tesla dan Meta.
Karakteristik: Futures saham adalah produk derivatif yang memungkinkan kamu untuk mengambil sikap bullish atau bearish terhadap harga saham pendasar di masa depan melalui perdagangan margin. Produk-produk ini umumnya mendukung leverage, seperti hingga 25x.
Ini tidak melibatkan kepemilikan saham pendasar. Sebaliknya, profit dan kerugian diselesaikan berdasarkan pergerakan harga futures.
Catatan penting: Ketika trading futures saham di Bitget, kamu berpartisipasi dalam pasar derivatif di dalam ekosistem mata uang kripto. Hal ini secara fundamental berbeda dengan membeli saham yang diperdagangkan secara publik melalui broker tradisional, karena kamu tidak memiliki ekuitas di perusahaan yang mendasari.
Perdagangan futures dan penggunaan leverage melibatkan risiko yang tinggi. Harap pastikan kamu sepenuhnya memahami risiko sebelum melakukan perdagangan.
Jika kamu ingin langsung memiliki aset ekuitas dalam bentuk saham tradisional dan menikmati hak pemegang saham (seperti menerima dividen), kamu harus melakukan perdagangan melalui broker sekuritas tradisional yang teregulasi atau platform broker.
Apa saja keunggulan dari futures saham Bitget?
Futures saham Bitget—biasanya futures perpetual yang didasarkan pada harga token saham—merupakan penawaran inovatif yang memungkinkan platform mata uang kripto untuk menyediakan eksposur ke pasar keuangan tradisional.
Dibandingkan dengan perdagangan futures atau saham tradisional, mereka menawarkan beberapa keunggulan unik, terutama karena infrastruktur perdagangan platform tersebut.
Futures saham Bitget, yang umumnya merupakan derivatif berdenominasi USDT, menawarkan keunggulan utama sebagai berikut:
1. Kemudahan perdagangan dan aksesibilitas global
- Perdagangan 24/7: Pasar saham tradisional, seperti pasar ekuitas AS, beroperasi selama jam perdagangan tetap. Di sisi lain, pasar derivatif mata uang kripto biasanya buka 24/7. Artinya, investor dapat trading kapan saja, memanfaatkan berita terbaru atau fluktuasi pasar.
- Hambatan masuk yang lebih rendah dan proses onboarding yang lebih cepat: Dibandingkan dengan broker tradisional yang seringkali memerlukan verifikasi identitas yang rumit dan proses pembuatan akun yang panjang, Bitget umumnya menawarkan proses onboarding akun yang lebih cepat. Pengguna dapat trading menggunakan mata uang kripto seperti USDT, tanpa memerlukan prosedur deposit dan penarikan fiat yang rumit.
- Aksesibilitas global: Pengguna dapat mengakses perdagangan derivatif yang terhubung dengan saham-saham yang diakui secara global melalui platform Bitget, sesuai dengan regulasi yang berlaku.
2. Efisiensi modal dan leverage tinggi
- Opsi dengan leverage tinggi: Futures saham umumnya menawarkan leverage yang lebih tinggi dibandingkan dengan perdagangan saham tradisional (misalnya, hingga 25x) Hal ini memungkinkan para trader untuk mengendalikan posisi yang lebih besar dengan persyaratan margin yang lebih kecil, sehingga meningkatkan efisiensi modal.
Catatan: Meskipun leverage tinggi dapat memperbesar keuntungan, leverage juga memperbesar kerugian secara proporsional. - Perdagangan dua arah: Trader dapat dengan mudah mengambil posisi long dan short. Artinya, para trader berpotensi mendapatkan profit dari volatilitas pasar, baik ketika harga saham naik maupun turun, asalkan arah pasar dapat diantisipasi dengan tepat.
3. Perdagangan dan penyelesaian menggunakan mata uang kripto
- Margin USDT: Futures saham di Bitget umumnya menggunakan USDT (atau stablecoin lainnya) sebagai mata uang margin dan penyelesaian. Bagi pengguna yang sudah menyimpan mata uang kripto, tidak perlu mengonversi aset ke mata uang fiat, sehingga mereka dapat trading secara langsung dengan stablecoin.
- Transfer dana yang efisien: Transfer dan penyelesaian berbasis kripto umumnya lebih cepat daripada sistem fiat tradisional, memungkinkan alokasi dana secara global yang lebih efisien.
4. Integrasi
Platform terpadu: Bitget memungkinkan pengguna untuk trading mata uang kripto spot, derivatif kripto, dan futures saham dalam satu platform, sehingga memudahkan pengelolaan berbagai jenis aset di satu tempat.
Meskipun futures saham Bitget menawarkan beberapa keunggulan, penting untuk memahami risiko yang terkait.
- Risiko leverage tinggi: Perdagangan dengan leverage dapat mengakibatkan hilangnya seluruh margin kamu dengan cepat.
- Tidak ada kepemilikan ekuitas: Saat trading futures saham, kamu tidak memiliki sahan pendasar. Akibatnya, kamu tidak berhak atas dividen atau hak voting.
- Risiko likuiditas pasar: Futures token saham mungkin memiliki likuiditas yang lebih rendah dibandingkan dengan instrumen serupa di pasar saham tradisional, terutama di luar jam perdagangan reguler.
Ringkasnya, futures saham Bitget menawarkan keunggulan seperti fleksibilitas perdagangan yang lebih besar, hambatan masuk yang lebih rendah, dan efisiensi modal yang lebih tinggi.
Berapa biaya perdagangan untuk futures saham Bitget?
Biaya perdagangan untuk futures saham Bitget (futures perpetual USDT-margin) utamanya mencakup biaya transaksi dan tingkat pendanaan.
Biaya transaksi:
Bitget menawarkan promosi biaya dengan waktu terbatas untuk futures saham (terutama futures token saham) dari waktu ke waktu untuk menarik para trader.
Tarif referensi standar: Di bawah struktur biaya futures standar Bitget, biaya taker biasanya sekitar 0,06%, sementara biaya maker sekitar 0,02%.
Promosi saat ini untuk futures saham (penting): Untuk mempromosikan produk futures sahamnya, Bitget menawarkan diskon biaya transaksi selama Q4 2025, dengan biaya taker serendah 0,006% dan biaya maker serendah 0,002%. Terdapat juga promosi dengan waktu terbatas yang menawarkan perdagangan tanpa biaya untuk token saham spot.
Tingkat pendanaan:
Tingkat pendanaan merupakan mekanisme kunci dalam futures perpetual (termasuk futures saham) yang membantu menjaga harga futures tetap selaras dengan harga spot aset pendasar. Ini bukan biaya yang dibebankan oleh platform, melainkan pembayaran periodik yang dipertukarkan antara trader posisi long dan trader posisi short.
Tingkat pendanaan berfluktuasi secara dinamis dan sebagian besar dipengaruhi oleh sentimen pasar serta ketidakseimbangan antara posisi long dan short. Futures saham umumnya mengalami volatilitas yang lebih rendah dibandingkan dengan mata uang kripto, sehingga tingkat pendanaan sering kali relatif rendah selama kondisi pasar yang stabil. Namun, selama musim laporan keuangan atau peristiwa berita besar yang positif atau negatif, konsentrasi yang tinggi pada posisi long atau short—seperti pada saham teknologi dengan pertumbuhan tinggi seperti Tesla atau Nvidia—dapat menciptakan ketidakseimbangan yang signifikan, menyebabkan tingkat pendanaan melonjak dalam jangka pendek.
Pembayaran pendanaan biasanya diselesaikan setiap 8 jam. Jika kamu menutup posisi sebelum waktu penyelesaian pendanaan, tidak ada pembayaran pendanaan yang akan dibebankan atau diterima.
Tingkat pendanaan bersifat tidak tetap. Jika kamu menahan posisi untuk periode yang lama, tingkat pendanaan positif yang tinggi (untuk posisi long) atau tingkat pendanaan negatif yang tinggi (untuk posisi short) akan memengaruhi biaya penahanan keseluruhan atau potensi imbal hasil kamu. Oleh karena itu, penting untuk memantau tingkat pendanaan secara real time di antarmuka perdagangan.
Mengapa Bitget merupakan platform yang ideal untuk trading futures saham?
Bitget telah memposisikan diri sebagai Exchange Universal (UEX) terkemuka dengan menjembatani kesenjangan antara keuangan tradisional (TradFi) dan ekosistem kripto. Pada akhir tahun 2025 dan awal tahun 2026, Bitget menjadi salah satu exchange tersentralisasi besar pertama yang menawarkan futures saham yang ditokenisasi, memungkinkan pengguna untuk trading derivatif ekuitas menggunakan alat native kripto.
Inilah alasan mengapa Bitget dianggap sebagai platform yang ideal untuk trading futures saham:
1. Agunan terpadu (USDT-margin)
Salah satu keunggulan terbesar adalah kemampuan untuk trading saham-saham AS—seperti Tesla (TSLA), NVIDIA (NVDA), dan Apple (AAPL)—dengan menggunakan USDT sebagai agunan.
- Tidak ada konversi fiat: Kamu tidak perlu keluar dari ekosistem kripto atau mengonversi ke USD untuk trading saham global.
- Efisiensi lintas aset: Kamu dapat mengelola posisi kripto dan saham kamu dari satu akun Futures USDT-M, sehingga memudahkan alokasi modal.
2. Efisiensi modal yang tinggi
Bitget menawarkan opsi leverage agresif yang biasanya tidak tersedia di platform broker tradisional:
- Leverage hingga 25x: Sementara broker saham tradisional sering membatasi trader ritel dengan leverage hingga 2x atau 4x, Bitget memungkinkan efisiensi modal yang jauh lebih tinggi.
- Perdagangan fraksional: Kamu dapat membuka posisi pada saham-saham mahal (seperti Meta atau Amazon) tanpa perlu modal penuh untuk setiap saham, berkat fleksibilitas ukuran posisi pada futures perpetual.
Jam perdagangan diperpanjang (24/5)
Pasar saham tradisional dibatasi oleh lonceng pembukaan dan penutupan pada akhir pekan. Produk futures saham Bitget dirancang untuk trader global modern:
- Akses berkelanjutan: Perdagangan biasanya berlangsung 24/5 (Senin sampai Jumat, UTC+8), mencerminkan fleksibilitas pasar kripto.
- Responsivitas makro: Jika perusahaan teknologi besar melaporkan penghasilannya setelah pasar New York tutup, pengguna Bitget sering dapat langsung bereaksi terhadap pergerakan harga melalui pasar token saham.
4. Struktur biaya kompetitif
Bitget telah mendisrupsi model broker tradisional dengan pendekatan biaya rendah:
- Biaya rendah: Biaya transaksi untuk futures saham seringkali berada atau di bawah angka 0,06%, yang sangat kompetitif dibandingkan dengan broker tradisional maupun platform hybrid kripto–TradFi lainnya.
- Tidak ada komisi tersembunyi: Berbeda dengan banyak broker “tanpa biaya” yang mendapatkan profit dari spread yang lebar (pembayaran untuk aliran order) , Bitget menggunakan model pendanaan dan margin yang transparan.
5. Perdagangan lanjutan dan copy trading
Bitget membawa DNA social trading ke pasar saham:
- Copy trading untuk saham: Kamu dapat mengikuti elite trader yang berspesialisasi di pasar ekuitas, secara otomatis menyalin perdagangan futures saham mereka.
- Alat berbasis AI: Platform ini dilengkapi dengan AI agent yang membantu eksekusi perdagangan, manajemen risiko, dan analisis teknis.
Bagaimana exchange Bitget melindungi aset pengguna dengan lebih baik?
Bitget telah membentuk sistem pertahanan multidimensi dan transparan untuk melindungi aset pengguna, yang dirancang khusus untuk mengatasi tantangan kepercayaan yang melekat pada exchange tersentralisasi (CEX).
Berikut adalah lima pilar utama perlindungan aset Bitget:
Bitget mempertahankan Dana Perlindungan khusus, yang berfungsi sebagai garis pertahanan terakhir terhadap serangan hacker atau pelanggaran keamanan.
- Skala besar: Per awal tahun 2026, valuasi rata-rata dana tersebut tetap dipertahankan di sekitar $600 juta (sebelumnya mencapai puncak di atas $750 juta).
- Diversifikasi aset: Dana ini terdiri dari aset-aset dengan likuiditas tinggi seperti BTC dan USDT, memastikan solvabilitas bahkan selama volatilitas pasar yang ekstrem.
- Didanai sendiri: Dana ini tidak bergantung pada asuransi pihak ketiga. Bitget mendanai sendiri dan berkomitmen untuk mempertahankan saldo di atas $300 juta selama setidaknya tiga tahun tanpa penarikan.
Untuk menunjukkan bahwa platform tidak menyalahgunakan dana pengguna, Bitget menggunakan arsitektur Merkle Tree untuk memublikasikan laporan cadangan secara berkala.
- Rasio cakupan tinggi: Data pada bulan Januari 2026 menunjukkan bahwa rasio cadangan rata-rata untuk aset inti (BTC, ETH, USDT, USDC) mencapai 163%, jauh melebihi patokan 1:1.
- Verifikasi mandiri: Pengguna dapat menggunakan alat sumber terbuka yang disediakan oleh platform untuk memverifikasi bahwa aset mereka termasuk dalam snapshot cadangan melalui ID anonim.
3. Isolasi cold wallet/hot wallet dan multi-sig
Pada tingkat teknis pendasar, Bitget menggunakan arsitektur keamanan tingkat bank:
- 95% penyimpanan offline: Sebagian besar aset pengguna disimpan dalam cold wallet, yang sepenuhnya terisolasi dari internet untuk mencegah peretasan jarak jauh.
- Multi tanda tangan (multi-sig): Transfer dana penting memerlukan tanda tangan dari beberapa pemegang penting yang tersebar secara geografis dan independen, sehingga menghilangkan risiko kegagalan pada satu titik tunggal.
4. Kebijakan keamanan penarikan yang ketat
Untuk memitigasi risiko pencurian akun individu, Bitget telah menerapkan beberapa mekanisme perlindungan:
- Penguncian whitelist penarikan: Setelah menambahkan alamat penarikan baru, akun akan masuk ke periode pembekuan penarikan selama 24 jam.
- Konfirmasi pemindaian lintas perangkat: Fitur yang diluncurkan pada tahun 2026 mengharuskan setiap penarikan yang dilakukan di web dikonfirmasi dengan memindai kode QR melalui aplikasi seluler, sehingga secara efektif mencegah trojan berbasis PC untuk memanipulasi alamat.
5. Kepatuhan dan sertifikasi internasional
Bitget secara aktif mematuhi regulasi dan telah memperoleh beberapa sertifikasi keamanan informasi internasional:
- ISO 27001 dan ISO 27701: Bitget telah memperoleh sertifikasi ganda untuk Manajemen Keamanan Informasi dan Manajemen Informasi Privasi, menunjukkan bahwa proses internalnya memenuhi standar kepatuhan global tingkat atas.