

Lundin Gold
Terakhir diperbarui pada 2026-03-31 17:16 EST. Informasi harga saham bersumber dari TradingView dan merefleksikan harga pasar real time.
Perubahan harga saham LUG
Saham trending
Tentang Bitget
Data utama LUG
Apakah kamu pernah mendengar tentang token saham?
Cara baru untuk trading saham — kapan saja, di mana saja, 24/7.
Pelajari selengkapnyaRingkasan Lundin Gold
LUG Pulse
Pembaruan harian tentang harga saham LUG, arus dana, dan berita pasar, yang dihasilkan oleh AI dan ditinjau oleh tim analis kami. Selalu DYOR.
Prakiraan Harga Saham LUG
Berdasarkan indikator teknis untuk saham LUG, harga diperkirakan akan berfluktuasi di kisaran 96.55–129.26 CAD selama seminggu ke depan. Analis pasar memprediksi bahwa harga saham LUG kemungkinan akan berfluktuasi di kisaran 94.63–135.11 CAD selama beberapa bulan ke depan.
Berdasarkan prakiraan harga selama 1 tahun dari 61 analis, estimasi tertinggi adalah 188.58 CAD, sementara estimasi terendah adalah 142.22 CAD.
Berita saham LUG terbaru
Kompetitor LUG
| Nama | Kap. pasar | Harga | Perubahan % | Rasio P/E | EPS terdilusi (12 Bulan Terakhir) | Imbal hasil deviden (12 Bulan Terakhir) |
|---|---|---|---|---|---|---|
 Teck Resources TECK | 21.29BUSD | 43.62USD | +1.69% | 25.10 | 1.737 USD | 0.84% |
18.46BUSD | 370.71USD | -1.65% | 43.06 | 8.609 USD | 0.21% | |
 Royal Gold RGLD | 20.25BUSD | 238.76USD | +0.51% | 34.99 | 6.823 USD | 0.77% |
15.55BUSD | 300.49USD | +0.30% | 21.51 | 13.968 USD | 1.60% | |
 ATI ATI | 18.55BUSD | 135.50USD | -3.51% | 47.51 | 2.852 USD | 0.00% |
8.10BUSD | 45.59USD | -11.99% | 0.00 | -0.518 USD | 0.00% |


Tren terbaru di industri saham dan strategi perdagangan saham Bitget
Tokenisasi saham muncul sebagai tren utama di persimpangan antara keuangan tradisional dan pasar mata uang kripto. Dengan membawa aset seperti saham ke dalam blockchain dan memfasilitasi perdagangan global 24/7, ini meningkatkan aksesibilitas, efisiensi, dan transparansi bagi para investor.
Bitget memandang dukungan perdagangan saham sebagai arah strategis utama dalam pengembangan platform. Bitget saat ini mendukung perdagangan token saham dan futures saham, dan telah menetapkan diri sebagai pemain utama di bidang ini.
Keunggulan utama dari futures saham Bitget terletak pada inovasi dan desain yang berfokus pada pengguna:
1. Pertama di dunia: Futures indeks saham yang ditokenisasi pertama di industri, didukung oleh berbagai sumber harga untuk transparansi dan keamanan yang lebih besar.
2. Leverage tinggi: Mendukung leverage hingga 25x, memaksimalkan efisiensi modal dan potensi imbal hasil.
3. Aset pendasar yang beragam: Mencakup ratusan saham populer, mendukung berbagai strategi perdagangan.
4. Biaya transaksi rendah: Biaya ditetapkan sebesar 0,06%, sehingga mengurangi biaya bagi para trader dengan frekuensi tinggi.
5. Mekanisme perhitungan indeks: Berdasarkan harga USDT dari aset yang ditokenisasi dari berbagai emiten (misalnya, xStocks, Ondo). Bobot dihitung ulang secara berkala atau setiap kali terjadi peristiwa pasar besar untuk memastikan indeks tetap sejalan dengan kondisi pasar.
Per awal bulan Desember 2025, Bitget telah mencatat volume perdagangan lebih dari $18 miliar di pasar futures saham, menjadikannya salah satu platform terpopuler untuk token saham dan futures saham. Pada akhir tahun 2026, volume perdagangan kumulatif Bitget di pasar futures saham diperkirakan akan melebihi $100 miliar.
Lanjutkan membaca untuk mempelajari lebih lanjut tentang aset yang didukung untuk diperdagangkan di Bitget, serta informasi detail tentang token saham Bitget dan futures saham.
Token saham yang sedang tren


Futures saham yang sedang tren


Artikel yang berkaitan dengan token saham dan futures saham
Sebagai exchange kripto terkemuka, Bitget menawarkan beragam produk derivatif, termasuk futures perpetual kripto klasik (seperti BTCUSDT dan ETHUSDT) serta futures saham yang inovatif—futures perpetual USDT-margin yang melacak indeks saham AS yang ditokenisasi (seperti TSLA, NVDA, AAPL).
Kedua jenis produk ini mendukung leverage, mode hedging (long/short), dan penyelesaian USDT. Keduanya juga merupakan futures perpetual tanpa kedaluwarsa, menggunakan mekanisme tingkat pendanaan untuk menjaga harga tetap terikat pada harga spot aset pendasar. Namun, keduanya berbeda secara signifikan dalam hal karakteristik aset dasar, volatilitas, profil risiko, dan pengalaman perdagangan secara keseluruhan. Futures saham memungkinkan kamu untuk meningkatkan imbal hasil dengan leverage sambil didukung oleh fundamental yang relatif stabil dan pengawasan regulasi pasar saham AS. Dibandingkan dengan futures kripto murni, mereka jauh lebih tahan terhadap fluktuasi harga ekstrem (seperti penurunan mendadak), sehingga risiko secara keseluruhan lebih terkelola. Hal ini menjadikannya pilihan ideal bagi trader yang ingin menggabungkan stabilitas keuangan tradisional dengan fleksibilitas kripto.
Keunggulan inti perps saham Bitget dibandingkan futures kripto
Futures saham menggabungkan aset keuangan tradisional dengan derivatif kripto, menawarkan keunggulan yang jelas di berbagai dimensi. Produk ini sangat cocok untuk pengguna dengan toleransi risiko moderat atau investor yang ingin diversifikasi portofolio mereka dari volatilitas tinggi kripto.
| Dimensi |
Futures saham Bitget (saham AS, futures perpetual) |
Futures kripto Bitget (kripto seperti BTC/ETH, futures perpetual) |
Mengapa futures saham lebih unggul |
| Volatilitas aset dasar |
Rendah hingga menengah (pergerakan harian 1–5%, kadang lebih tinggi untuk nama seperti NVDA) |
Sangat tinggi (pergerakan harian BTC 5–15%; bisa melampaui 20% dalam kondisi ekstrem) |
Saham AS lebih jarang mengalami flash crash dan lebih didorong oleh fundamental, sehingga mengurangi risiko likuidasi black swan. |
| Flash crash/pergerakan ekstrem |
Risiko lebih rendah (harga lebih stabil karena pasar teregulasi dan agregasi indeks dari banyak sumber) |
Risiko lebih tinggi (pasar yang terdesentralisasi rentan terhadap order besar dan manipulasi) |
Perps saham menggunakan indeks komposit dari berbagai sumber yang ditokenisasi untuk penemuan harga yang lebih adil, sehingga flash crash jauh lebih kecil kemungkinannya dibanding kripto. |
| Leverage |
Hingga 100x pada saham populer, 10–25x pada indeks |
Hingga 125x (untuk kripto utama seperti BTC) |
Leverage moderat memperbesar pengembalian sambil mengendalikan risiko berlebihan, sehingga lebih cocok untuk menambah posisi secara bertahap. |
| Tingkat pendanaan / biaya menahan posisi |
Biasanya lebih rendah (tergantung rasio long/short), stabil pada periode tertentu |
Sangat fluktuatif (pemegang posisi long sering membayar biaya tinggi saat pasar bullish) |
Biaya menahan posisi jangka panjang lebih dapat diprediksi, mengurangi risiko tergerusnya profit akibat Biaya Pendanaan. |
| Biaya Transaksi |
Sangat rendah (biaya maker bisa 0%, biaya taker serendah 0,0065%, dengan banyak promo waktu terbatas) |
Standar di 0,02% untuk order maker dan 0,06% untuk order taker |
Biaya transaksi yang jauh lebih rendah berarti Anda bisa membuka posisi lebih besar atau trading lebih sering dengan modal yang sama. |
| Level risiko keseluruhan |
Relatif lebih rendah (didukung fundamental saham dan volatilitas yang lebih rendah) |
Lebih tinggi (didorong spekulasi murni dan volatilitas tinggi) |
Meski leverage memperbesar pengembalian, probabilitas likuidasi lebih rendah, sehingga cocok untuk strategi jangka menengah hingga panjang. |
| Diversifikasi dan hedging |
Mudah dikombinasikan dengan portofolio kripto untuk mengurangi risiko aset tunggal |
Sangat berkorelasi (sebagian besar kripto bergerak sejalan dengan BTC) |
Memberikan eksposur langsung ke keuangan tradisional, memungkinkan diversifikasi aset yang sebenarnya. |
| Pengguna target |
Pengguna kripto dengan toleransi risiko sedang yang menginginkan eksposur saham AS tetapi tidak menyukai volatilitas tinggi |
Pemain kripto murni dengan toleransi risiko tinggi yang mengejar pengembalian maksimum |
Jembatan yang lebih mudah diakses dan stabil ke pasar tradisional, menurunkan peluang trader baru kehilangan seluruh investasi mereka. |
Singkatnya, futures saham Bitget mempertahankan fleksibilitas perdagangan kripto (leverage, penyelesaian USDT, mode hedging) sambil secara signifikan mengurangi volatilitas dan risiko ekstrem. Mereka bertindak sebagai jembatan ideal bagi pengguna kripto yang ingin naik kelas ke keuangan tradisional.
Trading perps saham vs. futures kripto: Skenario penggunaan
Mari kita asumsikan seorang pengguna memiliki 1000 USDT dan menggunakan leverage 10x di Bitget, dengan tujuan menahan posisi tersebut selama satu minggu. Contoh sederhana ini (tidak termasuk biaya/tingkat pendanaan untuk ilustrasi) menunjukkan perbedaan potensial dalam hasil dan risiko.
Skenario 1: Long pada saham teknologi (NVDA)
-
Futures saham: Asumsikan NVDA naik 8% dalam satu minggu (pergerakan khas pasca-laporan penghasilan). Dengan leverage 10x, profit kira-kira 80%. 1000 USDT menjadi 1800 USDT. Volatilitas ringan dengan nyaris tanpa penurunan mendadak, memberi ketenangan dan risiko likuidasi yang sangat rendah.
-
Futures kripto: Asumsikan BTC naik 8% dalam lingkungan bullish yang sama. Profit teoritisnya juga 80% dengan leverage 10x. Namun, BTC sering mengalami koreksi sebesar 10–15%. Posisi tersebut dapat dengan mudah dilikuidasi atau dilikuidasi sebagian di tengah jalan, yang berpotensi membuat kamu kehilangan modal awal meskipun arah akhir benar.
Skenario 2: Volatilitas pasar ekstrem (berita negatif)
-
Futures saham: Pasar turun 4% dalam sehari karena komentar The Fed. Dengan leverage 10x, kerugian 40%, menyisakan saldo 600 USDT. Saham AS jarang turun lebih dari 10% dalam satu hari dan cenderung pulih, dengan lebih sedikit likuidasi berantai.
-
Futures kripto: Dengan leverage 10x yang sama, flash crash 10% (umum di kripto) akan menghasilkan kerugian 100%, menghapus akun.
Contoh-contoh ini menunjukkan bahwa futures saham memungkinkan leverage untuk memperbesar imbal hasil tanpa memperbesar risiko kerugian total. Hal ini sangat berharga selama musim laporan penghasilan atau peristiwa makro, memungkinkan kamu untuk menangkap aset alpha di pasar saham AS sambil menghindari penurunan drastis yang umum terjadi di pasar kripto.
Siapa yang paling cocok menggunakan perps saham Bitget?
1. Investor bullish atau bearish terhadap saham AS tanpa akun tradisional: Kamu bisa trading pergerakan arah pada saham populer seperti Apple, Tesla, Nvidia, dan Coinbase secara langsung dengan USDT di dompet kripto kamu, tanpa perlu repot dengan akun broker tradisional, transfer lintas batas, dan batasan geografis.
2. Native kripto yang sudah familiar dengan futures kripto dan pasar 24/7: Antarmuka perdagangan, jenis order (limit, pasar, dan order bersyarat), penyesuaian leverage, manajemen posisi, dan mekanisme pendanaan sangat mirip dengan futures perpetual BTC/USDT atau ETH/USDT. Bagi trader kripto berpengalaman, kurva pembelajaran hampir tidak ada, dan jam perdagangan merupakan peningkatan besar dibandingkan jam pasar tradisional.
3. Trader agresif/spekulatif yang mencari leverage tinggi: Dengan leverage yang jauh melebihi margin 2–4x yang ditawarkan oleh broker saham tradisional, ini sangat cocok untuk menggunakan modal kecil untuk menangkap reli besar (seperti di Tesla atau Nvidia) atau untuk mengambil posisi short besar pada saham teknologi yang dinilai terlalu tinggi. Perlu diingat bahwa hal ini juga berarti risiko yang sangat tinggi dan hanya cocok untuk pengguna dengan toleransi risiko yang tinggi.
4. Trader hibrida yang aktif di pasar kripto dan saham: Dengan satu akun Bitget dan satu pool modal USDT, kamu bisa beralih dengan mulus antara futures kripto dan futures saham. Ini memaksimalkan efisiensi modal dan kecepatan operasional, terutama buat mereka yang sering melakukan penyeimbangan ulang atau mencari lindung nilai lintas pasar.
5. Trader profesional atau semi-profesional yang mencari akses tanpa hambatan, 24/7: Ini mencakup mereka yang ingin melindungi portofolio kripto, berspekulasi pada saham/indeks teknologi, atau menjalankan bot grid/kuantitatif. Platform ini mendukung grafik TradingView, API, dan alat profesional seperti order TP/SL.
Kesimpulan
Jika kamu adalah seorang veteran kripto yang bosan dengan volatilitas tinggi yang berlebihan tetapi tetap ingin ikut serta dalam pertumbuhan perusahaan global terkemuka (seperti Apple, Tesla, Nvidia), futures saham Bitget adalah pilihan yang sangat baik. Mereka menggabungkan yang terbaik dari kedua dunia—leverage, akses 24/7, dan hambatan rendah, sambil secara signifikan mengurangi emosi FOMO yang khas dalam kripto.
Perdagangan melibatkan risiko yang signifikan. Mulailah dengan jumlah kecil, gunakan leverage rendah, selalu pasang TP/SL, dan trading secara bertanggung jawab. Silakan mencobanya di Bitget!
OpenEden adalah platform berbasis blockchain yang berfokus pada tokenisasi aset dunia nyata, membawa aset nyata seperti Surat Utang Negara AS diintegrasikan ke dalam blockchain secara teratur, aman, dan mudah diakses. Didirikan oleh Jeremy Ng pada tahun 2022 dan didukung oleh YZi Labs dengan pendanaan sebesar $5 juta, OpenEden (EDEN) akan segera tersedia di Bitget!
Apa itu OpenEden (EDEN)?
OpenEden adalah platform tokenisasi aset dunia nyata yang mengubah produk keuangan tradisional seperti surat utang pemerintah dan obligasi menjadi token digital di blockchain. Produk unggulan platform ini meliputi TBILL (Surat Utang Negara AS yang ditokenisasi) dan USDO (stablecoin yang menghasilkan imbal hasil), yang memungkinkan pengguna untuk mengakses aset keuangan berkualitas institusional melalui teknologi blockchain.

Platform ini mengatasi hambatan akses, keterbatasan likuiditas, proses penyelesaian yang tidak efisien, dan gesekan regulasi yang dihadapi oleh aset tradisional saat bergerak di pasar global. OpenEden memungkinkan kepemilikan fraksional dan transfer yang lancar di blockchain sambil menyediakan platform yang diatur dan transparan yang memberikan kepercayaan kepada pengguna dalam pengelolaan aset.
Inovasi Inti: OpenEden menggunakan blockchain untuk mentokenisasi aset dunia nyata, artinya aset-aset ini diubah menjadi token digital yang mewakili kepemilikan atau hak. Hal ini memungkinkan pengguna untuk berinvestasi, trading, dan mengelola produk keuangan tradisional secara langsung di blockchain dengan transparansi dan efisiensi.
Siapa yang menciptakan OpenEden (EDEN)?
OpenEden didirikan pada tahun 2022 oleh Jeremy Ng, seorang eksekutif berpengalaman dengan latar belakang di bidang keuangan tradisional dan sektor kripto.

Jeremy Ng (Founder & CEO):
● Mantan Managing Director dan Head of APAC di Gemini
● Mantan CEO Leonteq Asia
● Mantan FICC Derivatives Head Goldman Sachs
● Posisi sebelumnya di Deutsche Bank dan Morgan Stanley
● Memiliki sertifikasi CFA
Anggota Tim Utama:
● Duke Du (CTO): Memimpin pengembangan teknis dengan pengalaman di organisasi fintech dan blockchain
● Wayne Tan (General Counsel): Bertanggung jawab atas kepatuhan hukum dan regulasi, sebelumnya bekerja di OKX dan Bybit
● Frederick Chng (Head of Product): Mengawasi strategi dan pengembangan produk
Tim ini memiliki puluhan tahun pengalaman dari Goldman Sachs, Morgan Stanley, Deutsche Bank, Gemini, OKX, Bybit, SEA, Accenture, dan BlockFi, menggabungkan keahlian keuangan institusional dengan kemampuan pengembangan blockchain.
Siapa saja investor modal ventura yang mendukung OpenEden (EDEN)?
OpenEden telah mengumpulkan dana sebesar $5 juta melalui beberapa putaran pendanaan dari investor kripto dan keuangan, disertai dengan kemitraan institusional tambahan.
Putaran Pendanaan:
● Mei 2023: $5 juta berhasil dikumpulkan
● September 2024: Putaran strategis (jumlah tidak diungkapkan)
Investor Modal Ventura Utama:
● YZi Labs (sebelumnya Binance Labs): Investor tahap awal terkemuka dan mitra strategis
● UXD Protocol: Investor dan mitra ekosistem
Kemitraan Institusi:
● Bank of New York Mellon (BNY): Ditunjuk sebagai manajer investasi utama dan kustodian utama untuk dana Surat Utang Negara AS yang ditokenisasi milik OpenEden, menyediakan layanan kustodian dan manajemen berkualitas institusional
Kombinasi dukungan modal ventura dari YZi Labs dan kemitraan institusional dengan BNY Mellon menunjukkan keyakinan yang kuat terhadap pendekatan yang diatur oleh OpenEden dalam tokenisasi aset dunia nyata.
Cara Kerja OpenEden (EDEN)
OpenEden memungkinkan pengguna untuk mengakses dan berinvestasi dalam produk keuangan dunia nyata melalui token berbasis blockchain sambil tetap mematuhi standar regulasi dan keamanan yang ketat.
Proses Tokenisasi Aset
OpenEden mengintegrasikan aset tradisional seperti Obligasi AS dan menyimpannya dengan aman di bank-bank tepercaya atau kustodian. Untuk setiap aset nyata yang dimiliki, OpenEden menerbitkan token digital di jaringan blockchain. Setiap token didukung secara 1:1 oleh aset dunia nyata dan secara rutin diaudit untuk membuktikan bahwa aset nyata disimpan dalam cadangan.
Infrastruktur Kontrak Pintar
Platform ini menggunakan kontrak pintar di blockchain untuk secara otomatis mengelola penciptaan, penebusan, dan perpindahan token, sehingga proses menjadi cepat, transparan, dan biaya rendah. Program-program ini berjalan di atas blockchain dengan aturan yang transparan dan eksekusi otomatis.
Dukungan Multi-Chain
OpenEden beroperasi di Ethereum dengan perluasan ke Arbitrum, Base, Solana, BNB Chain, dan XRP Ledger. Hal ini memberikan fleksibilitas dan biaya transaksi yang lebih rendah di berbagai jaringan, memungkinkan pengguna untuk memilih lingkungan blockchain yang mereka inginkan.
Proof-of-Reserves dan Keamanan
Mitra independen dan protokol secara rutin membuktikan bahwa setiap token sepenuhnya didukung oleh aset nyata melalui audit dan data blockchain. Aset nyata dilindungi oleh institusi-institusi yang diatur seperti BNY Mellon melalui layanan kustodian tingkat institusi, bukan penyimpanan perusahaan.
Interoperabilitas Cross-Chain
Integrasi dengan protokol CCIP Chainlink memungkinkan data proof-of-reserve cross-chain, penetapan harga on-chain untuk stablecoin, dan perpindahan token yang lancar di seluruh blockchain yang didukung.
Kamu bisa mengakses platform tersebut di openeden.com.
Token OpenEden (EDEN) dan Ekonomi
Token EDEN berfungsi sebagai aset digital native ekosistem OpenEden, memfasilitasi tata kelola, staking, dan partisipasi dalam ekosistem.
Detail Token
● Nama Token: OpenEden
● Simbol Token: EDEN
● Total Suplai: 1.000.000.000 token (1 miliar)
● Implementasi Blockchain: ERC-20 (Ethereum), dengan implementasi di Arbitrum, Solana, Base, BNB Chain, dan XRPL
● Alamat Kontrak Ethereum: 0x7c2a792acafcfc9dece3396e2119ccd036bab182
Distribusi Token
● Ekosistem: 30,22% - Pembukaan TGE 100%
● Tim & Penasihat: 20% - Pembukaan TGE 5%, cliff 6 bulan, vesting linear 24 bulan
● Investor: 15,28% - Pembukaan TGE 5%, cliff 6 bulan, vesting linear 24 bulan
● Perbendaharaan: 15% - Pembukaan TGE 50%, cliff 6 bulan untuk sisa 50%
● Mitra: 10% - Pembukaan TGE 81,25%, pembukaan bulanan 25% dengan denda klaim awal
● Kampanye Airdrop: 9,5% - Pembukaan TGE 25%, pembukaan bulanan 25% dengan denda klaim awal
Struktur Vesting: Token untuk tim, penasihat, dan investor mencakup jadwal vesting multi-tahun untuk menjamin keselarasan jangka panjang dengan protokol dan mencegah tekanan jual mendadak.
Utilitas Token
● Tata Kelola: Voting untuk peningkatan protokol, struktur biaya, dan keputusan ekosistem
● Staking: Staking token EDEN untuk membantu mengamankan jaringan dan menghasilkan hadiah platform
● Hadiah Ekosistem: Hasilkan insentif untuk penyediaan likuiditas, adopsi awal, dan partisipasi komunitas
● Diskon Biaya: Nikmati biaya platform yang lebih rendah dan fitur premium
● Komposabilitas DeFi: Digunakan sebagai agunan dalam pool likuiditas dan strategi penghasil imbal hasil pada protokol mitra
Mengapa OpenEden?
Aset tradisional di dunia nyata menghadapi hambatan signifikan dalam hal aksesibilitas dan likuiditas. OpenEden mengatasi tantangan-tantangan ini dengan beberapa keunggulan:
Kepemimpinan Berpengalaman: Didirikan oleh Jeremy Ng dengan pengalaman di Gemini, Goldman Sachs, Morgan Stanley, dan Deutsche Bank, menggabungkan keahlian keuangan institusional dengan pengetahuan industri kripto.
Kemitraan Institusional: BNY Mellon bertindak sebagai manajer investasi dan kustodian utama, menyediakan keamanan dan pengelolaan tingkat institusional untuk aset yang ditokenisasi.
Validasi Pendanaan: Penggalangan dana sebesar $5 juta dari YZi Labs dan UXD Protocol menunjukkan kepercayaan modal ventura terhadap tokenisasi aset dunia nyata yang teregulasi.
Infrastruktur Multi-Chain: Dukungan native untuk Ethereum, Arbitrum, Base, Solana, BNB Chain, dan XRP Ledger memungkinkan akses yang luas dan interoperabilitas cross-chain.
Kemitraan Utama: Kerja sama dengan Chainlink untuk interoperabilitas cross-chain, Curve dan Balancer untuk integrasi DeFi, Ceffu dan Anchorage untuk solusi penyimpanan, dan Bake untuk akses ritel.
Pendekatan Teregulasi: Platform yang mengutamakan kepatuhan dengan penyimpanan yang transparan, proof-of-reserves, dan kepatuhan terhadap regulasi memberikan kepercayaan pengguna dan kepercayaan institusional.
Integrasi DeFi: Token yang didesain untuk integrasi yang mudah ke dalam protokol DeFi utama seperti Curve, Balancer, Euler, Pendle, dan ZeroLend untuk pinjaman, peminjaman, dan peluang imbal hasil.
Produk dengan Imbal Hasil Nyata: TBILL dan USDO token memberikan imbal hasil aktual dari Surat Utang Negara AS daripada emisi token inflasi, menciptakan nilai yang berkelanjutan.
Platform ini berhasil mengintegrasikan keuangan tradisional dengan teknologi blockchain, sehingga produk keuangan berstandar institusional dapat diakses oleh pengguna global sambil tetap menjaga transparansi dan keamanan.

OpenEden (EDEN) Mulai Aktif di Bitget
Kami dengan bangga mengumumkan bahwa OpenEden (EDEN) akan listing di Zona Inovasi dan Zona RWA. Lihat detailnya di bawah ini:
Perdagangan Tersedia: 30 September 2025, pukul 18.00 WIB
Trading EDEN/USDT di Bitget!
Disclaimer: Opini yang diungkapkan dalam artikel ini hanya untuk tujuan informasi saja. Artikel ini bukan merupakan bentuk dukungan terhadap produk dan layanan apa pun yang dibahas atau pun saran investasi, keuangan, atau perdagangan. Disarankan untuk berkonsultasi dengan para profesional yang berkualifikasi sebelum membuat keputusan keuangan.
Introduksi
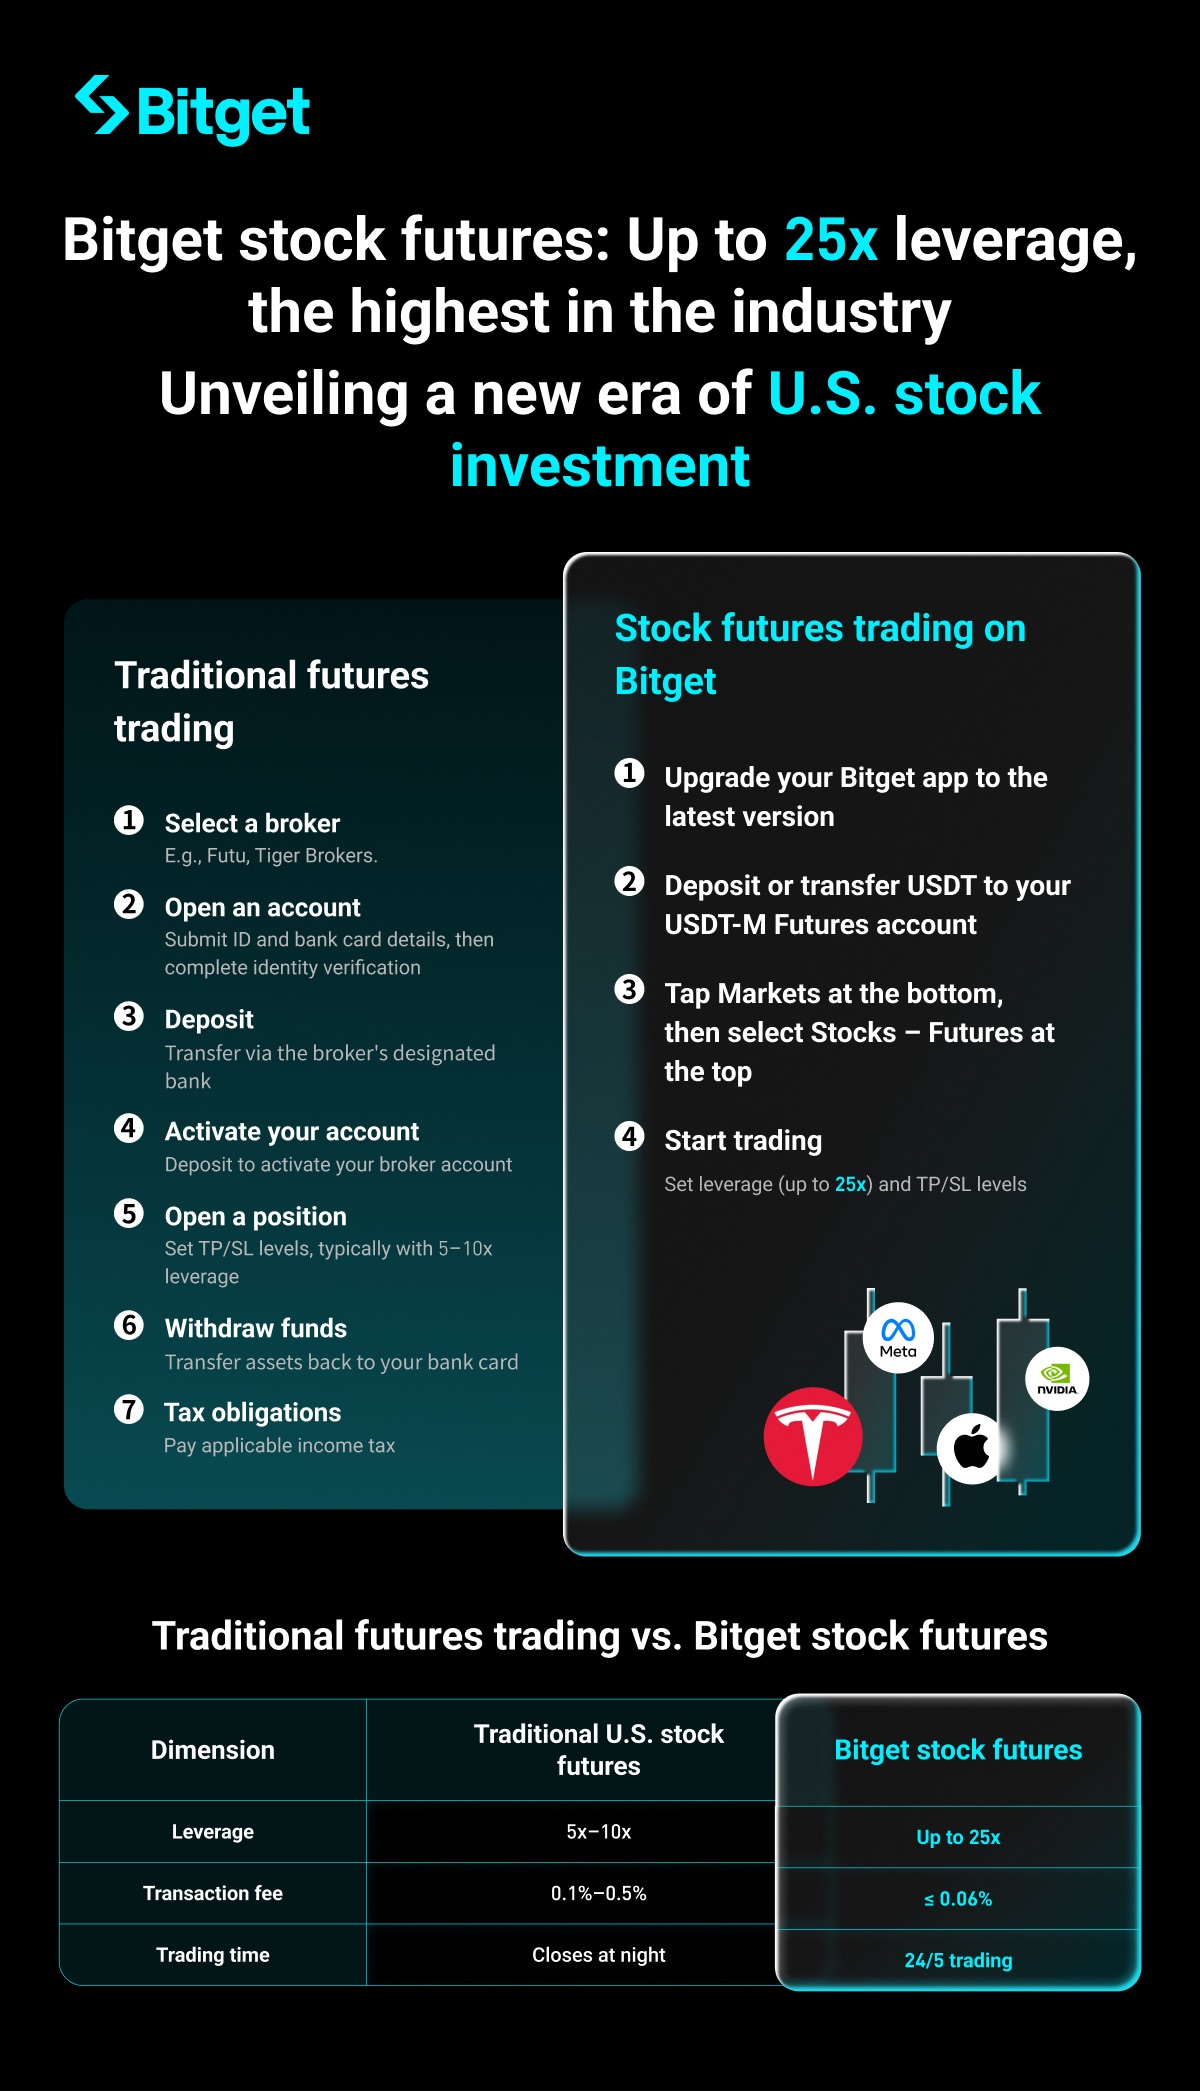
Sebagai platform perdagangan mata uang kripto terkemuka, Bitget baru-baru ini meluncurkan 25 futures perpetual saham AS, mendukungan leverage hingga 25x. Produk inovatif ini memungkinkan pengguna untuk memanfaatkan peluang investasi saham AS dengan penyelesaian dalam USDT, tanpa harus memegang aset saham pendasarnya secara langsung. Dibandingkan dengan futures saham AS tradisional, futures saham AS Bitget menawarkan keunggulan yang jelas dalam hal leverage, biaya transaksi, dan jam perdagangan. Artikel ini menjelaskan definisi, fitur, aset yang didukung, panduan perdagangan, manajemen risiko, dan pertimbangan untuk futures saham AS Bitget guna membantu pengguna memahami dan trading dengan aman.
Apa itu futures saham?
Futures saham adalah indeks futures perpetual inovatif untuk aset saham yang diperkenalkan oleh Bitget. Aset pendasarnya adalah indeks saham yang ditokenisasi dan sudah beredar di pasar. Setiap indeks meliputi setidaknya satu saham yang ditokenisasi, yang dapat berasal dari penerbit yang berbeda. Bitget menetapkan dan mempublikasikan bobot berdasarkan pangsa perdagangan pasar dan likuiditas. Contohnya, harga indeks futures perpetual NVDA/USDT dapat berupa indeks komposit dari saham yang ditokenisasi RWA NVDA yang diterbitkan oleh xStock, ONDO, dan lainnya.
Bitget menambahkan atau menghapus token atau pasar perdagangan berdasarkan faktor-faktor seperti aktivitas pasar dan volume perdagangan, serta memperbarui sumber indeks. Hal ini membuat harga futures menjadi lebih transparan dan stabil. Alih-alih melacak aset saham pendasarnya secara langsung, mereka melayani sebagai pengukur harga saham yang ditokenisasi.
Futures tradisional dan futures saham AS Bitget
Futures saham AS Bitget mengungguli futures saham AS tradisional dalam beberapa aspek. Berikut adalah perbandingan utama:
Perbedaan antara futures saham AS Bitget dan futures perpetual USDT-M standar
Futures saham AS Bitget didesain untuk berbeda dari futures perpetual USDT. Berikut adalah perbandingan utama:
| Fitur |
Futures saham |
Futures perpetual USDT reguler |
| Periode perdagangan |
5 × 24 jam (WIB: Senin dari pukul 11.00 hingga Sabtu pukul 11.00), dengan kemungkinan penangguhan pada waktu-waktu tertentu yang diumumkan sebelumnya. |
24/7 |
| Mata uang penyelesaian |
USDT |
USDT |
| Mata uang kuotasi |
USDT |
USDT |
| Aset pendasar |
Indeks gabungan dari aset-aset yang ditokenisasi yang diterbitkan di berbagai platform (indeks multi-token) |
Sebuah token tunggal yang ditunjuk |
| Mode posisi |
Hanya mode isolated margin |
Isolated margin, cross margin, dan akun perdagangan terpadu |
| Leverage maks |
25x |
125x |
| Harga indeks |
Indeks gabungan harga token dari pasar seperti xStock dan ONDO |
Harga pasar spot dari token yang ditunjuk |
| Harga mark |
Metode standar |
Metode standar |
| Batas open interest (OI) |
Batas OI individu maupun batas OI platform secara keseluruhan berlaku |
Batas OI individu saja |
| Tingkat pendanaan |
4j |
Setiap 1j, 2j, 4j, atau 8j |
Keunggulan futures saham AS Bitget
Keunggulan utama dari futures saham AS Bitget terletak pada inovasi dan desain yang ramah pengguna:
1. Yang pertama di dunia: Futures indeks saham yang ditokenisasi pertama di industri ini, yang didukung oleh berbagai sumber harga untuk transparansi dan keamanan yang lebih besar.
2. Leverage tinggi: Mendukung leverage hingga 25x untuk memaksimalkan potensi profit dan meningkatkan efisiensi modal.
3. Aset pendasar yang beragam: Mencakup lebih dari 20 saham AS populer untuk mendukung berbagai strategi perdagangan.
4. Biaya transaksi rendah: Tarif biaya transaksi tidak melebihi 0,06%, sehingga mengurangi biaya bagi para trader dengan frekuensi tinggi.
5. Perhitungan indeks: Berdasarkan harga USDT dari aset yang ditokenisasi oleh penerbit yang berbeda (misalnya, xStock, ONDO), bobot-bobot dihitung ulang secara reguler atau setiap kali terjadi peristiwa besar, menjamin indeks tetap mengikuti perubahan pasar.
Penyeimbangan kembali indeks
● Penyeimbangan kembali secara reguler: Komponen indeks dan bobot-bobotnya dihitung ulang setiap hari pada pukul 03.01 WIB.
● Penyesuaian khusus: Jika komponen mengalami perubahan signifikan (seperti delisting, kurangnya likuiditas, atau volatilitas ekstrem), komponen tersebut akan dihapus, bobot akan dihitung ulang, dan komponen pengganti akan digunakan.
● Hard fork/airdrop/penyesuaian: Tidak diperlukan penyesuaian untuk fork yang tidak menghasilkan token baru. Jika token baru dihasilkan, mereka akan disertakan dengan bobot asli. Jika mereka tidak memenuhi kriteria, mereka akan dihapus pada penyeimbangan kembali berikutnya. Untuk split atau merge token, komponen asli akan diganti dengan token baru, dan bobotnya akan disesuaikan sesuai dengan itu.
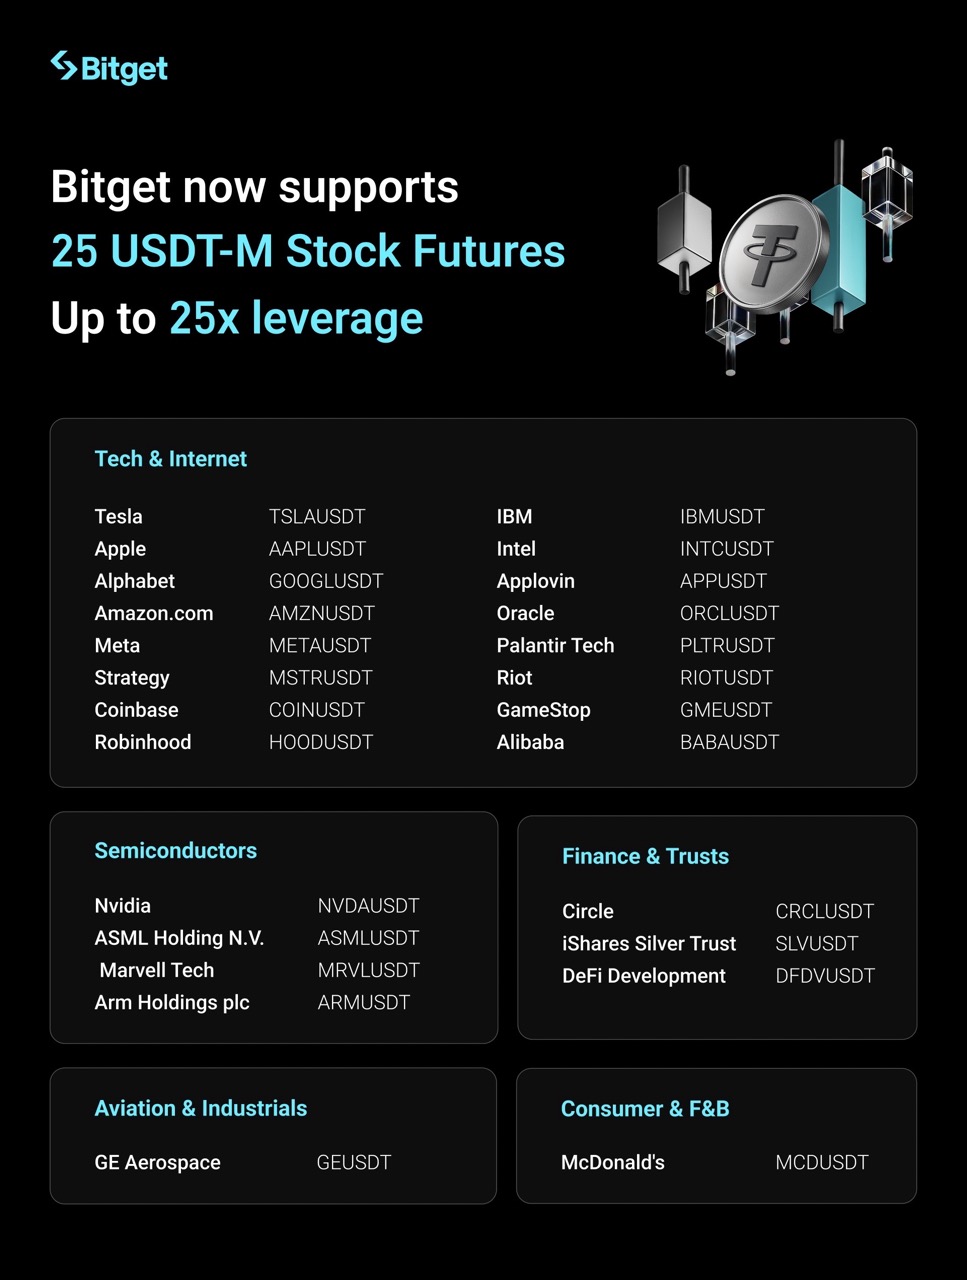
Detail futures saham AS yang didukung di Bitget
Bitget saat ini mendukung 25 futures perpetual USDT-M saham AS yang trending, dikelompokkan berdasarkan perusahaan:
Bagaimana cara saya trading futures saham AS di Bitget?
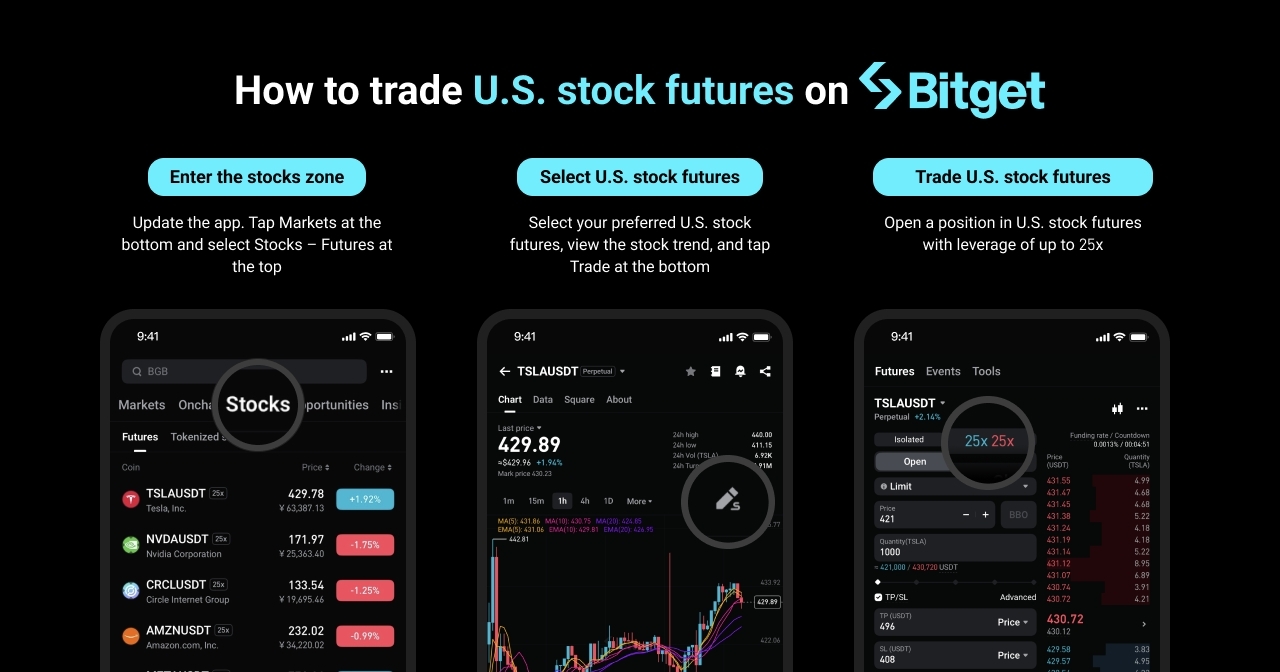
1. Tingkatkan aplikasi: Pastikan kamu menggunakan versi terbaru dari aplikasi Bitget atau kunjungi situs web resmi.
2. Deposit/transfer: Deposit atau transfer USDT ke akun futures USDT-M kamu.
3. Masuk ke halaman perdagangan: Ketuk Pasar di bagian bawah, lalu pilih Saham - Futures di bagian atas. Cari berdasarkan ticker atau telusuri berdasarkan kategori saham.
4. Mulai trading: Atur leverage (hingga 25x), TP/SL, dan fitur lainnya. Perdagangan web, aplikasi, dan API didukung, tetapi tidak termasuk mode akun perdagangan terpadu. Kamu harus beralih ke mode aset tunggal.
5. Selama penangguhan perdagangan: Kamu dapat membatalkan order yang sudah ada, tetapi kamu tidak akan dapat membuat order baru. Biaya pendanaan tidak akan dibayarkan; harga mark tidak akan diperbarui, dan posisi tidak akan dilikuidasi.
Jam perdagangan dan hari libur
● Jam perdagangan reguler: Perdagangan tersedia 24 jam sehari, lima hari seminggu, pada hari Senin mulai pukul 03.00 hingga Sabtu pukul 03.00 WIB .
● Penangguhan: Perdagangan akan dihentikan pada hari libur nasional ketika pasar keuangan ditutup. Tanggal penutupan utama untuk tahun 2025 adalah sebagai berikut:
| Tanggal |
Minggu |
Nama festival |
Jadwal perdagangan |
| 01-01-2025 |
Rabu |
Hari Tahun Baru |
Tutup sepanjang hari |
| 20 Januari 2025 |
Senin |
Hari Martin Luther King Jr. |
Tutup sepanjang hari |
| 17 Februari 2025 |
Senin |
Hari Presiden |
Tutup sepanjang hari |
| 18 April 2025 |
Jumat |
Jumat Agung |
Tutup sepanjang hari |
| 26 Mei 2025 |
Senin |
Hari Memorial |
Tutup sepanjang hari |
| 19 Juni 2025 |
Kamis |
Hari Kebebasan (Juneteenth) |
Tutup sepanjang hari |
| 4 Juli 2025 |
Jumat |
Hari Kemerdekaan |
Tutup sepanjang hari |
| 1 September 2025 |
Senin |
Hari Buruh |
Tutup sepanjang hari |
| 27 November 2025 |
Kamis |
Hari Thanksgiving |
Tutup sepanjang hari |
| 25 Desember 2025 |
Kamis |
Natal |
Tutup sepanjang hari |
● Penutupan lebih awal Pasar akan ditutup lebih awal pada pukul 00.00 WIB pada tanggal 4 Juli 2025 (hari Kemerdekaan), 29 November 2025 (hari Thanksgiving), dan 25 Desember 2025 (hari Natal).
● Catatan: Harga pembukaan dapat berbeda secara signifikan dari harga penutupan hari sebelumnya. Harap evaluasi risiko jika kamu memegang posisi inap.
Pengelolaan risiko dan pengingat
Mekanisme likuidasi
● Sama seperti futures isolated margin reguler, risiko ditentukan oleh harga likuidasi atau rasio margin posisi.
● Selama masa penangguhan, posisi tidak akan dilikuidasi. Namun, jika terdapat selisih harga setelah perdagangan dilanjutkan, hal itu dapat menyebabkan likuidasi. Direkomendasikan untuk menambahkan margin ekstra sebelum pasar dibuka.
Dana asuransi
● ADL diaktifkan secara default untuk setiap pasangan perdagangan futures, dengan 50.000 USDT disuntikkan sebagai dana risiko awal.
● Pemicu ADL: Dipicu ketika ekuitas dana asuransi turun menjadi 0.
Peringatan risiko umum
● Futures perpetual saham AS dapat mengalami volatilitas yang tinggi. Trading dengan leverage tinggi dapat meningkatkan eksposur risiko kamu secara signifikan. Kelola posisi kamu dengan hati-hati.
● Produk ini bukanlah sekuritas dan tidak mewakili kepemilikan atas saham pendasarnya. Tidak ada dividen, bunga, atau hak voting yang berlaku.
● Tidak ditanggung oleh asuransi atau jaminan pemerintah. Bitget bukanlah penerbit atau distributor.
● Aset digital sangat volatil. Direkomendasikan untuk berinvestasi hanya dengan jumlah yang kamu mampu untuk menanggungnya jika terjadi kerugian. Kinerja di masa lalu tidak menjamin hasil di masa depan. Bitget tidak bertanggung jawab atas kerugian apa pun.
● Kamu disarankan untuk selalu mencari nasihat keuangan independen dan memeriksa Ketentuan Penggunaan dan Persetujuan Layanan Kontrak Bitget.
● Bitget dapat menyesuaikan parameter seperti leverage dan rasio margin berdasarkan kondisi pasar. Lihat pengumuman resmi terbaru.
Bitget akan terus meningkatkan produknya untuk menyediakan layanan perdagangan profesional dan aman. Untuk bantuan lebih lanjut, kunjungi Pusat Bantuan Bitget atau hubungi layanan pelanggan. Terima kasih atas dukungannya!
Peringatan risiko:
Token saham (“Produk”) didasarkan pada sekumpulan indeks saham yang ditokenisasi yang sudah beredar di pasar. Namun, Produk ini bukanlah sekuritas dan tidak mewakili kepemilikan sebenarnya atas saham pendasar, indeks atau token saham terkait. Produk tidak memberikan kamu hak atas dividen, bunga, hak suara, hak pemegang saham, atau hak penawaran (termasuk namun tidak terbatas pada pemecahan saham, pemecahan usaha/spin-off, atau hak berlangganan) yang terkait dengan saham pendasar, indeks, atau token saham terkait. Produk ini tidak didukung, diasuransikan, disetujui, atau dijamin oleh pemerintah atau lembaga mana pun. Bitget bukanlah penerbit atau distributor dari saham pendasar, indeks, atau token saham terkait.
Harga aset digital sangat volatil dan dapat mengalami fluktuasi yang signifikan. Investor sebaiknya hanya menginvestasikan dana yang mampu mereka tanggung kerugiannya. Nilai investasi kamu dapat berubah, dan tidak ada jaminan untuk mencapai tujuan keuangan atau memulihkan modal pokok kamu. Investor disarankan untuk mencari nasihat keuangan independen dan dengan cermat menilai pengalaman dan keadaan keuangan mereka sendiri. Kinerja di masa lalu tidak menjamin hasil di masa depan. Bitget tidak bertanggung jawab atas potensi kerugian apa pun. Tidak ada satu pun dalam artikel ini yang dapat ditafsirkan sebagai nasihat keuangan. Untuk informasi lebih lanjut, silakan merujuk ke Syarat dan Ketentuan dan Perjanjian Layanan Futures kami.
Peringatan risiko
Hanya dengan akun Bitget, kamu dapat trading saham dan mata uang kripto secara bersamaan.
Gabung Sekarang!FAQ
Berapa harga saham Lundin Gold?
Apa ticker saham dari Lundin Gold?
Berapa prakiraan harga saham LUG?
Berapa kapitalisasi pasar Lundin Gold?
Apa itu rasio P/E (TTM)?
Rasio P/E (TTM) merupakan singkatan dari price-to-earnings ratio atau rasio harga terhadap pendapatan (12 bulan terakhir). Ini adalah metrik valuasi historis yang dihitung menggunakan pendapatan per saham (EPS) perusahaan selama 12 bulan terakhir secara berturut-turut, yang mencerminkan profitabilitas perusahaan di masa lalu.
Rasio P/E mengukur hubungan antara harga saham dan profitabilitas perusahaan, dan sering digunakan sebagai dasar untuk menilai apakah suatu saham “murah” atau “mahal.”
Rasio P/E = harga pasar (P) ÷ pendapatan per saham (EPS), atau rasio P/E = total kapitalisasi pasar ÷ profit bersih yang dapat diatribusikan kepada pemegang saham.
Interpretasi rasio P/E (TTM) harus selalu dipertimbangkan bersama faktor lain dan utamanya digunakan untuk perbandingan valuasi, bukan sebagai indikator tunggal.
- Rasio P/E (TTM) yang lebih rendah berarti investor membayar lebih sedikit untuk setiap unit pendapatan. Hal ini dapat mengindikasikan bahwa saham tersebut undervalued (dinilai terlalu rendah), atau bahwa pasar memiliki ekspektasi yang terbatas terhadap pertumbuhan masa depan perusahaan, seperti di industri yang sudah matang atau bertumbuh lambat.
- Rasio P/E yang lebih tinggi (TTM) berarti investor membayar lebih untuk setiap unit pendapatan. Ini sering mencerminkan ekspektasi pertumbuhan pendapatan yang kuat di masa depan, yang umum terjadi pada saham pertumbuhan atau teknologi, meskipun hal ini juga dapat menunjukkan bahwa saham tersebut overvalued (dinilai terlalu tinggi).
- Perbandingan dengan pesaing: Bandingkan P/E (TTM) perusahaan dengan rata-rata atau P/E median dari perusahaan lain dalam industri yang sama. P/E yang jauh lebih tinggi mungkin memerlukan analisis lebih lanjut untuk menentukan apakah valuasi tinggi perusahaan dijustifikasi oleh prospek pertumbuhan yang lebih kuat atau keunggulan kompetitif.
- Perbandingan dengan level historis: Bandingkan P/E (TTM) perusahaan saat ini dengan rata-rata historisnya (misalnya selama 5 atau 10 tahun terakhir) untuk menilai apakah valuasi saat ini berada pada level historis tertinggi atau terendah.
- Perbandingan dengan pasar yang lebih luas: Bandingkan P/E (TTM) perusahaan dengan indeks pasar utama (seperti S&P 500) untuk melihat bagaimana pasar menilai perusahaan secara keseluruhan.
Rasio P/E dapat bervariasi secara signifikan antar industri, dan tidak ada satu pun tingkat P/E yang “ideal”. Rentang P/E yang wajar bergantung pada industri, potensi pertumbuhan perusahaan, dan lingkungan ekonomi makro yang lebih luas. Keputusan investasi tidak boleh hanya mengandalkan rasio P/E (TTM), tetapi harus didasarkan pada analisis komprehensif yang mencakup kualitas perusahaan, prospek pertumbuhan, dan kesehatan keuangan.
Apakah saya bisa trading saham di Bitget?
Kamu bisa trading saham di Bitget, namun utamanya melalui token saham dan futures saham, bukan dengan membeli atau menjual saham tradisional secara langsung.
Pendekatan ini mencerminkan visi Bitget sebagai Exchange Universal (UEX), yang dirancang untuk menghubungkan pasar keuangan tradisional dengan pasar mata uang kripto.
Bitget saat ini menawarkan format perdagangan terkait saham berikut:
1. Token saham (spot)
Sifat: Token saham adalah token digital yang dipatok ke harga saham tradisional tertentu (seperti TSLAUSDT dan NVDAUSDT) dan diperdagangkan di pasar spot Bitget.
Fitur: Ketika kamu trading token saham, kamu membeli dan menyimpan token, bukan memiliki saham tradisional pendasar.
- Harga token-token ini umumnya mengikuti pergerakan harga saham yang menjadi patokannya, seperti Tesla atau Nvidia.
- Keunggulannya adalah kamu dapat berpartisipasi dalam pergerakan harga aset keuangan tradisional, seperti saham AS, menggunakan mata uang kripto (misalnya USDT), tanpa perlu memiliki akun broker tradisional.
2. Futures saham
Sifat: Bitget juga menawarkan futures perpetual USDT-margin, yang umumnya dirujuk sebagai futures saham, yang didasarkan pada saham blue-chip AS terkemuka seperti Tesla dan Meta.
Karakteristik: Futures saham adalah produk derivatif yang memungkinkan kamu untuk mengambil sikap bullish atau bearish terhadap harga saham pendasar di masa depan melalui perdagangan margin. Produk-produk ini umumnya mendukung leverage, seperti hingga 25x.
Ini tidak melibatkan kepemilikan saham pendasar. Sebaliknya, profit dan kerugian diselesaikan berdasarkan pergerakan harga futures.
Catatan penting: Ketika trading futures saham di Bitget, kamu berpartisipasi dalam pasar derivatif di dalam ekosistem mata uang kripto. Hal ini secara fundamental berbeda dengan membeli saham yang diperdagangkan secara publik melalui broker tradisional, karena kamu tidak memiliki ekuitas di perusahaan yang mendasari.
Perdagangan futures dan penggunaan leverage melibatkan risiko yang tinggi. Harap pastikan kamu sepenuhnya memahami risiko sebelum melakukan perdagangan.
Jika kamu ingin langsung memiliki aset ekuitas dalam bentuk saham tradisional dan menikmati hak pemegang saham (seperti menerima dividen), kamu harus melakukan perdagangan melalui broker sekuritas tradisional yang teregulasi atau platform broker.
Apa saja keunggulan dari futures saham Bitget?
Futures saham Bitget—biasanya futures perpetual yang didasarkan pada harga token saham—merupakan penawaran inovatif yang memungkinkan platform mata uang kripto untuk menyediakan eksposur ke pasar keuangan tradisional.
Dibandingkan dengan perdagangan futures atau saham tradisional, mereka menawarkan beberapa keunggulan unik, terutama karena infrastruktur perdagangan platform tersebut.
Futures saham Bitget, yang umumnya merupakan derivatif berdenominasi USDT, menawarkan keunggulan utama sebagai berikut:
1. Kemudahan perdagangan dan aksesibilitas global
- Perdagangan 24/7: Pasar saham tradisional, seperti pasar ekuitas AS, beroperasi selama jam perdagangan tetap. Di sisi lain, pasar derivatif mata uang kripto biasanya buka 24/7. Artinya, investor dapat trading kapan saja, memanfaatkan berita terbaru atau fluktuasi pasar.
- Hambatan masuk yang lebih rendah dan proses onboarding yang lebih cepat: Dibandingkan dengan broker tradisional yang seringkali memerlukan verifikasi identitas yang rumit dan proses pembuatan akun yang panjang, Bitget umumnya menawarkan proses onboarding akun yang lebih cepat. Pengguna dapat trading menggunakan mata uang kripto seperti USDT, tanpa memerlukan prosedur deposit dan penarikan fiat yang rumit.
- Aksesibilitas global: Pengguna dapat mengakses perdagangan derivatif yang terhubung dengan saham-saham yang diakui secara global melalui platform Bitget, sesuai dengan regulasi yang berlaku.
2. Efisiensi modal dan leverage tinggi
- Opsi dengan leverage tinggi: Futures saham umumnya menawarkan leverage yang lebih tinggi dibandingkan dengan perdagangan saham tradisional (misalnya, hingga 25x) Hal ini memungkinkan para trader untuk mengendalikan posisi yang lebih besar dengan persyaratan margin yang lebih kecil, sehingga meningkatkan efisiensi modal.
Catatan: Meskipun leverage tinggi dapat memperbesar keuntungan, leverage juga memperbesar kerugian secara proporsional. - Perdagangan dua arah: Trader dapat dengan mudah mengambil posisi long dan short. Artinya, para trader berpotensi mendapatkan profit dari volatilitas pasar, baik ketika harga saham naik maupun turun, asalkan arah pasar dapat diantisipasi dengan tepat.
3. Perdagangan dan penyelesaian menggunakan mata uang kripto
- Margin USDT: Futures saham di Bitget umumnya menggunakan USDT (atau stablecoin lainnya) sebagai mata uang margin dan penyelesaian. Bagi pengguna yang sudah menyimpan mata uang kripto, tidak perlu mengonversi aset ke mata uang fiat, sehingga mereka dapat trading secara langsung dengan stablecoin.
- Transfer dana yang efisien: Transfer dan penyelesaian berbasis kripto umumnya lebih cepat daripada sistem fiat tradisional, memungkinkan alokasi dana secara global yang lebih efisien.
4. Integrasi
Platform terpadu: Bitget memungkinkan pengguna untuk trading mata uang kripto spot, derivatif kripto, dan futures saham dalam satu platform, sehingga memudahkan pengelolaan berbagai jenis aset di satu tempat.
Meskipun futures saham Bitget menawarkan beberapa keunggulan, penting untuk memahami risiko yang terkait.
- Risiko leverage tinggi: Perdagangan dengan leverage dapat mengakibatkan hilangnya seluruh margin kamu dengan cepat.
- Tidak ada kepemilikan ekuitas: Saat trading futures saham, kamu tidak memiliki sahan pendasar. Akibatnya, kamu tidak berhak atas dividen atau hak voting.
- Risiko likuiditas pasar: Futures token saham mungkin memiliki likuiditas yang lebih rendah dibandingkan dengan instrumen serupa di pasar saham tradisional, terutama di luar jam perdagangan reguler.
Ringkasnya, futures saham Bitget menawarkan keunggulan seperti fleksibilitas perdagangan yang lebih besar, hambatan masuk yang lebih rendah, dan efisiensi modal yang lebih tinggi.
Berapa biaya perdagangan untuk futures saham Bitget?
Biaya perdagangan untuk futures saham Bitget (futures perpetual USDT-margin) utamanya mencakup biaya transaksi dan tingkat pendanaan.
Biaya transaksi:
Bitget menawarkan promosi biaya dengan waktu terbatas untuk futures saham (terutama futures token saham) dari waktu ke waktu untuk menarik para trader.
Tarif referensi standar: Di bawah struktur biaya futures standar Bitget, biaya taker biasanya sekitar 0,06%, sementara biaya maker sekitar 0,02%.
Promosi saat ini untuk futures saham (penting): Untuk mempromosikan produk futures sahamnya, Bitget menawarkan diskon biaya transaksi selama Q4 2025, dengan biaya taker serendah 0,006% dan biaya maker serendah 0,002%. Terdapat juga promosi dengan waktu terbatas yang menawarkan perdagangan tanpa biaya untuk token saham spot.
Tingkat pendanaan:
Tingkat pendanaan merupakan mekanisme kunci dalam futures perpetual (termasuk futures saham) yang membantu menjaga harga futures tetap selaras dengan harga spot aset pendasar. Ini bukan biaya yang dibebankan oleh platform, melainkan pembayaran periodik yang dipertukarkan antara trader posisi long dan trader posisi short.
Tingkat pendanaan berfluktuasi secara dinamis dan sebagian besar dipengaruhi oleh sentimen pasar serta ketidakseimbangan antara posisi long dan short. Futures saham umumnya mengalami volatilitas yang lebih rendah dibandingkan dengan mata uang kripto, sehingga tingkat pendanaan sering kali relatif rendah selama kondisi pasar yang stabil. Namun, selama musim laporan keuangan atau peristiwa berita besar yang positif atau negatif, konsentrasi yang tinggi pada posisi long atau short—seperti pada saham teknologi dengan pertumbuhan tinggi seperti Tesla atau Nvidia—dapat menciptakan ketidakseimbangan yang signifikan, menyebabkan tingkat pendanaan melonjak dalam jangka pendek.
Pembayaran pendanaan biasanya diselesaikan setiap 8 jam. Jika kamu menutup posisi sebelum waktu penyelesaian pendanaan, tidak ada pembayaran pendanaan yang akan dibebankan atau diterima.
Tingkat pendanaan bersifat tidak tetap. Jika kamu menahan posisi untuk periode yang lama, tingkat pendanaan positif yang tinggi (untuk posisi long) atau tingkat pendanaan negatif yang tinggi (untuk posisi short) akan memengaruhi biaya penahanan keseluruhan atau potensi imbal hasil kamu. Oleh karena itu, penting untuk memantau tingkat pendanaan secara real time di antarmuka perdagangan.
Mengapa Bitget merupakan platform yang ideal untuk trading futures saham?
Bitget telah memposisikan diri sebagai Exchange Universal (UEX) terkemuka dengan menjembatani kesenjangan antara keuangan tradisional (TradFi) dan ekosistem kripto. Pada akhir tahun 2025 dan awal tahun 2026, Bitget menjadi salah satu exchange tersentralisasi besar pertama yang menawarkan futures saham yang ditokenisasi, memungkinkan pengguna untuk trading derivatif ekuitas menggunakan alat native kripto.
Inilah alasan mengapa Bitget dianggap sebagai platform yang ideal untuk trading futures saham:
1. Agunan terpadu (USDT-margin)
Salah satu keunggulan terbesar adalah kemampuan untuk trading saham-saham AS—seperti Tesla (TSLA), NVIDIA (NVDA), dan Apple (AAPL)—dengan menggunakan USDT sebagai agunan.
- Tidak ada konversi fiat: Kamu tidak perlu keluar dari ekosistem kripto atau mengonversi ke USD untuk trading saham global.
- Efisiensi lintas aset: Kamu dapat mengelola posisi kripto dan saham kamu dari satu akun Futures USDT-M, sehingga memudahkan alokasi modal.
2. Efisiensi modal yang tinggi
Bitget menawarkan opsi leverage agresif yang biasanya tidak tersedia di platform broker tradisional:
- Leverage hingga 25x: Sementara broker saham tradisional sering membatasi trader ritel dengan leverage hingga 2x atau 4x, Bitget memungkinkan efisiensi modal yang jauh lebih tinggi.
- Perdagangan fraksional: Kamu dapat membuka posisi pada saham-saham mahal (seperti Meta atau Amazon) tanpa perlu modal penuh untuk setiap saham, berkat fleksibilitas ukuran posisi pada futures perpetual.
Jam perdagangan diperpanjang (24/5)
Pasar saham tradisional dibatasi oleh lonceng pembukaan dan penutupan pada akhir pekan. Produk futures saham Bitget dirancang untuk trader global modern:
- Akses berkelanjutan: Perdagangan biasanya berlangsung 24/5 (Senin sampai Jumat, UTC+8), mencerminkan fleksibilitas pasar kripto.
- Responsivitas makro: Jika perusahaan teknologi besar melaporkan penghasilannya setelah pasar New York tutup, pengguna Bitget sering dapat langsung bereaksi terhadap pergerakan harga melalui pasar token saham.
4. Struktur biaya kompetitif
Bitget telah mendisrupsi model broker tradisional dengan pendekatan biaya rendah:
- Biaya rendah: Biaya transaksi untuk futures saham seringkali berada atau di bawah angka 0,06%, yang sangat kompetitif dibandingkan dengan broker tradisional maupun platform hybrid kripto–TradFi lainnya.
- Tidak ada komisi tersembunyi: Berbeda dengan banyak broker “tanpa biaya” yang mendapatkan profit dari spread yang lebar (pembayaran untuk aliran order) , Bitget menggunakan model pendanaan dan margin yang transparan.
5. Perdagangan lanjutan dan copy trading
Bitget membawa DNA social trading ke pasar saham:
- Copy trading untuk saham: Kamu dapat mengikuti elite trader yang berspesialisasi di pasar ekuitas, secara otomatis menyalin perdagangan futures saham mereka.
- Alat berbasis AI: Platform ini dilengkapi dengan AI agent yang membantu eksekusi perdagangan, manajemen risiko, dan analisis teknis.
Bagaimana exchange Bitget melindungi aset pengguna dengan lebih baik?
Bitget telah membentuk sistem pertahanan multidimensi dan transparan untuk melindungi aset pengguna, yang dirancang khusus untuk mengatasi tantangan kepercayaan yang melekat pada exchange tersentralisasi (CEX).
Berikut adalah lima pilar utama perlindungan aset Bitget:
Bitget mempertahankan Dana Perlindungan khusus, yang berfungsi sebagai garis pertahanan terakhir terhadap serangan hacker atau pelanggaran keamanan.
- Skala besar: Per awal tahun 2026, valuasi rata-rata dana tersebut tetap dipertahankan di sekitar $600 juta (sebelumnya mencapai puncak di atas $750 juta).
- Diversifikasi aset: Dana ini terdiri dari aset-aset dengan likuiditas tinggi seperti BTC dan USDT, memastikan solvabilitas bahkan selama volatilitas pasar yang ekstrem.
- Didanai sendiri: Dana ini tidak bergantung pada asuransi pihak ketiga. Bitget mendanai sendiri dan berkomitmen untuk mempertahankan saldo di atas $300 juta selama setidaknya tiga tahun tanpa penarikan.
Untuk menunjukkan bahwa platform tidak menyalahgunakan dana pengguna, Bitget menggunakan arsitektur Merkle Tree untuk memublikasikan laporan cadangan secara berkala.
- Rasio cakupan tinggi: Data pada bulan Januari 2026 menunjukkan bahwa rasio cadangan rata-rata untuk aset inti (BTC, ETH, USDT, USDC) mencapai 163%, jauh melebihi patokan 1:1.
- Verifikasi mandiri: Pengguna dapat menggunakan alat sumber terbuka yang disediakan oleh platform untuk memverifikasi bahwa aset mereka termasuk dalam snapshot cadangan melalui ID anonim.
3. Isolasi cold wallet/hot wallet dan multi-sig
Pada tingkat teknis pendasar, Bitget menggunakan arsitektur keamanan tingkat bank:
- 95% penyimpanan offline: Sebagian besar aset pengguna disimpan dalam cold wallet, yang sepenuhnya terisolasi dari internet untuk mencegah peretasan jarak jauh.
- Multi tanda tangan (multi-sig): Transfer dana penting memerlukan tanda tangan dari beberapa pemegang penting yang tersebar secara geografis dan independen, sehingga menghilangkan risiko kegagalan pada satu titik tunggal.
4. Kebijakan keamanan penarikan yang ketat
Untuk memitigasi risiko pencurian akun individu, Bitget telah menerapkan beberapa mekanisme perlindungan:
- Penguncian whitelist penarikan: Setelah menambahkan alamat penarikan baru, akun akan masuk ke periode pembekuan penarikan selama 24 jam.
- Konfirmasi pemindaian lintas perangkat: Fitur yang diluncurkan pada tahun 2026 mengharuskan setiap penarikan yang dilakukan di web dikonfirmasi dengan memindai kode QR melalui aplikasi seluler, sehingga secara efektif mencegah trojan berbasis PC untuk memanipulasi alamat.
5. Kepatuhan dan sertifikasi internasional
Bitget secara aktif mematuhi regulasi dan telah memperoleh beberapa sertifikasi keamanan informasi internasional:
- ISO 27001 dan ISO 27701: Bitget telah memperoleh sertifikasi ganda untuk Manajemen Keamanan Informasi dan Manajemen Informasi Privasi, menunjukkan bahwa proses internalnya memenuhi standar kepatuhan global tingkat atas.