

- XRP price drops ~6% to ~$2.04, testing critical $2 psychological support level
- Price trades below key EMAs; RSI nears oversold but MACD remains bearish
- Holding $2 support crucial on Apr 1 to avoid potential drop towards $1.95 next
XRP faced significant downward pressure as March closed. The cryptocurrency experienced a notable decline in the preceding day. Its price fell to around $2.04 , marking a 6.4% drop over the past 24 hours according to CoinMarketCap data.
Despite minor bullish corrections during that period, the overall near-term trend remains bearish. Trading volume also decreased 4.2% recently, reinforcing signs of weakening momentum for the asset.
This combination suggests buyer interest is currently low, with the market struggling to maintain higher price levels. As April begins (specifically looking towards April 1st), traders will closely watch key support and resistance levels to gauge XRP’s next likely price direction.
XRP Faces Resistance as Selling Pressure Intensifies
XRP encountered strong selling resistance near the $2.17-$2.18 area recently. This zone marked the day’s high before the price declined again, acting as a critical supply zone where selling activity increased and pushed prices lower.
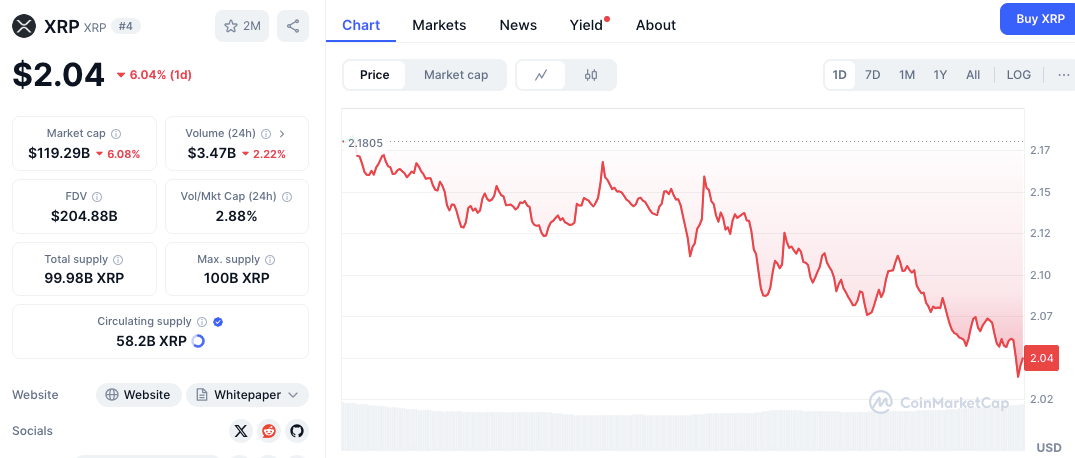 Source: CoinMarketCap
Another notable short-term resistance zone emerged between $2.12 and $2.13, where multiple price rejections occurred during intra-day trading. These levels indicate significant overhead resistance currently exists. This makes it difficult for XRP to regain bullish momentum quickly. If buyers fail to push convincingly past these immediate barriers, the downward trend could persist into April 1st.
Related: The XRP Paradox: Why Holder Fatigue Could Be a Bullish Contrarian Indicator
Key Support Levels Could Determine XRP’s Next Move
XRP currently tests the $2.04 support level. This area is now an immediate zone of interest heading into April 1st. If this level holds firm against selling pressure, the price could see a minor technical bounce.
However, if the prevailing bearish momentum continues through the start of the month, XRP may drop toward the important psychological support level at $2.00. Round numbers like $2.00 often provide significant support or resistance due to concentrated market orders around them.
A confirmed break below the $2.00 mark could then push XRP toward the next technical support region identified near $1.95. Such a move would further strengthen the current bearish sentiment surrounding the asset. Market participants will monitor these support levels closely on April 1st for signs of either a potential trend reversal (bounce) or confirmation of deeper declines.
Technical Indicators Point to Continued Bearish Momentum
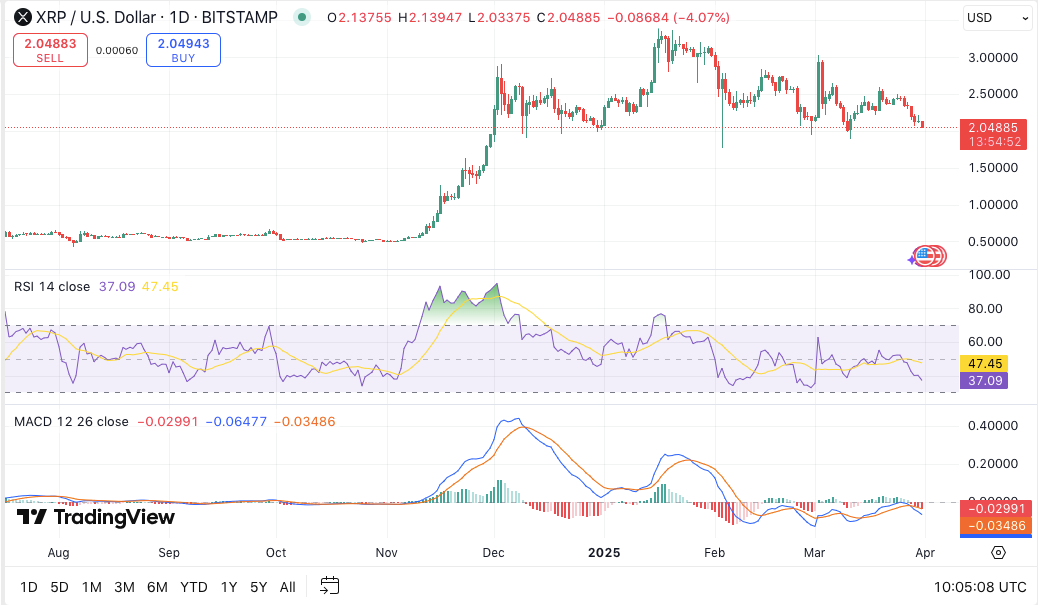 XRP/USD daily price chart, Source: TradingView
The Relative Strength Index (RSI) for XRP currently stands near 36.68 on the daily chart. This reading approaches technically oversold territory (typically below 30). While extremely low RSI levels can sometimes precede bounces if buying interest returns, the RSI trend itself remains downward for now, indicating weak underlying price momentum.
Related: XRP’s Early Pullback After Lawsuit’s End Leaves Users Disappointed
Additionally, the Moving Average Convergence Divergence (MACD) indicator clearly shows a bearish crossover, with the MACD line itself below the signal line. Its histogram also displays increasing negative (red) bars, signifying growing bearish momentum over recent sessions.
These combined indicators suggest downward price pressure may persist for XRP into early April unless a strong catalyst or shift in buying activity occurs soon.
Disclaimer: The information presented in this article is for informational and educational purposes only. The article does not constitute financial advice or advice of any kind. Coin Edition is not responsible for any losses incurred as a result of the utilization of content, products, or services mentioned. Readers are advised to exercise caution before taking any action related to the company.