The cryptocurrency market has seen a notable drop in several digital assets in January, with Inscription tokens (aka BRC-20 tokens ) like ORDI and SATS among the most affected.
Why are Bitcoin Ordinal Inscription tokens ORDI, SATS crashing?
By: Yashu Gola
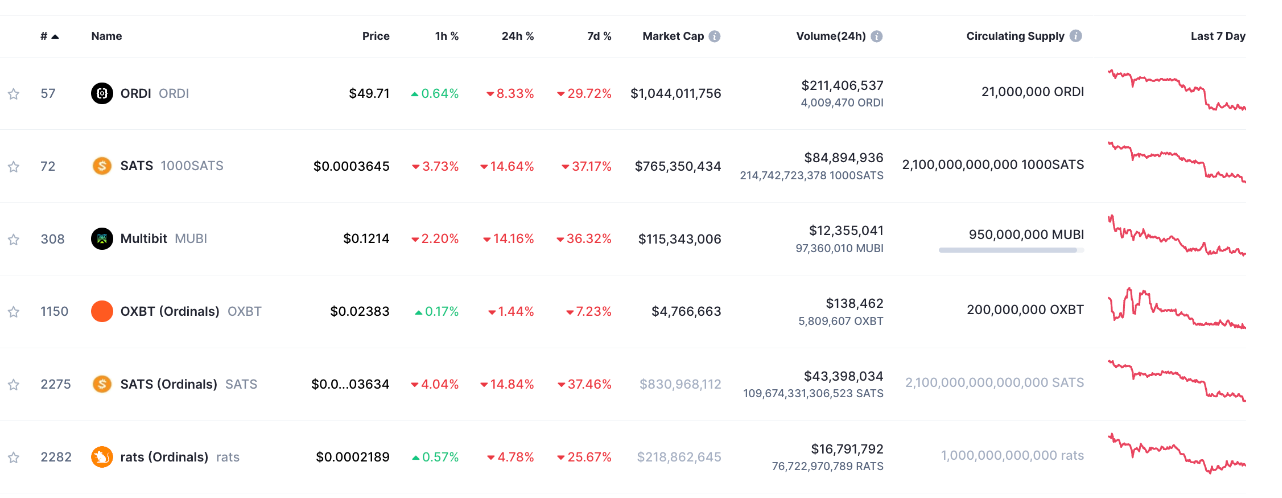
Inscription tokens' performance. Source: CoinMarketCap ![]() ORDI, SATS, BTC, and crypto market's daily performance comparison chart. Source: TradingView
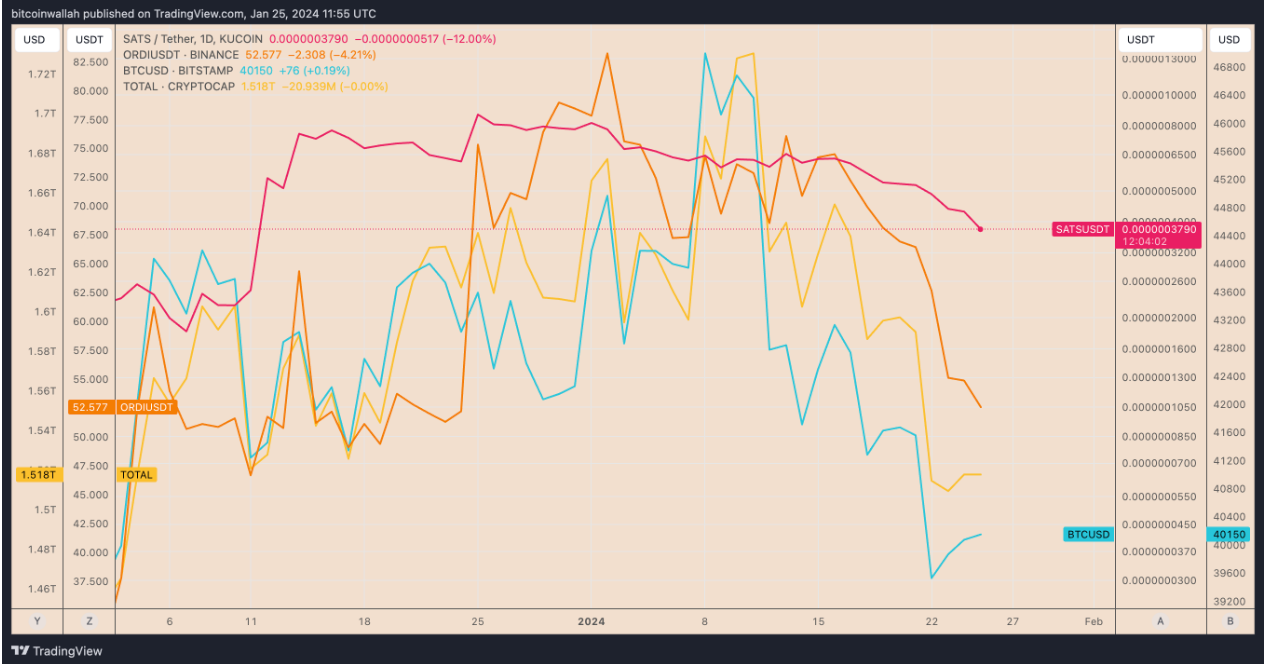
ORDI, SATS, BTC, and crypto market's daily performance comparison chart. Source: TradingView ![]() ORDI/USDT and BTC/USDT daily correlation coefficient performance. Source: TradingView
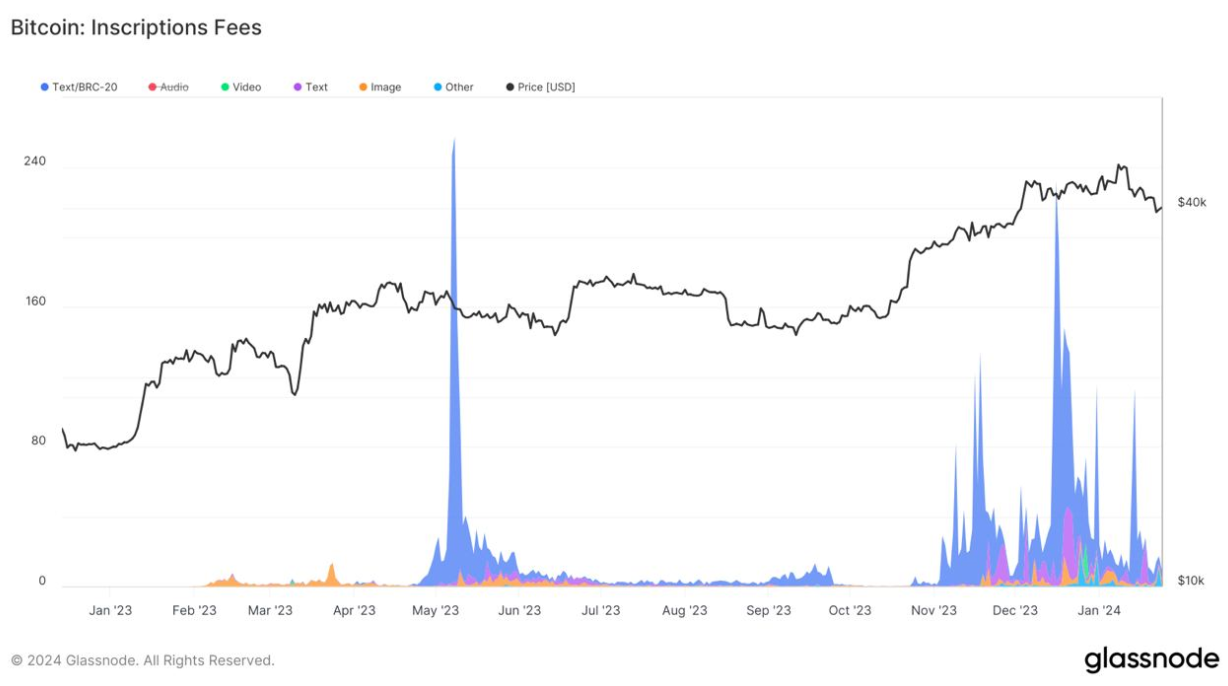
ORDI/USDT and BTC/USDT daily correlation coefficient performance. Source: TradingView ![]() Bitcoin inscription fees. Source: Glassnode
Bitcoin inscription fees. Source: Glassnode
![]() ORDI/USDT daily price chart. Source: TradingView
ORDI/USDT daily price chart. Source: TradingView
The reasons behind the underperformance of these unique tokens include several other important factors in addition to Bitcoin's ( BTC ) recent price fluctuations.
Bitcoin ETF "sell the news" event
Notably, the price of ORDI and SATS have fallen by approximately 34.50% and 50%, respectively, so far in 2024.
The decline has appeared primarily due to a mounting " sell-the-news " sentiment across the crypto market led by Bitcoin. As of Jan. 25, the correlation coefficient between ORDI and BTC was 0.66; it has remained positive throughout recent history.
Furthermore, this bearish momentum has aligned with a noticeable decrease in inscription fees, and Bitcoin block size share, highlighting a diminishing demand for Bitcoin ordinals.
The price movements of inscription tokens tend to closely align with BTC itself, largely because Bitcoin Ordinals uses Bitcoin's blockchain.
ORDI, for example, involves inscribing data directly onto the Bitcoin blockchain, creating a unique form of digital artifact that exists within Bitcoin's transaction outputs.
Technical conditions
In addition to broader market trends, bearish divergence signals were key in recent ORDI and SATS price drops.
For instance, the ORDI/USDT daily chart exhibited a classic bearish divergence pattern between Dec. 5, 2023, and Jan. 2, 2024. Simply put, ORDI's price was forming higher highs but its relative strength index (RSI) was making lower highs.
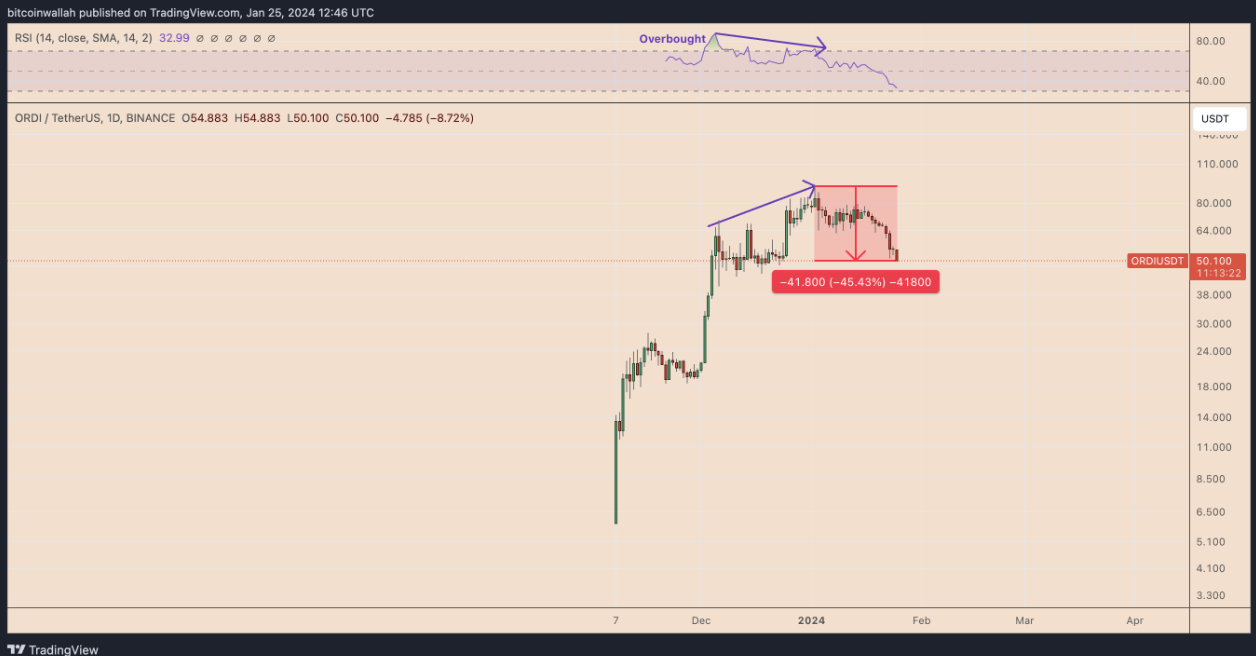
The following 45% pullback was consistent with the bearish divergence signal, where the discrepancy between the RSI and the price action precedes a price correction.
Similarly, SATS's price retreated by over 60% after signaling bearish divergence between its rising prices and falling RSI.
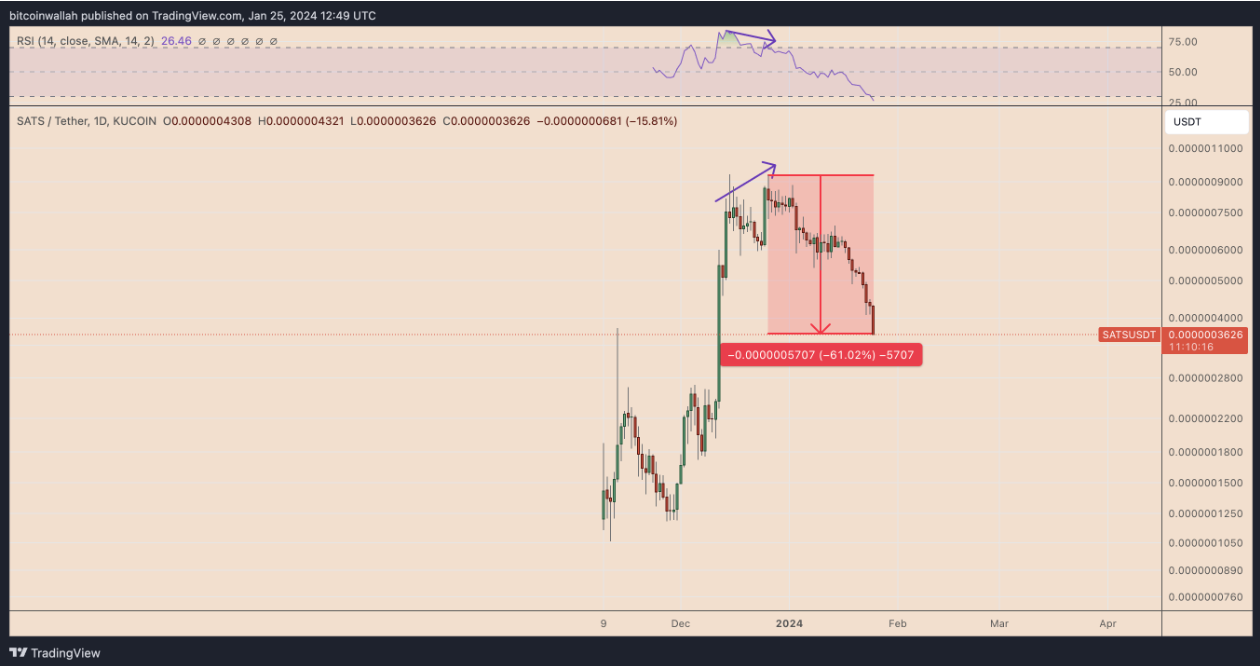
SATS/USDT daily price chart. Source: TradingView ![]() ORDI/USDT daily price chart. Source: TradingView
ORDI/USDT daily price chart. Source: TradingView ![]() SATS/USDT daily price chart. Source: TradingView
SATS/USDT daily price chart. Source: TradingView
Overall, the bearish divergence on the ORDI and SATS chart warranted attention from traders, as it indicated a potential trend reversal or at least a pause in the prevailing uptrend.
ORDI, SATS price analysis
From a technical standpoint, ORDI has more room to decline in the coming days or weeks.
Notably, the cryptocurrency has been undergoing an ascending triangle reversal breakdown. This refers to a situation where an ascending triangle pattern fails to act as a continuation pattern and instead leads to a trend reversal.
ORDI's breakdown target comes to be around $38.50 by February, measured after calculating the maximum distance between the triangle's upper and lower trendline and subtracting the outcome from the breakdown point, as shown above.
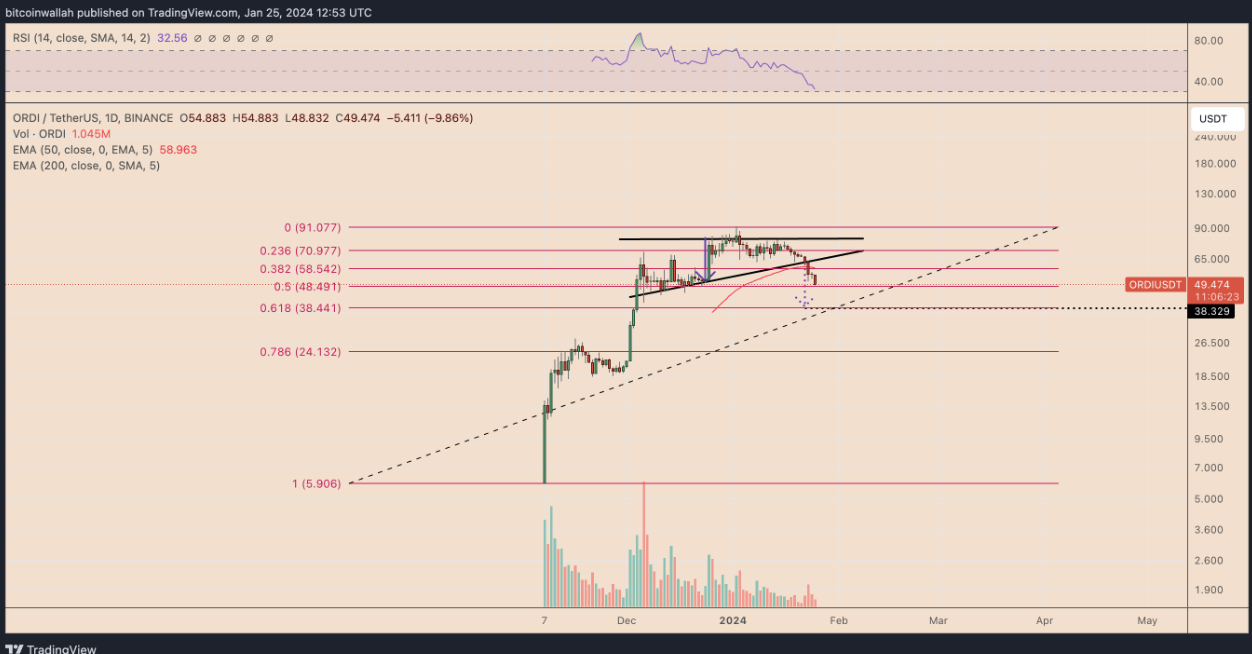
Interestingly, the $38.50 target coincides with the 0.618 Fibonacci retracement line.
On the other hand, SATS has dropped toward its resistance-turned-support level of $0.00000036. Simultaneously, its RSI has dropped below 30, an oversold territory. Both indicators hint at a potential rebound move toward 0.00000043 by February.
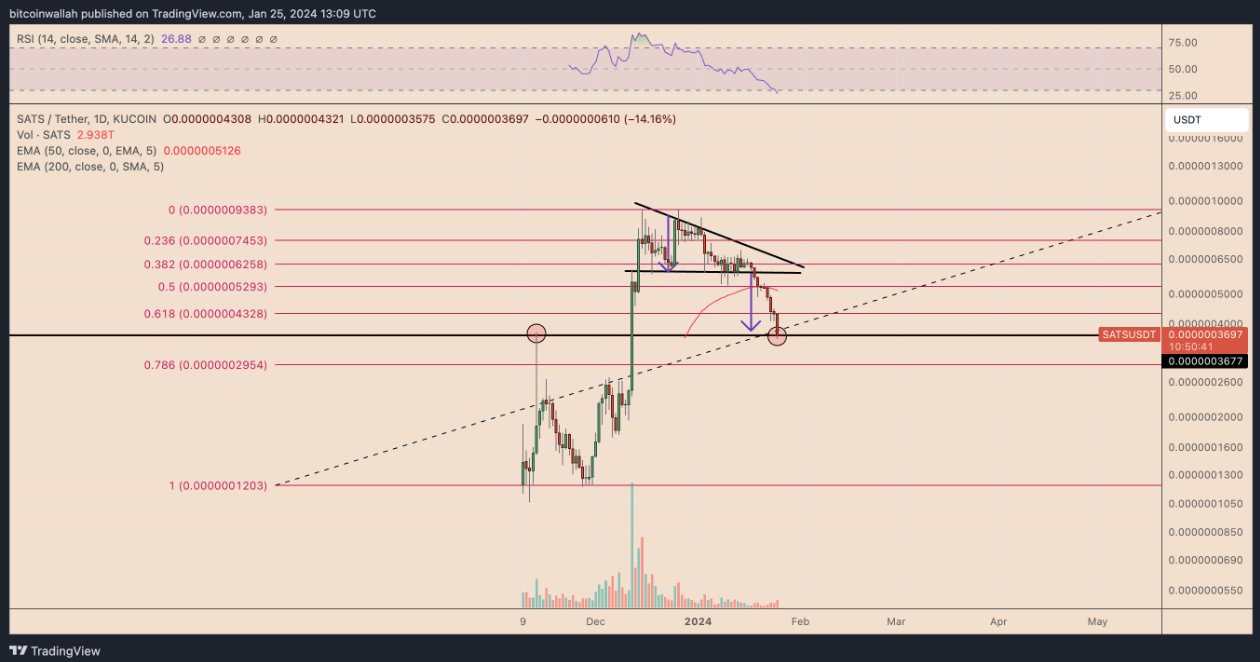
Conversely, a break below the $0.00000036-support risks crashing SATS price toward its 0.786 Fib line of $0.0000029.
This article does not contain investment advice or recommendations. Every investment and trading move involves risk, and readers should conduct their own research when making a decision.
Disclaimer: The content of this article solely reflects the author's opinion and does not represent the platform in any capacity. This article is not intended to serve as a reference for making investment decisions.
Lock now!
You may also like
Crypto prices
MoreBecome a trader now?A welcome pack worth 6200 USDT for new users!
Sign up now