- XRP breaks 6-year downtrend vs ETH, signaling potential bullish reversal on monthly chart.
- Elliott Wave and Ichimoku Cloud hint at upcoming bullish momentum for XRP over Ethereum.
- Recent price action shows steady XRP gains, potentially outpacing ETH in near future.
Dark Defender, a crypto analyst, recently highlighted a significant development in the crypto market on his X account. He noted the potential for XRP to outperform Ethereum (ETH) after six years.
Breaking a Long-Term Downtrend: The XRP/ETH Monthly Chart
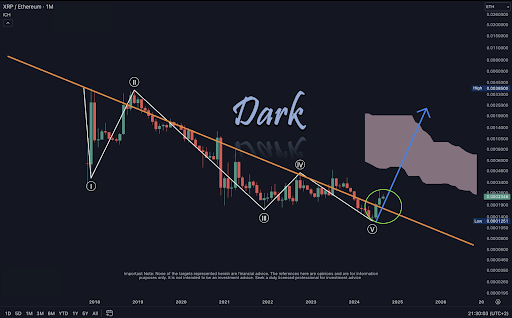
The monthly trading chart for the XRP/Ethereum (XRP/ETH) pair displays a technical formation. Since 2018, XRP has been continuously declining against Ethereum, indicated by a descending orange trendline on the chart. This trendline has acted as a steady resistance level, pushing the trading pair lower over the years.
Recently, XRP broke above this bear market line, an event often seen by analysts as a bullish signal. This breakout, marked by a green circle on the chart, suggests a potential end to the long-standing bearish trend for XRP relative to ETH.
 Source: Dark Defender
 The chart also features an Elliott Wave pattern, consisting of five distinct waves labeled I through V. This pattern suggests that XRP has completed a long corrective wave cycle against Ethereum.
Moreover, the Elliott Wave Theory argues that market prices move in predictable patterns based on investor psychology. The conclusion of a corrective cycle often follows a new breakout wave, which could indicate an upcoming upward movement for XRP against ETH.
Read also: XRP Price Surges on Grayscale Trust News, Ripple CEO Predicts Growth
Adding to the bullish indicators, the chart includes the Ichimoku Cloud, a technical analysis tool used to identify support and resistance levels and momentum. The projected cloud on the chart shows potential areas where XRP might encounter resistance or support.
The breakout above the downtrend line and a favorable position relative to the Ichimoku Cloud suggests increased bullish momentum for XRP.
Recent Price Movements Reflect Market Dynamics
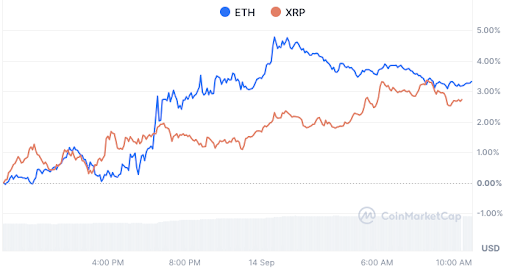
An analysis of recent price changes for ETH and XRP shows that both cryptocurrencies are on an upward trend. Around 8:00 PM, Ethereum experienced a sharp rise, peaking at just over 4% before gradually decreasing.
 ETH vs. XRP Performance: Source: CoinMarketCap
 Additionally, XRP followed a steadier upward trajectory, peaking at approximately 3.5% before slightly declining. This gradual rise could suggest consistent buying interest or a less reactive market. By 10:00 AM, both assets had begun to stabilize, with ETH holding above a 3% gain and XRP slightly above 2%.
Disclaimer: The information presented in this article is for informational and educational purposes only. The article does not constitute financial advice or advice of any kind. Coin Edition is not responsible for any losses incurred as a result of the utilization of content, products, or services mentioned. Readers are advised to exercise caution before taking any action related to the company.