Bitget App
Trade smarter
Open
HomepageSign up
Bitget>
News>
Bitcoin September Surge Mirrors 2020 Bull Run: Analysts

Bitcoin September Surge Mirrors 2020 Bull Run: Analysts

Coinedition2024/09/22 16:00
By: Parth Dubey
BTC-0.14%XOLDTOKEN0.00%REKT0.00%
  • Bitcoin has skyrocketed more than 9% in the past week. 
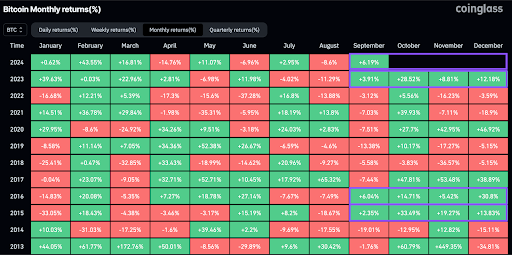
  • Whenever September is green, Q4 will be green, said Lark Davis. 
  • In the 2020 cycle, Bitcoin turned bullish 161 days after the halving.

Bitcoin’s dominance in the digital asset market remained unchallenged as it surged massively since the start of September, even with a few dips along the way. The cryptocurrency is back at the $64,000 mark, and short-term gains look promising. So much so, analysts are even drawing comparisons to the 2020 bull run.

Lark Davis, a well-known YouTuber and crypto analyst, tweeted , “Whenever September is green, Q4 has been extremely bullish for Bitcoin.” He included a chart showing Bitcoin’s past performance in September and Q4, suggesting good times are ahead.

Bitcoin September Surge Mirrors 2020 Bull Run: Analysts image 0 Bitcoin September Surge Mirrors 2020 Bull Run: Analysts image 1

And in another X post , Rekt Capital pointed out that it has been 161 days since the Bitcoin halving. He reminded followers that during the 2020 bull run, BTC saw a massive surge 161 days after the halving, hitting an all-time high of $69,000 in November 2021.

Read also: Government Bitcoin Rankings: US Tops List, Bhutan and El Salvador Active

In the current cycle, Bitcoin made its all-time high at $73,750 in March following the approval of spot Bitcoin exchange-traded funds (ETFs) in the United States in January. According to the data from CoinMarketCap, BTC is trading at $64,022.38, up 1.44% in the past 24 hours, 9.52% in the past week, and 0.04% in the last 30 days. 

Bitcoin Price Analysis Points to Further Gains

The Bitcoin price analysis shows immense bullish potential for the cryptocurrency amid a skyrocketing market. If the leading digital asset is successful in holding above $64,000, there is a strong possibility of higher highs in the near future. 

The chart below shows Bitcoin has formed seven consecutive bullish candles, and buying volumes are increasing. This suggests the rally could continue in the short term.

Bitcoin September Surge Mirrors 2020 Bull Run: Analysts image 2 Bitcoin September Surge Mirrors 2020 Bull Run: Analysts image 3

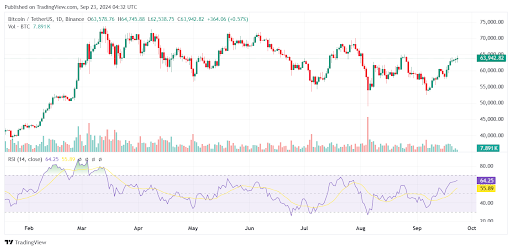
The Relative Strength Index (RSI) reads a value of 64.25 which means that the bulls are overall in control of the Bitcoin price action and the gradient of the line suggests that higher prices are possible as well. 

Disclaimer: The information presented in this article is for informational and educational purposes only. The article does not constitute financial advice or advice of any kind. Coin Edition is not responsible for any losses incurred as a result of the utilization of content, products, or services mentioned. Readers are advised to exercise caution before taking any action related to the company.

Disclaimer: The content of this article solely reflects the author's opinion and does not represent the platform in any capacity. This article is not intended to serve as a reference for making investment decisions.
PoolX: Earn new token airdrops
Lock your assets and earn 10%+ APR
Lock now!

You may also like

New spot margin trading pair — HOLO/USDT!
Bitget Announcement2025/09/12 07:46
FUN drops by 32.34% within 24 hours as it faces a steep short-term downturn

- FUN plunged 32.34% in 24 hours to $0.008938, marking a 541.8% monthly loss amid prolonged bearish trends. - Technical breakdowns, elevated selling pressure, and forced liquidations highlight deteriorating market sentiment and risk-off behavior. - Analysts identify key support below $0.0080 as critical, with bearish momentum confirmed by RSI (<30) and MACD indicators. - A trend-following backtest strategy proposes short positions based on technical signals to capitalize on extended downward trajectories.

Bitget-RWA2025/09/12 06:14
OPEN has dropped by 189.51% within 24 hours during a significant market pullback

- OPEN's price plummeted 189.51% in 24 hours to $0.8907, marking its largest intraday decline in history. - The token fell 3793.63% over 7 days, matching identical monthly and yearly declines, signaling severe bearish momentum. - Technical analysts cite broken support levels and lack of bullish catalysts as key drivers of the sustained sell-off. - Absence of stabilizing volume or reversal patterns leaves the market vulnerable to further downward pressure.

Bitget-RWA2025/09/12 06:14
New spot margin trading pair — LINEA/USDT!
Bitget Announcement2025/09/11 10:04

Trending news

More
1
New spot margin trading pair — HOLO/USDT!
2
FUN drops by 32.34% within 24 hours as it faces a steep short-term downturn

Crypto prices

More
Bitcoin
Bitcoin
BTC
$115,965.63
-0.16%
Ethereum
Ethereum
ETH
$4,658.42
+0.17%
XRP
XRP
XRP
$3.12
+0.74%
Tether USDt
Tether USDt
USDT
$1
-0.03%
Solana
Solana
SOL
$239.94
+0.11%
BNB
BNB
BNB
$930.47
+0.69%
USDC
USDC
USDC
$0.9997
-0.01%
Dogecoin
Dogecoin
DOGE
$0.2874
+5.90%
Cardano
Cardano
ADA
$0.9305
+3.06%
TRON
TRON
TRX
$0.3499
-0.20%
How to sell PI
Bitget lists PI – Buy or sell PI quickly on Bitget!
Trade now
Become a trader now?A welcome pack worth 6200 USDT for new users!
Sign up now
Trade smarter