These Metrics Show Ripple (XRP) Price Could Reach Its Highest Level In 6 Years
Ripple (XRP) has surged 181.38% in the past 30 days, demonstrating strong market momentum. After reaching $1.63, XRP is now consolidating, with its RSI at a neutral 53.2, signaling balanced market conditions.
If bullish momentum builds, XRP could retest $1.63 and climb toward $1.70, its highest level since 2018. However, a downtrend might push the price down to $1.27 or even $1.05.
XRP Is Currently In A Neutral Zone
XRP RSI currently sits at 53.2, reflecting a neutral momentum after the recent price surge. The RSI, or Relative Strength Index, measures the speed and magnitude of price changes on a scale from 0 to 100.
Values above 70 indicate overbought conditions, often signaling a potential pullback, while values below 30 suggest oversold levels, hinting at recovery potential. XRP RSI was above 70 between November 21 and 23, during its rally to $1.63, highlighting the overbought state at that peak.
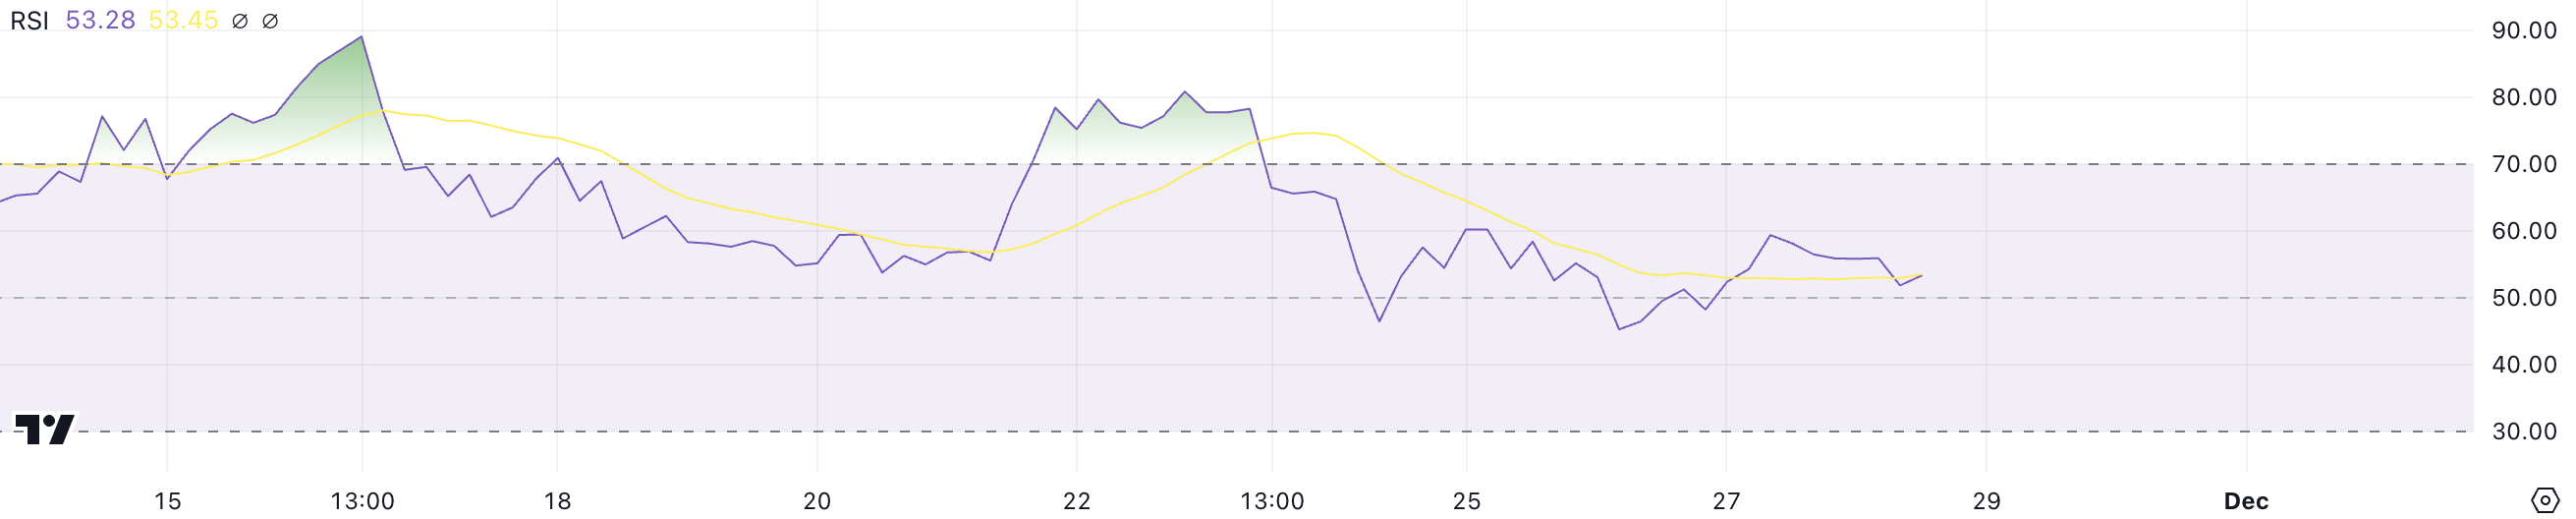 XRP RSI. Source: TradingView
 At 53.2, XRP’s RSI indicates a cooling of bullish momentum but does not signal a reversal yet. This neutral level suggests that the coin is consolidating after its recent gains, leaving room for further upward movement if buying pressure returns.
However, if the RSI trends lower, it could indicate weakening sentiment, potentially leading to a pullback.
Ripple CMF Turned Negative
Ripple CMF is currently at -0.05, down from 0.10 when its price peaked at $1.63 a week ago, reflecting reduced capital inflows. The CMF, or Chaikin Money Flow, measures the volume-weighted flow of capital into or out of an asset, with positive values indicating buying pressure and negative values suggesting selling dominance.
The drop to negative territory signals that selling pressure is starting to outweigh buying activity, although not yet significantly.
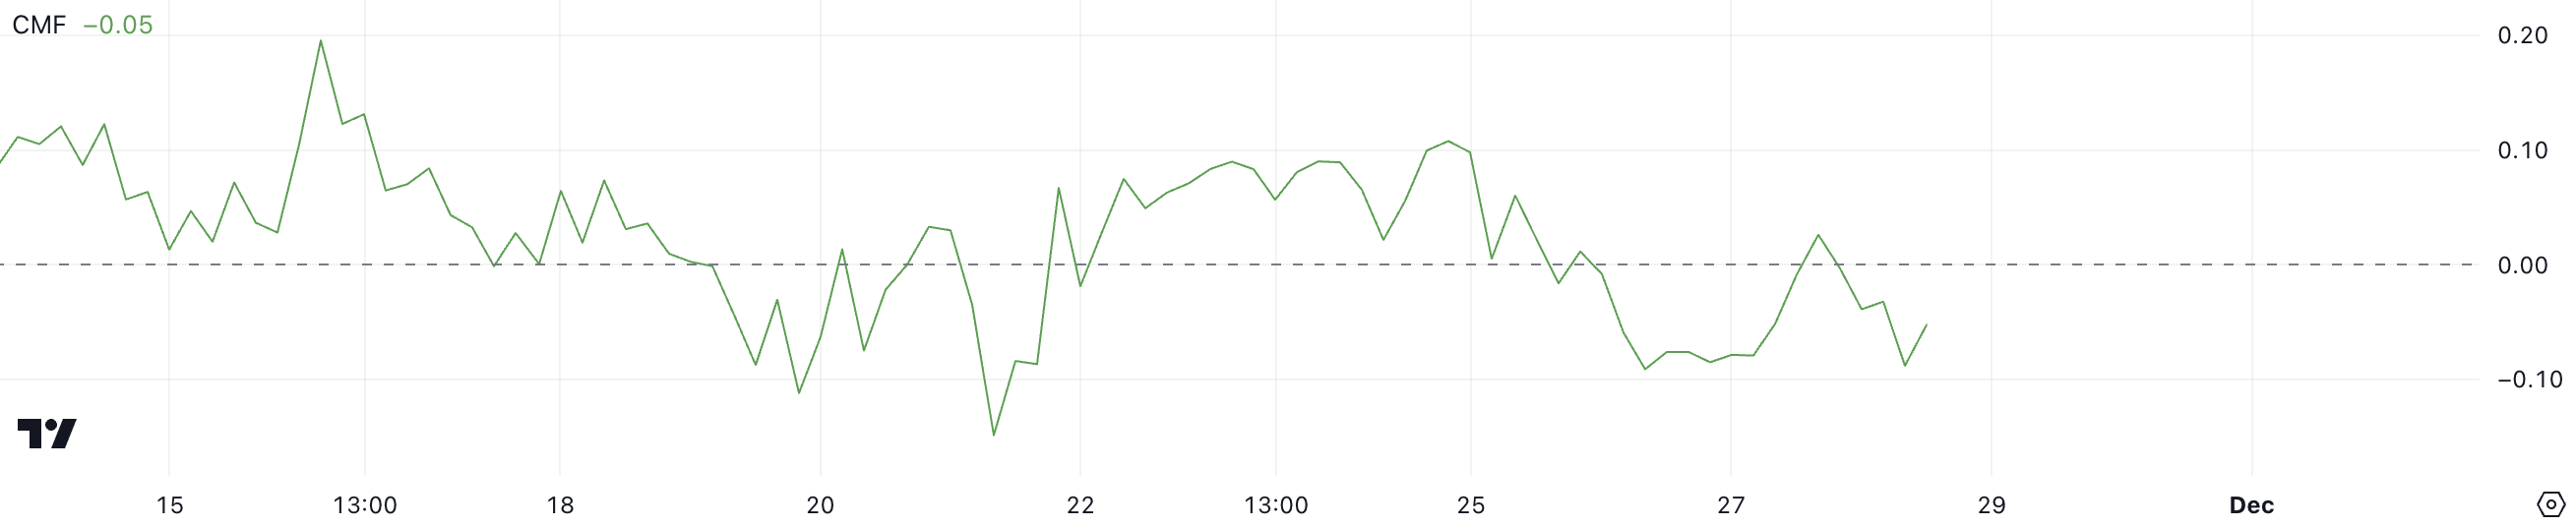 XRP CMF. Source: TradingView
 At -0.05, XRP’s CMF indicates slight bearish sentiment but remains above the -0.15 level seen on November 21. This suggests that while selling pressure is increasing, it is not as intense as during previous corrections.
If the CMF trends further downward, it could signal more selling and a potential XRP price decline.
Ripple Price Prediction: Can It Go Back to 2018 Levels?
XRP EMA lines remain bullish, with short-term lines positioned above long-term ones, signaling an ongoing uptrend. However, the narrowing gap between the lines suggests weakening bullish momentum, indicating a possible trend reversal.
If a downtrend emerges, Ripple price could test the strong support at $1.27. If that level fails to hold, the price could drop further to $1.05, reflecting a more significant correction.
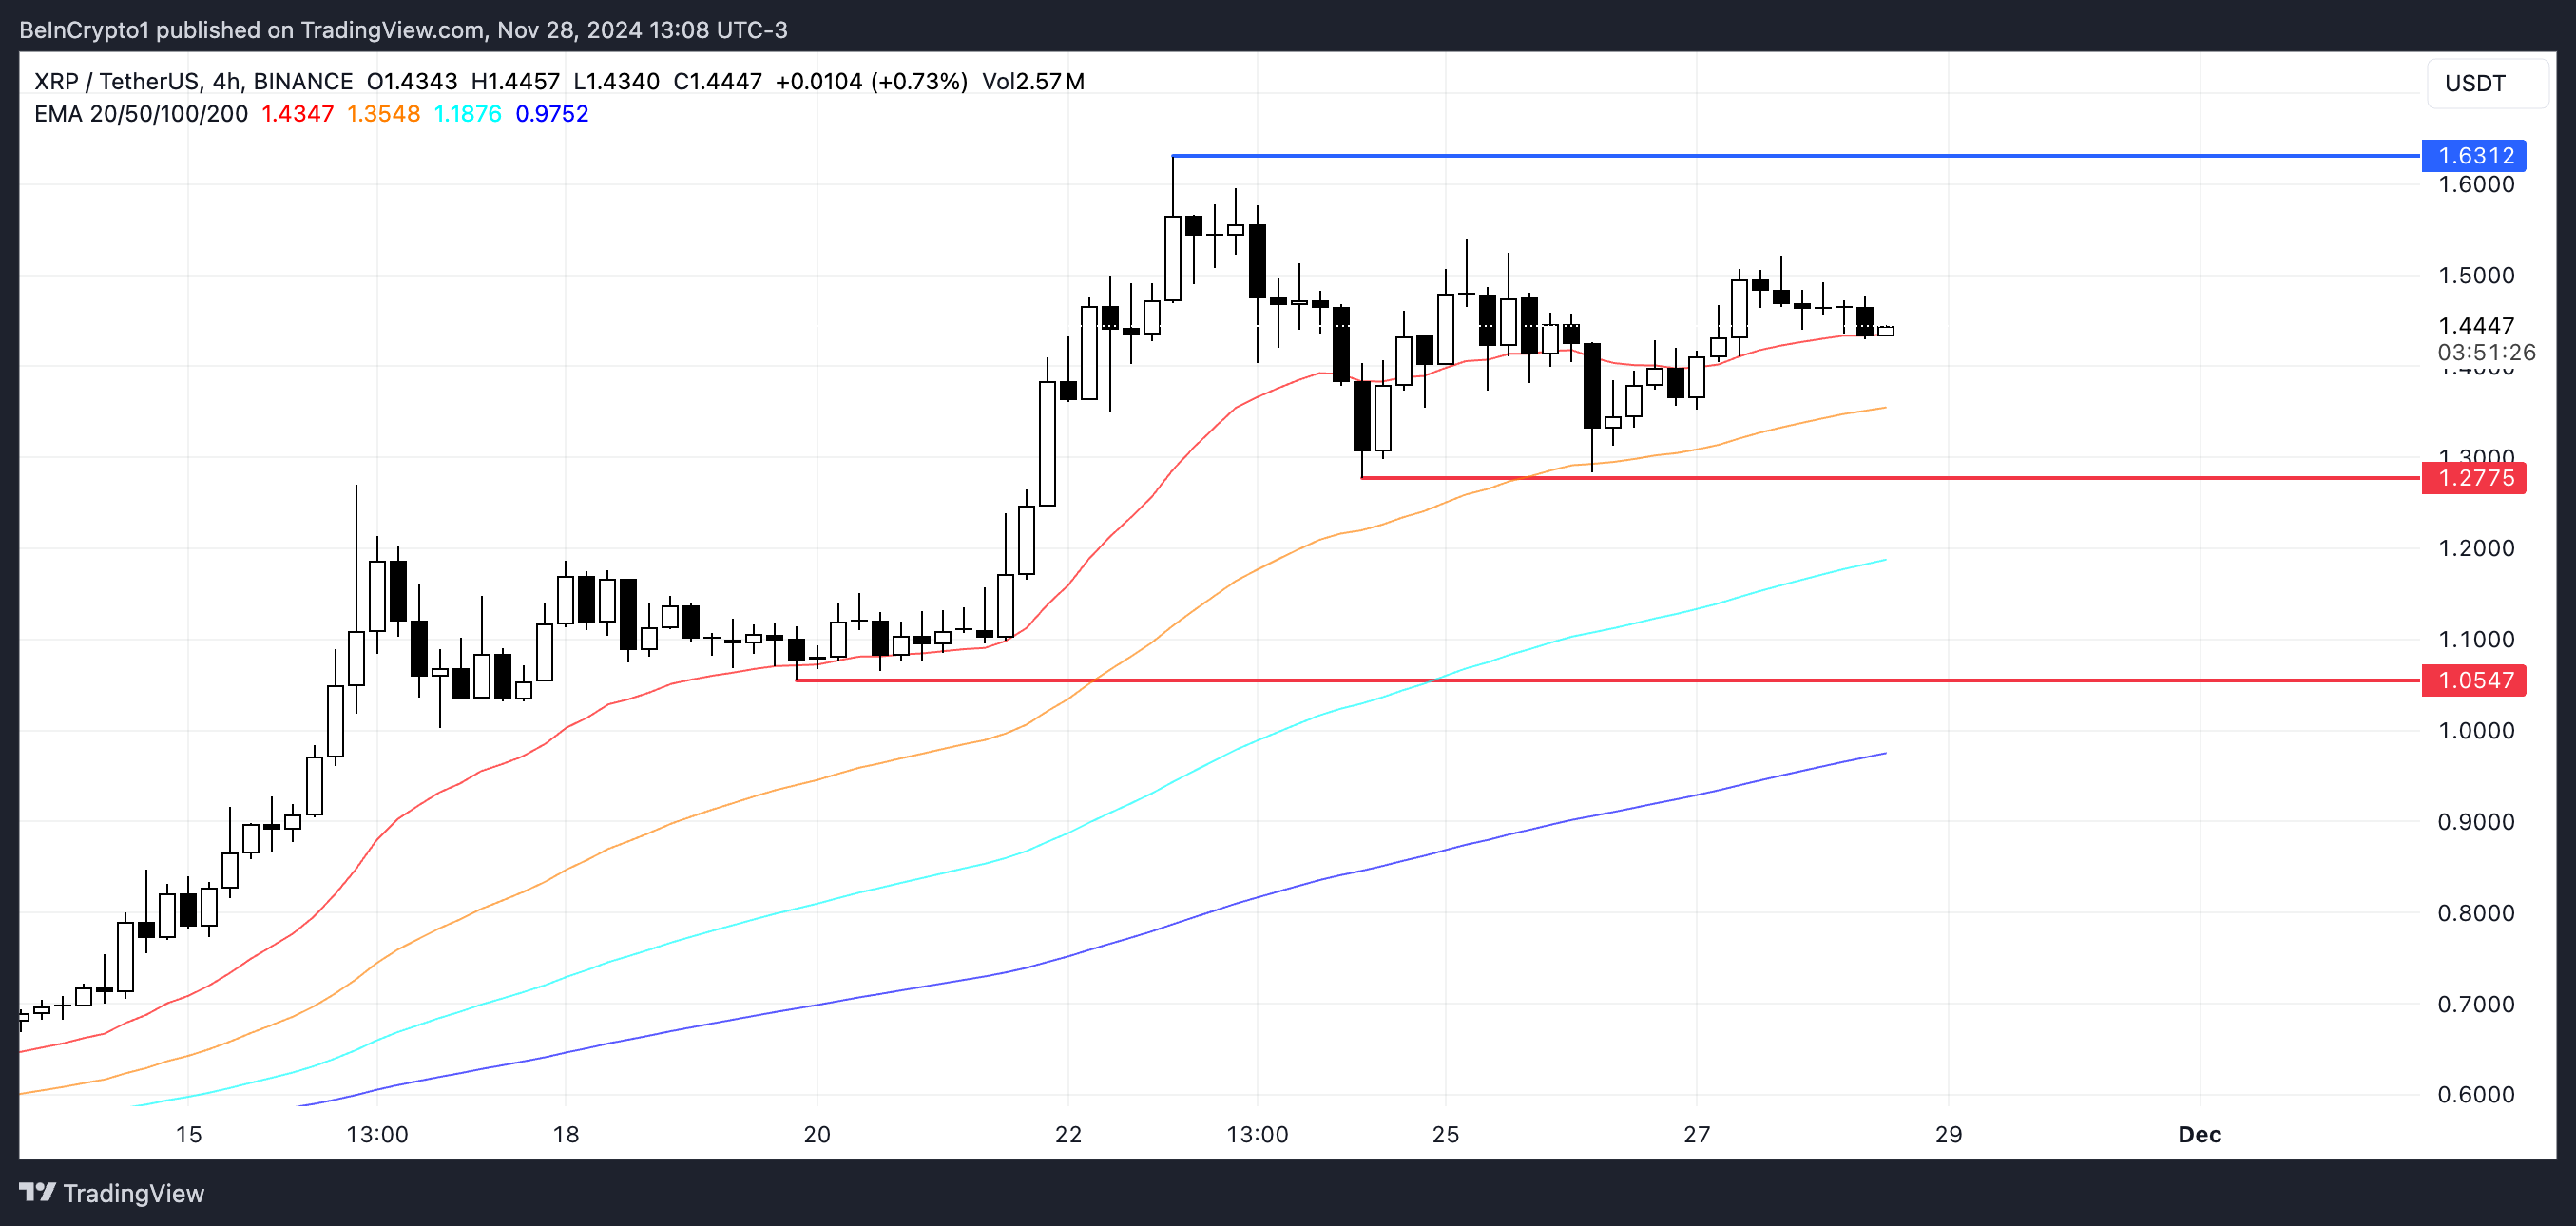 XRP Price Analysis. Source: TradingView
 On the other hand, if buying pressure strengthens and a new uptrend forms, XRP price could retest its recent high of $1.63. Breaking this level could push the price to $1.70, marking its highest value since 2018.