Ethereum Realized Cap Hits All-Time High, Suggests Trouble for ETH Bears
Ethereum Realized Cap, which faced a notable downturn between August and November, has hit a new all-time high of $243.45 billion, according to Glassnode data. This development comes amid ETH’s price rally to $3,800.
Based on historical data, the rise in Realized Cap is a sign of a bullish trend. Hence, this milestone could spell trouble for traders who are bearish about Ethereum’s price action.
Ethereum Remains Undervalued Amid Latest Milestone
Ethereum’s Realized Cap — a key on-chain indicator — has shown a notable increase, hinting at a potential for significant price appreciation. The metric, which considers the price at which each coin last moved, helps identify market tops and bottoms.
An increase in Realized Cap indicates that coins last moved at lower prices and are being spent, suggesting that ETH is being repriced higher. On the other hand, a decrease in Realized Cap reflects spending at higher prices, signaling the potential for a decline.
Therefore, Ethereum’s rising Realized Cap suggests growing confidence among holders and a repricing of ETH’s value. Further, if this trend remains the same, it will align with historical patterns that precede significant price surges.
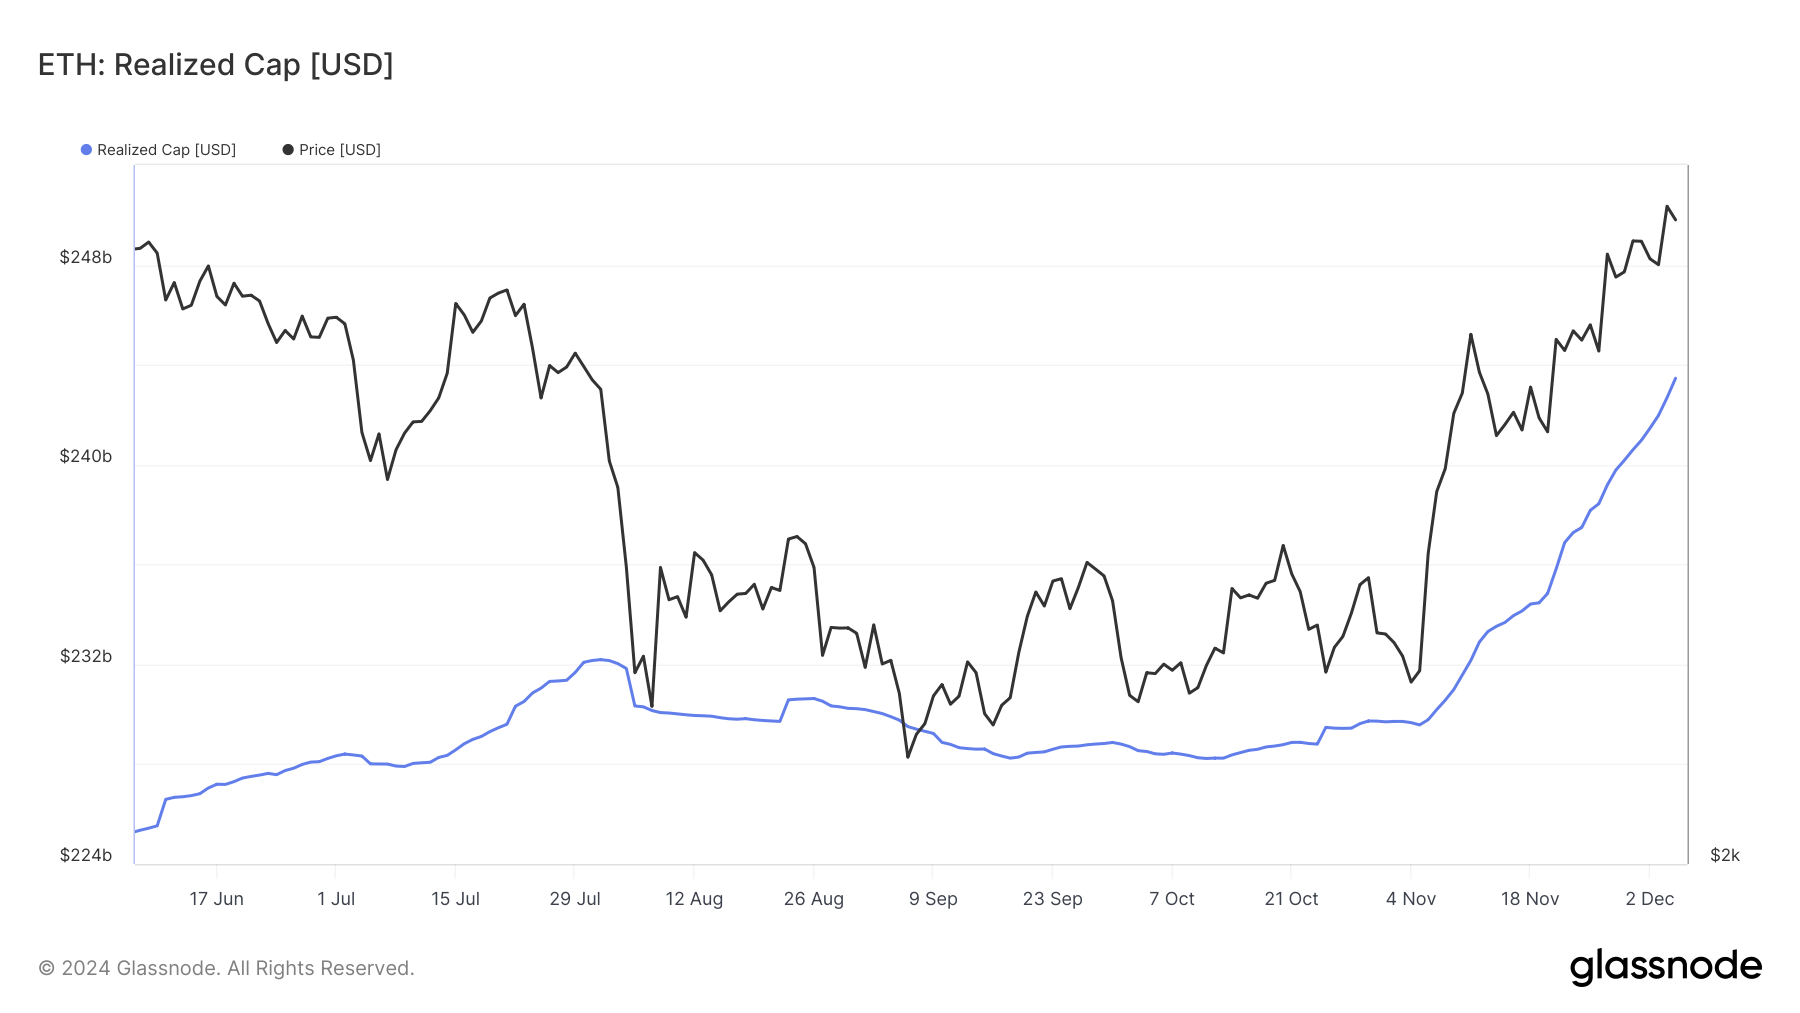 Ethereum Realized Cap. Source: Glassnode
 Besides this metric above, Ethereum’s Market Value to Realized Value (MVRV) Long/Short Difference also aligns with the thesis. As the name implies, the MVRV Long/Short Difference shows if long-term holders have more unrealized profits at the current value or if short-term holders do.
When the metric is negative, it means that short-term holders have the upper hand. In most cases, this is bearish for the price. However, according to Santiment, Ethereum’s MVRV Long/Short Difference has climbed to the positive zone at 5.67%, indicating that the trend is bullish and the cryptocurrency is undervalued.
The last time the cryptocurrency followed such a trend, ETH bears bore the brunt as the price rallied toward $4,100. Thus, if this movement continues, then Ethereum’s value could be higher in the short term.
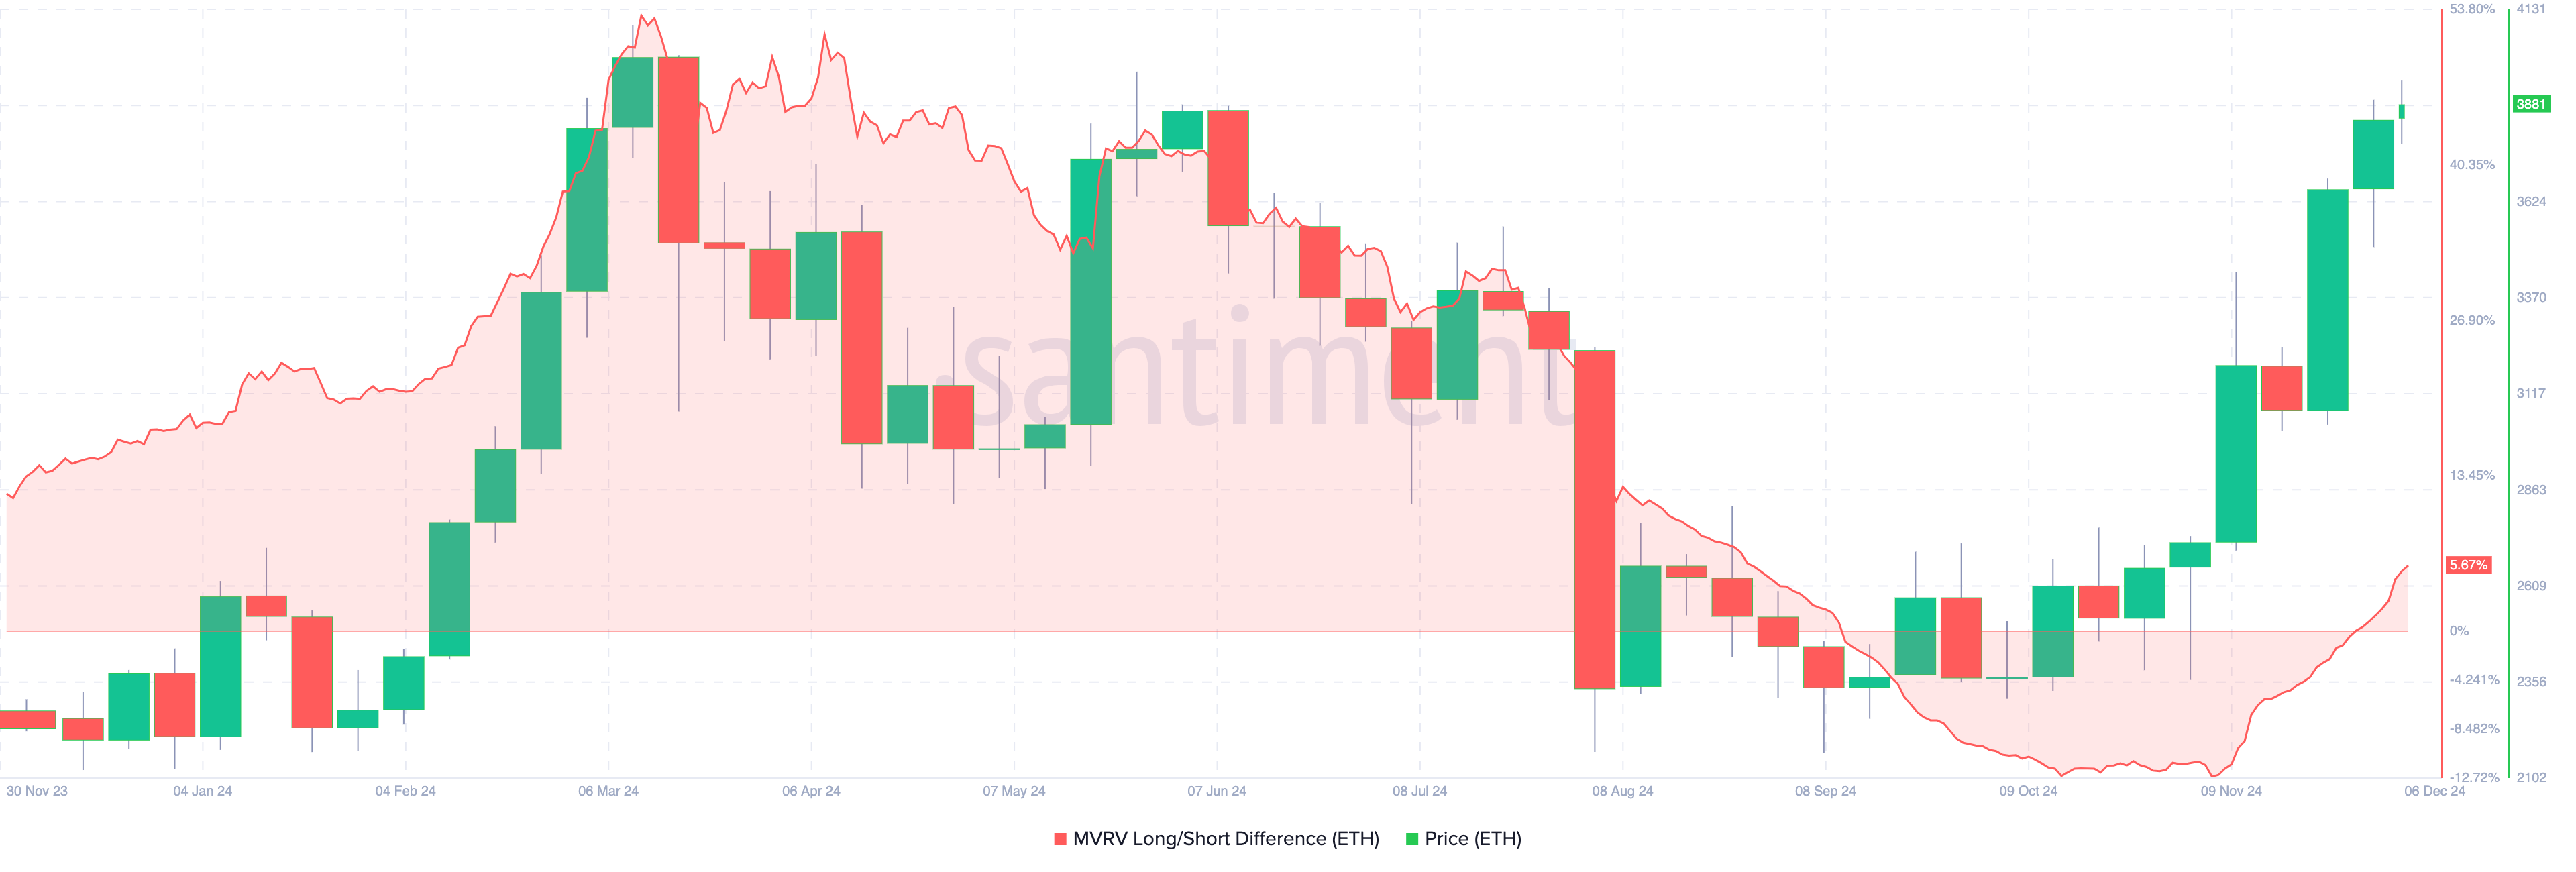 Ethereum MVRV Long/Short Difference. Source: Santiment
 ETH Price Prediction: $4,200 Looms
An evaluation of the daily ETH/USD chart shows that the cryptocurrency is following a similar trend, which saw it reach a yearly high in June. During that period, Ethereum’s price initially dropped from $2,770 to $2,200 before it climbed above $4,000 months later.
Between October and the first week of November, ETH decreased from $2,700 to $2,300 before its recent rebound. The Relative Strength Index (RSI), which measures momentum, follows the same pattern.
If this trend continues, then ETH could rise to $4,200 in the short term. Should bulls sustain the move, then the crypto could climb as high as $4,500.
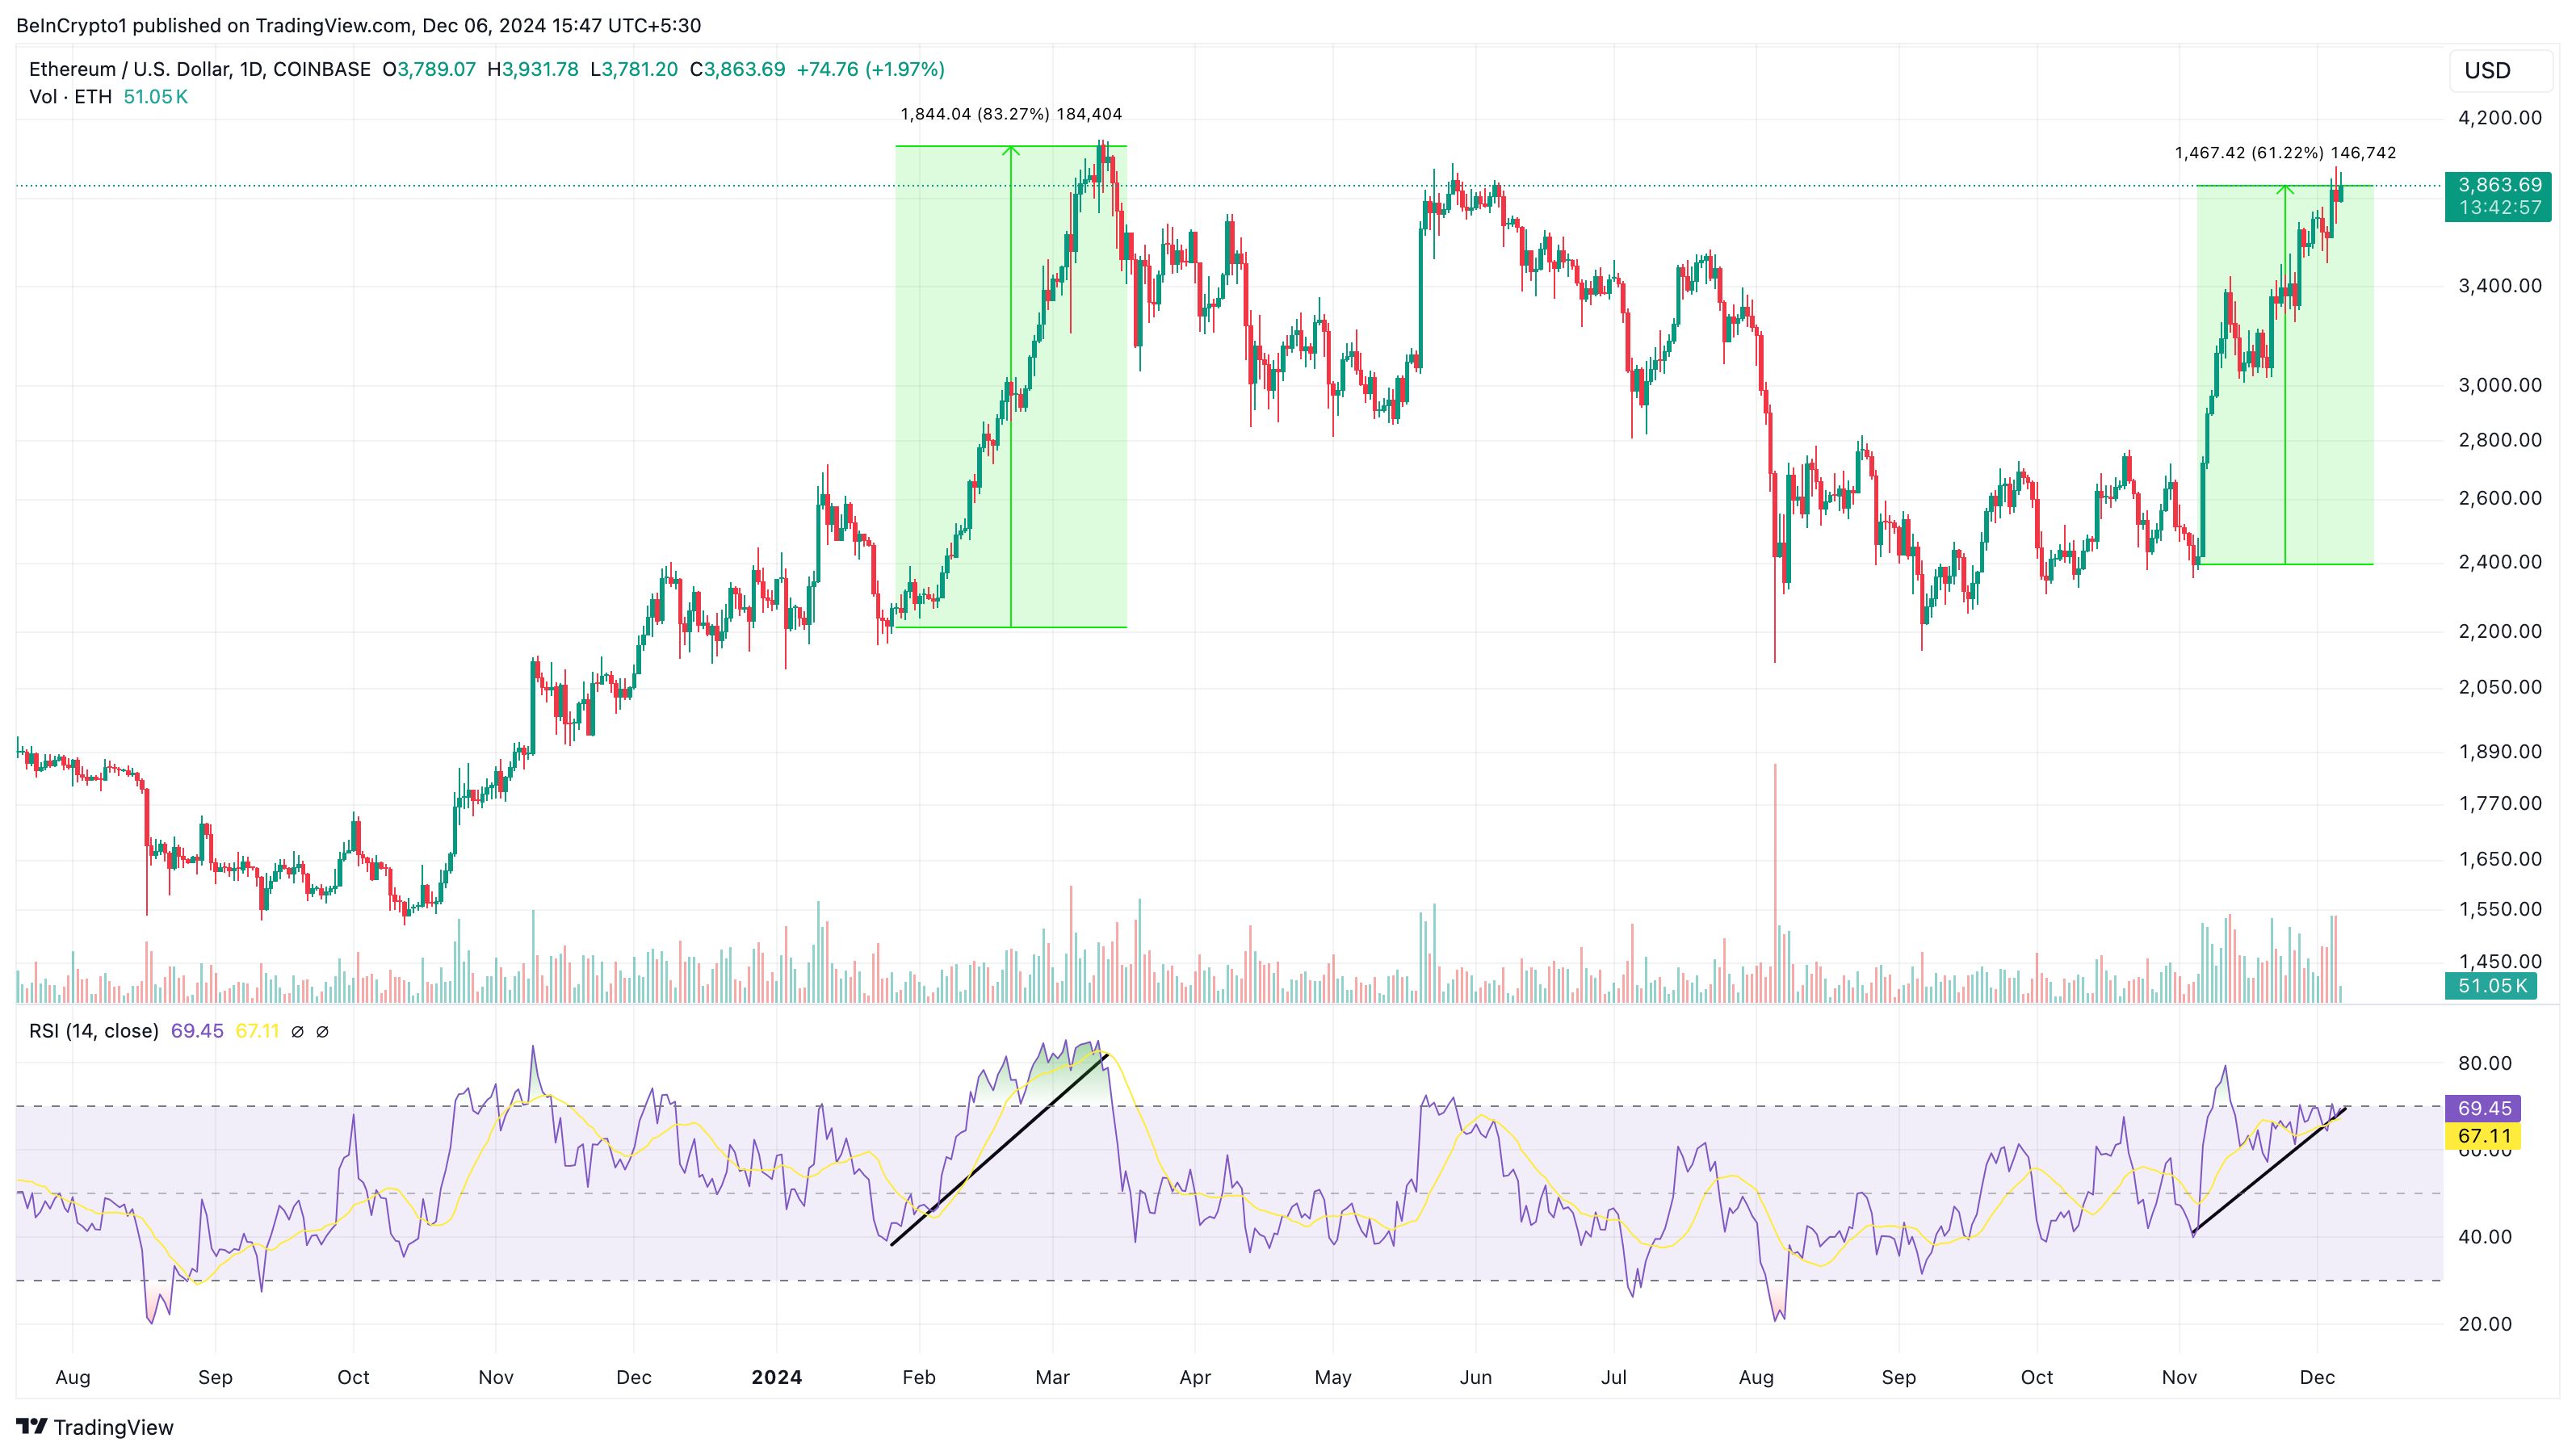 Ethereum Daily Analysis. Source: TradingView
 However, if the Ethereum Realized Cap drops and buying pressure subsides, this trend might change, and the price could slip below $3,500.