Solana (SOL) Price Down 15% From All-Time High, More Declines Possible
Solana (SOL) price is currently trading roughly 15% below its all-time high reached on November 22, while its market cap it’s now at $107 billion, surpassing tech giant Xiaomi. Despite a positive BBTrend on December 8, indicating some upward momentum, it has since weakened and is now at 0.66, suggesting that the trend could reverse soon.
Meanwhile, SOL’s DMI chart shows an increasing ADX of 26.2, signaling that the strength of the trend is rising, although the negative momentum remains dominant. With the EMA lines also turning bearish, SOL price could face further declines, potentially testing support levels as low as $215 in the near term.
SOL BBTrend Is Positive, But That Could Change Soon
After staying negative between November 27 and December 6, Solana BBTrend turned positive again, peaking at 2.8 on December 8.
However, it is currently at 0.66, suggesting that the positive trend is weakening.
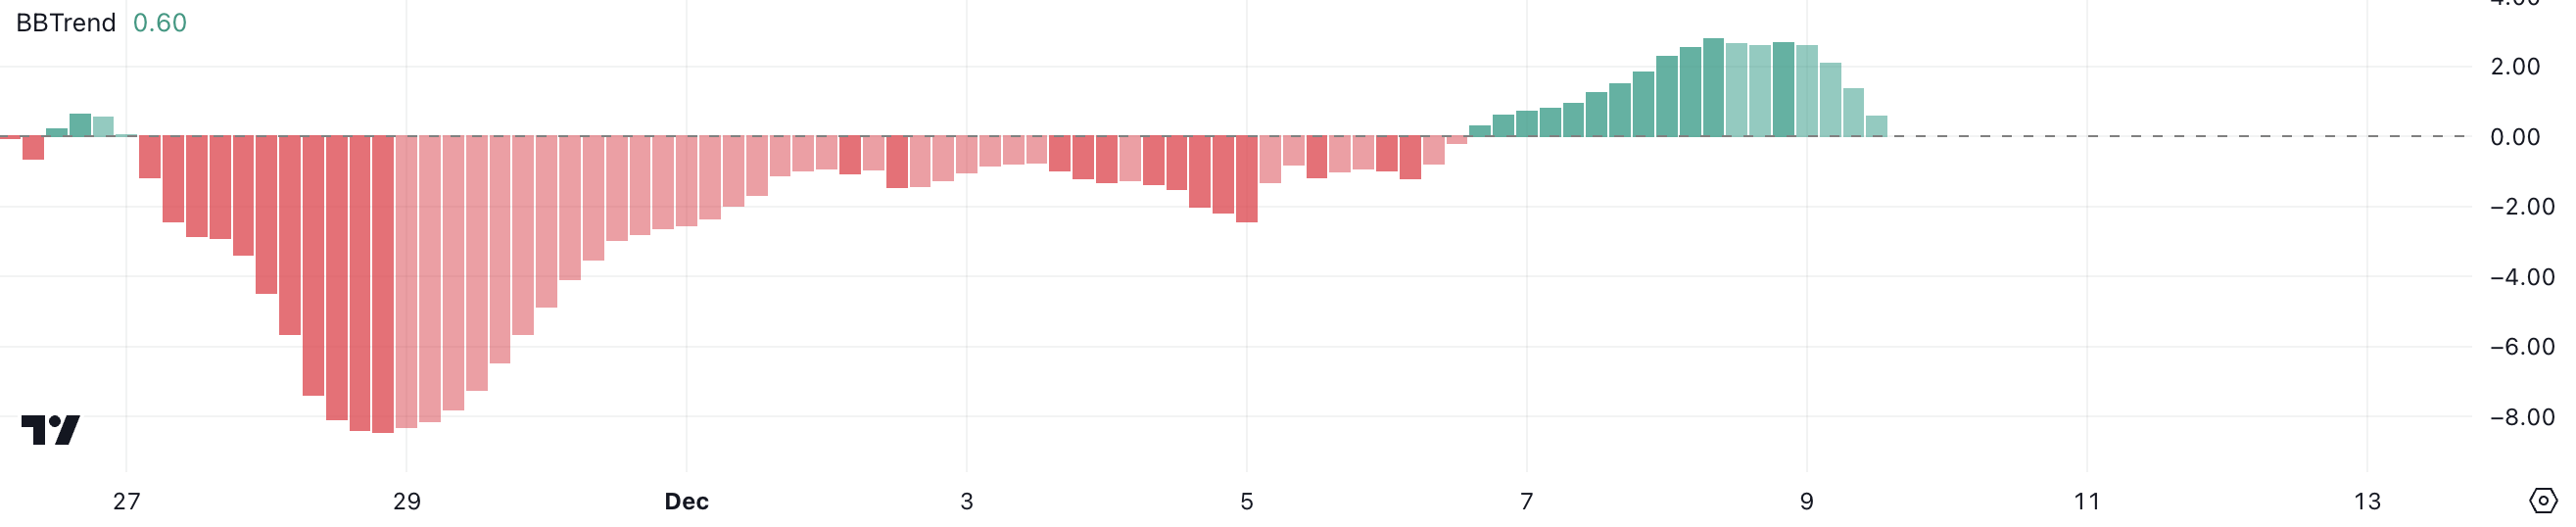 SOL BBTrend. Source: TradingView
 BBTrend is a technical indicator derived from Bollinger Bands. It measures the strength and direction of a trend. A positive BBTrend value suggests upward momentum, while a negative value indicates downward momentum.
Although SOL’s BBTrend was positive recently, its current decline implies that the trend may not have enough strength to sustain upward movement. If BBTrend turns negative again, it could signal a potential downtrend for SOL, possibly leading to further price declines.
Solana Downtrend Turned Strong But Appears To Have Stabilized
Solana DMI chart shows its ADX is currently at 26.2, up from around 16 just a day ago.
This indicates that the strength of the trend is increasing, suggesting that a more defined movement is starting to form.
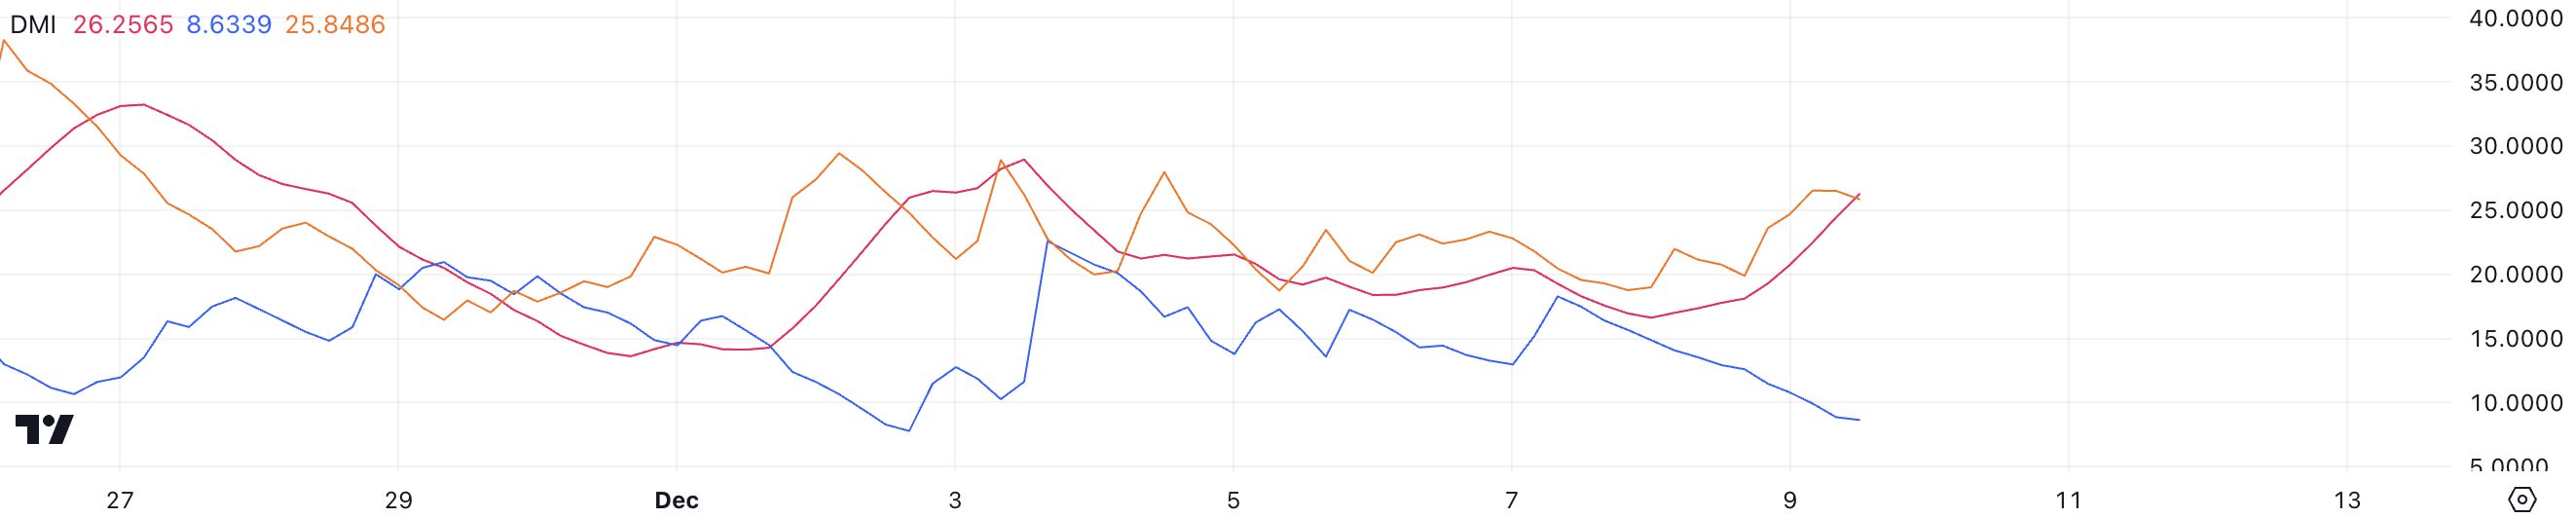 SOL DMI. Source: TradingView
 ADX (Average Directional Index) is a technical indicator used to measure the strength of a trend, regardless of its direction. It ranges from 0 to 100, with values above 25 indicating a strong trend, while values below 20 suggest a weak trend. Currently, SOL’s ADX at 26.2 shows that the trend is gaining strength.
Despite this, SOL is in a downtrend as its D+ (positive directional indicator) is at 8.6, while D- (negative directional indicator) is at 25.8. Although D- has stabilized after reaching 25, it still indicates that the negative momentum is dominant, suggesting that SOL could continue its downtrend unless a shift in momentum occurs.
SOL Price Prediction: Will SOL Fall To $215 In December?
SOL’s EMA lines are currently showing a bearish trend, with short-term lines trending down and the price positioned below them. One of the short-term lines has just crossed a long-term line, suggesting further downward pressure.
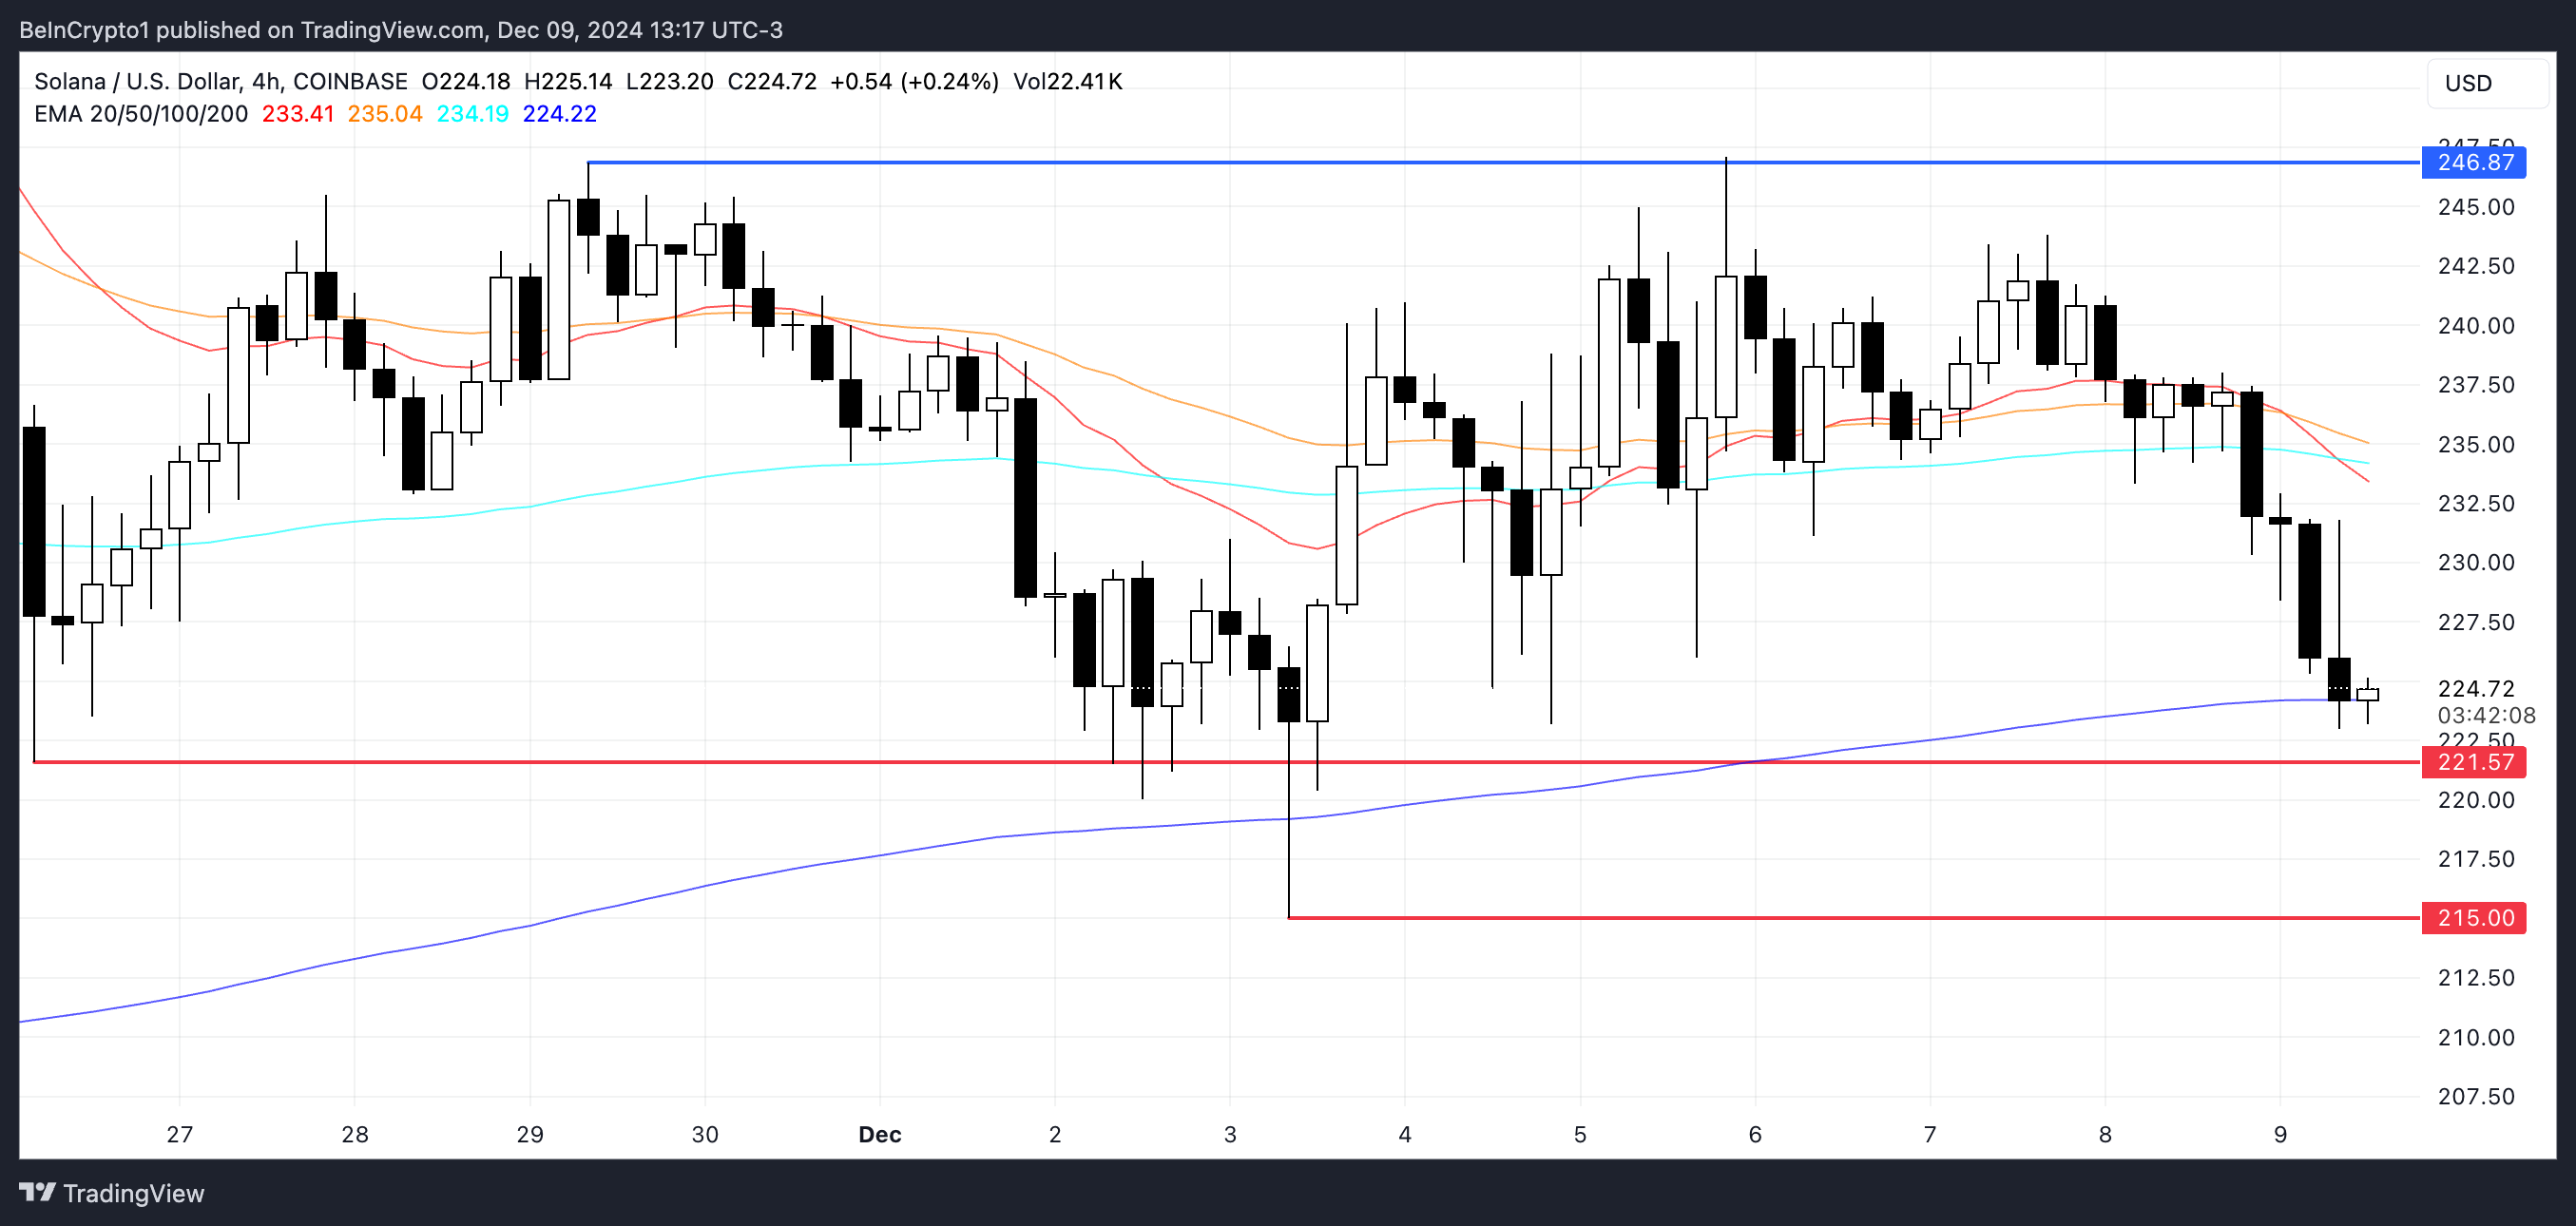 SOL Price Analysis. Source: TradingView
 If this trend continues, Solana price could test the support at $221, and if that level fails to hold, the price might drop as low as $215.
However, if the uptrend regains strength, SOL price could recover and rise to test the resistance at $246, indicating a potential 10% upside from its current level, especially if some of its biggest applications, such as Pumpfun and Raydium, continue to attract users and volume.