Bitget App
Trade smarter
Open
HomepageSign up
Bitget>
News>
FLOKI Price Up 9%: Is a Breakout Above Resistance Imminent?

FLOKI Price Up 9%: Is a Breakout Above Resistance Imminent?

CoinEdition2024/12/12 16:00
By: Coin Edition
XOLDTOKEN0.00%FLOKI+1.91%
FLOKI price rises 9%, forming an ascending triangle pattern; traders await breakout above resistance. Floki Inu faces key resistance at $0.000027; recent surges have stalled at this critical level. FLOKI consolidation hints at potential bullish rally; RSI at 49.38 shows room for upward momentum.
  • FLOKI price rises 9%, forming an ascending triangle pattern; traders await breakout above resistance.
  • Floki Inu faces key resistance at $0.000027; recent surges have stalled at this critical level.
  • FLOKI consolidation hints at potential bullish rally; RSI at 49.38 shows room for upward momentum.

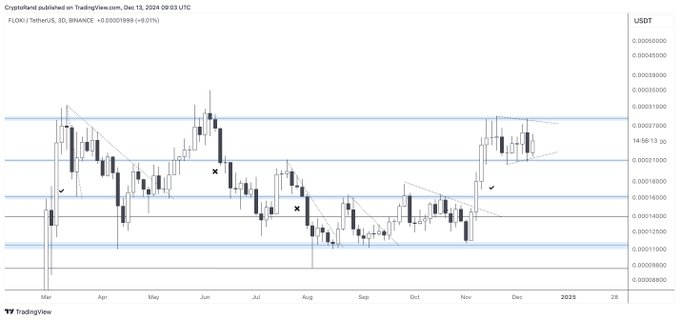
The Floki Inu (FLOKI) price is up 9.01% on the 3-day chart . After falling in 2023 and early 2024, FLOKI shows signs of recovery. But key resistance levels remain.

The price action formed an ascending triangle pattern. Traders and analysts are waiting for a rally to start. But the path forward is uncertain. Previous resistance levels hint at possible pullbacks.

Crypto Rand, an analyst, says the Floki Inu market faces tough resistance around 0.00002700 USDT. This resistance has been hard to break through. Since October, price movements tested this resistance level, but each surge stalled. Traders are cautious.

Floki Inu’s Price History

Floki Inu has pulled back from previous resistance zones near 0.00002000 and 0.00002100 USDT. These price retracements make the market hesitant as it sits below key resistance levels.

FLOKI Price Up 9%: Is a Breakout Above Resistance Imminent? image 0 FLOKI Price Up 9%: Is a Breakout Above Resistance Imminent? image 1 Source: X

Despite this, the current consolidation phase suggests the token might be preparing for a big move. But traders should be ready for possible retracements before a potential breakout.


Read also : Pepe, Bonk, and Floki Price Analysis: Can the Rally Continue?

Floki Inu’s market cap is $2.31 billion, with a daily trading volume of $426.99 million. It dipped 1.07% in the past day. The current supply of FLOKI tokens is 9.59 trillion, with a total supply of 9.67 trillion. This gives the token liquidity and potential for volatility.

Floki Inu Technical Analysis

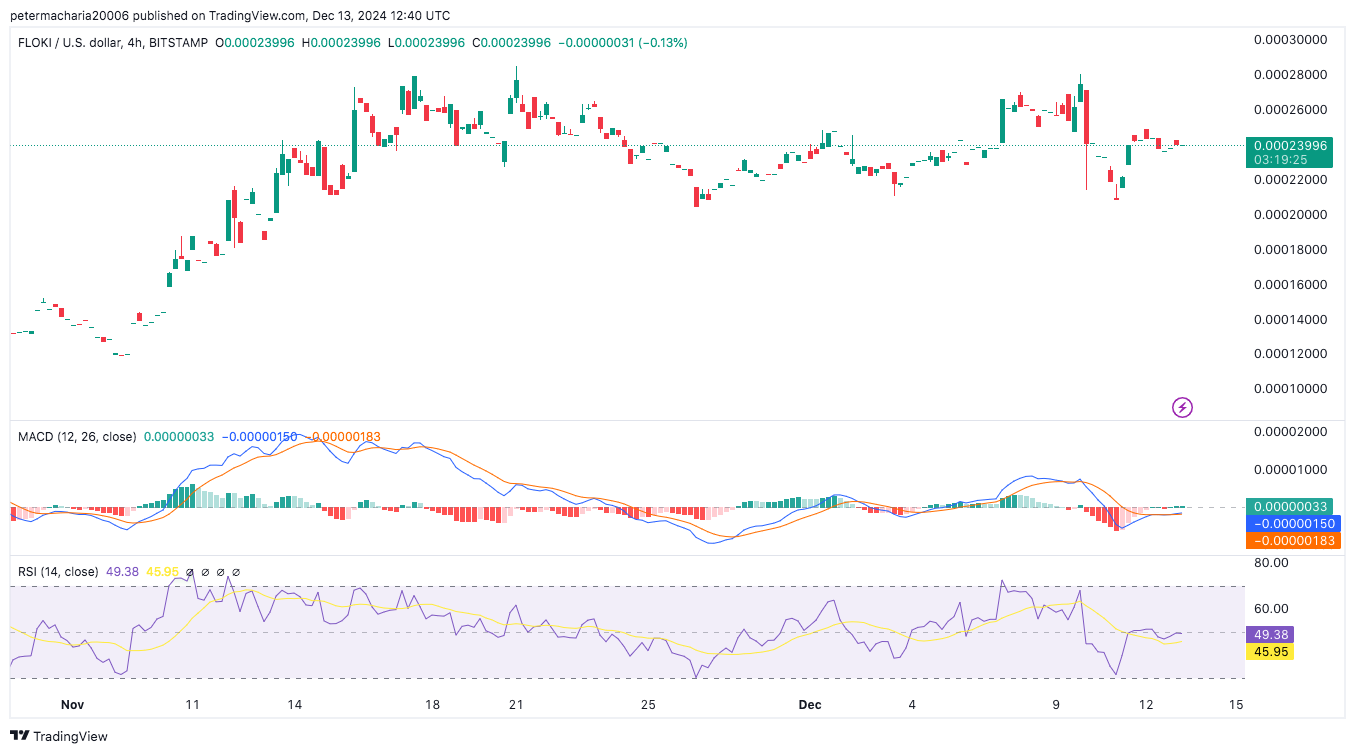
The technical outlook for Floki Inu shows a mild bullish momentum, with the MACD (12, 26) indicator currently above the signal line. 

FLOKI Price Up 9%: Is a Breakout Above Resistance Imminent? image 2 FLOKI Price Up 9%: Is a Breakout Above Resistance Imminent? image 3 Source: TradingView

The RSI (14) is at 49.38, just below neutral. This indicates a balanced market, neither overbought nor oversold. Although recent RSI values dropped slightly, the token has room to move up if momentum shifts.

Disclaimer: The information presented in this article is for informational and educational purposes only. The article does not constitute financial advice or advice of any kind. Coin Edition is not responsible for any losses incurred as a result of the utilization of content, products, or services mentioned. Readers are advised to exercise caution before taking any action related to the company.

Disclaimer: The content of this article solely reflects the author's opinion and does not represent the platform in any capacity. This article is not intended to serve as a reference for making investment decisions.
PoolX: Earn new token airdrops
Lock your assets and earn 10%+ APR
Lock now!

You may also like

New spot margin trading pair — HOLO/USDT!
Bitget Announcement2025/09/12 07:46
FUN drops by 32.34% within 24 hours as it faces a steep short-term downturn

- FUN plunged 32.34% in 24 hours to $0.008938, marking a 541.8% monthly loss amid prolonged bearish trends. - Technical breakdowns, elevated selling pressure, and forced liquidations highlight deteriorating market sentiment and risk-off behavior. - Analysts identify key support below $0.0080 as critical, with bearish momentum confirmed by RSI (<30) and MACD indicators. - A trend-following backtest strategy proposes short positions based on technical signals to capitalize on extended downward trajectories.

Bitget-RWA2025/09/12 06:14
OPEN has dropped by 189.51% within 24 hours during a significant market pullback

- OPEN's price plummeted 189.51% in 24 hours to $0.8907, marking its largest intraday decline in history. - The token fell 3793.63% over 7 days, matching identical monthly and yearly declines, signaling severe bearish momentum. - Technical analysts cite broken support levels and lack of bullish catalysts as key drivers of the sustained sell-off. - Absence of stabilizing volume or reversal patterns leaves the market vulnerable to further downward pressure.

Bitget-RWA2025/09/12 06:14
New spot margin trading pair — LINEA/USDT!
Bitget Announcement2025/09/11 10:04

Trending news

More
1
New spot margin trading pair — HOLO/USDT!
2
FUN drops by 32.34% within 24 hours as it faces a steep short-term downturn

Crypto prices

More
Bitcoin
Bitcoin
BTC
$115,403.45
+0.04%
Ethereum
Ethereum
ETH
$4,637.24
+1.68%
XRP
XRP
XRP
$3.12
+2.96%
Tether USDt
Tether USDt
USDT
$1
+0.03%
Solana
Solana
SOL
$238.55
+0.01%
BNB
BNB
BNB
$928.16
+2.22%
USDC
USDC
USDC
$0.9998
-0.00%
Dogecoin
Dogecoin
DOGE
$0.2973
+10.48%
Cardano
Cardano
ADA
$0.9313
+3.95%
TRON
TRON
TRX
$0.3490
-0.10%
How to sell PI
Bitget lists PI – Buy or sell PI quickly on Bitget!
Trade now
Become a trader now?A welcome pack worth 6200 USDT for new users!
Sign up now
Trade smarter