Bitget App
Trade smarter
Open
HomepageSign up
Bitget>
News>
Weekly Price Analysis: The Market Recovers from Technical Selloff

Weekly Price Analysis: The Market Recovers from Technical Selloff

Coinjournal2024/12/17 02:22
By: Coinjournal
BTC-0.32%SOL-1.53%ETH-1.62%
  • Despite a market-wide price decline at the start of last week, the crypto market recovered as Bitcoin closed the week at $102,800.
  • Bitcoin has now reached a new all-time high of $106,000.
  • Meanwhile, US spot crypto ETFs continue to log consecutive positive days of inflows.

Bitcoin

Bitcoin has logged new highs of $106,400 since its dip last week to $94,000, driven largely by positive ETF inflows as US spot Bitcoin ETFs record another week of consecutively positive daily inflows.

From Dec. 9 to Dec. 13, $2.17 billion flowed into the top 10 US spot BTC ETFs.

Current price action shows Bitcoin has broken its previous high of $104,000 and trades at $104,500 after reaching a new high of $106,600.

Weekly Price Analysis: The Market Recovers from Technical Selloff image 0

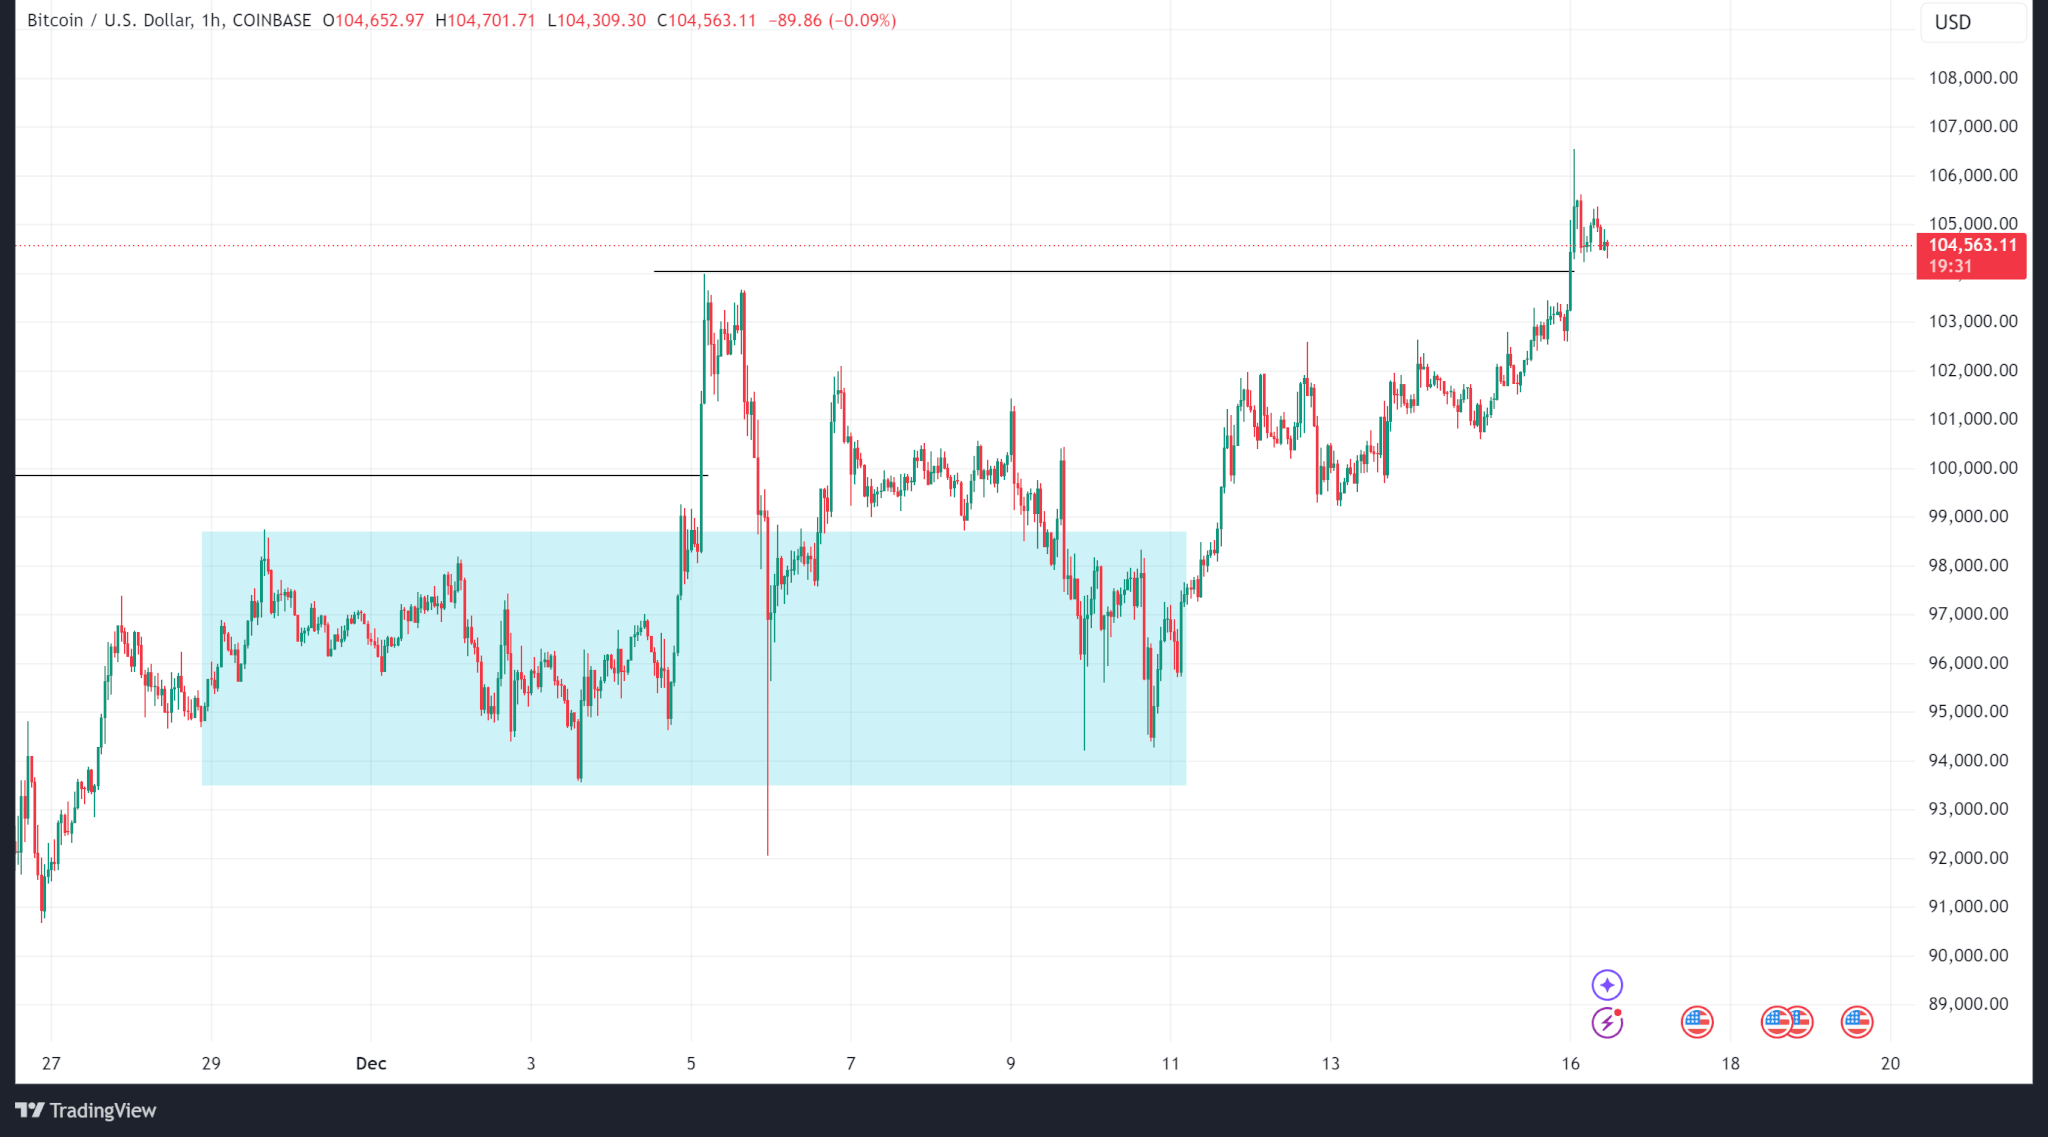
The Fed rate policy decision coming up on Dec. 18 could significantly impact price action. Expectations are hawkish with more controlled slashes moving into next year, which could negatively impact risky assets like Bitcoin.

Price technicals support a hawkish stance as Bitcoin’s price could push downward to grab liquidity at lower levels around $100,000.

Ethereum

The second-largest crypto rebounded from a weekly low of $3,500 to a local high of $4,000. Unlike Bitcoin, it has not broken the previous high formed at the $4,100 level.

Meanwhile, Ethereum spot ETF inflows remained positive throughout last week, totalling $854.8 million.

Weekly Price Analysis: The Market Recovers from Technical Selloff image 1

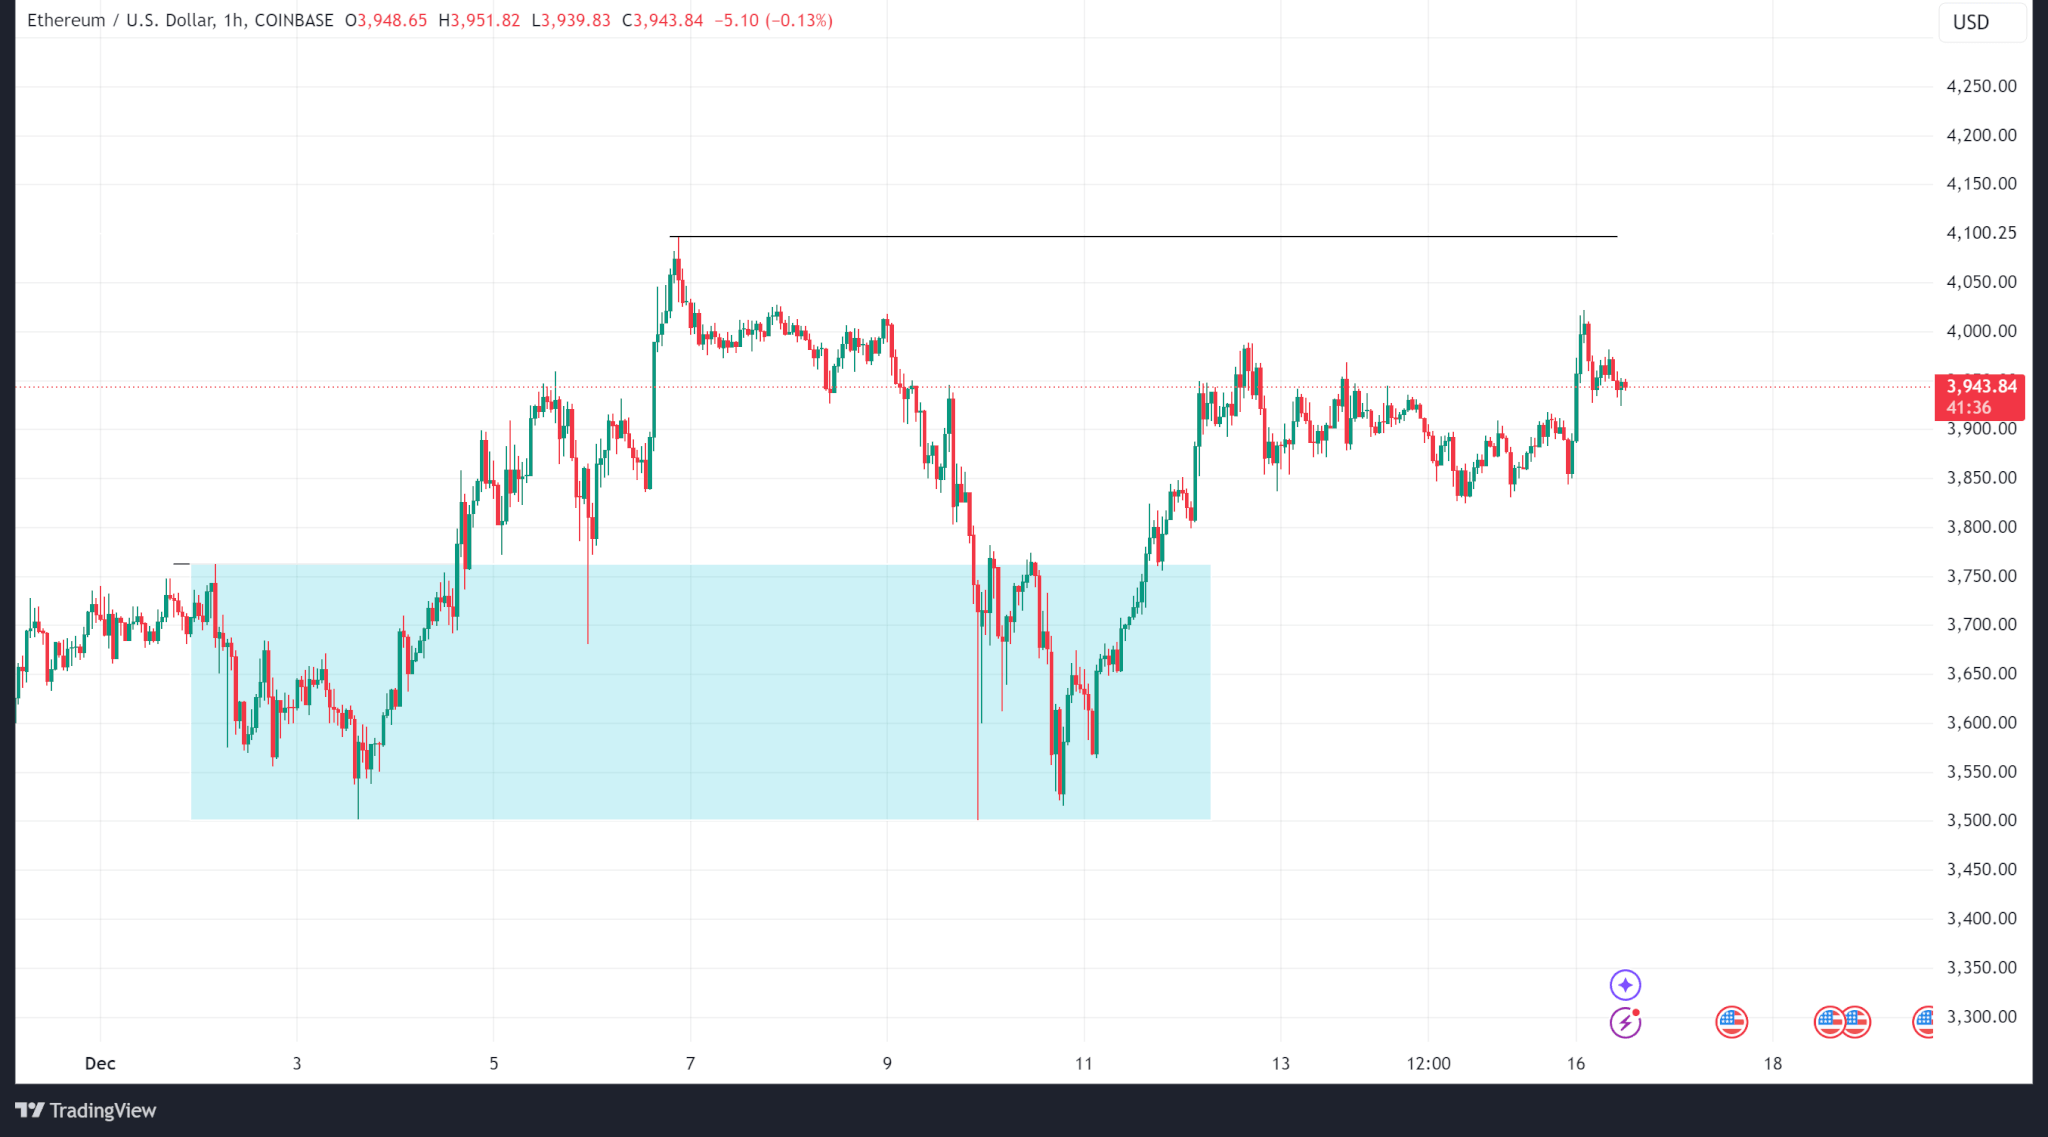
Ethereum trades at $3,950 at the time of publishing.

Solana

Unlike Bitcoin and Ethereum which have rebounded since last week, Solana’s price has declined since failing to close above its all-time high of $260 on the daily time frame.

Weekly Price Analysis: The Market Recovers from Technical Selloff image 2

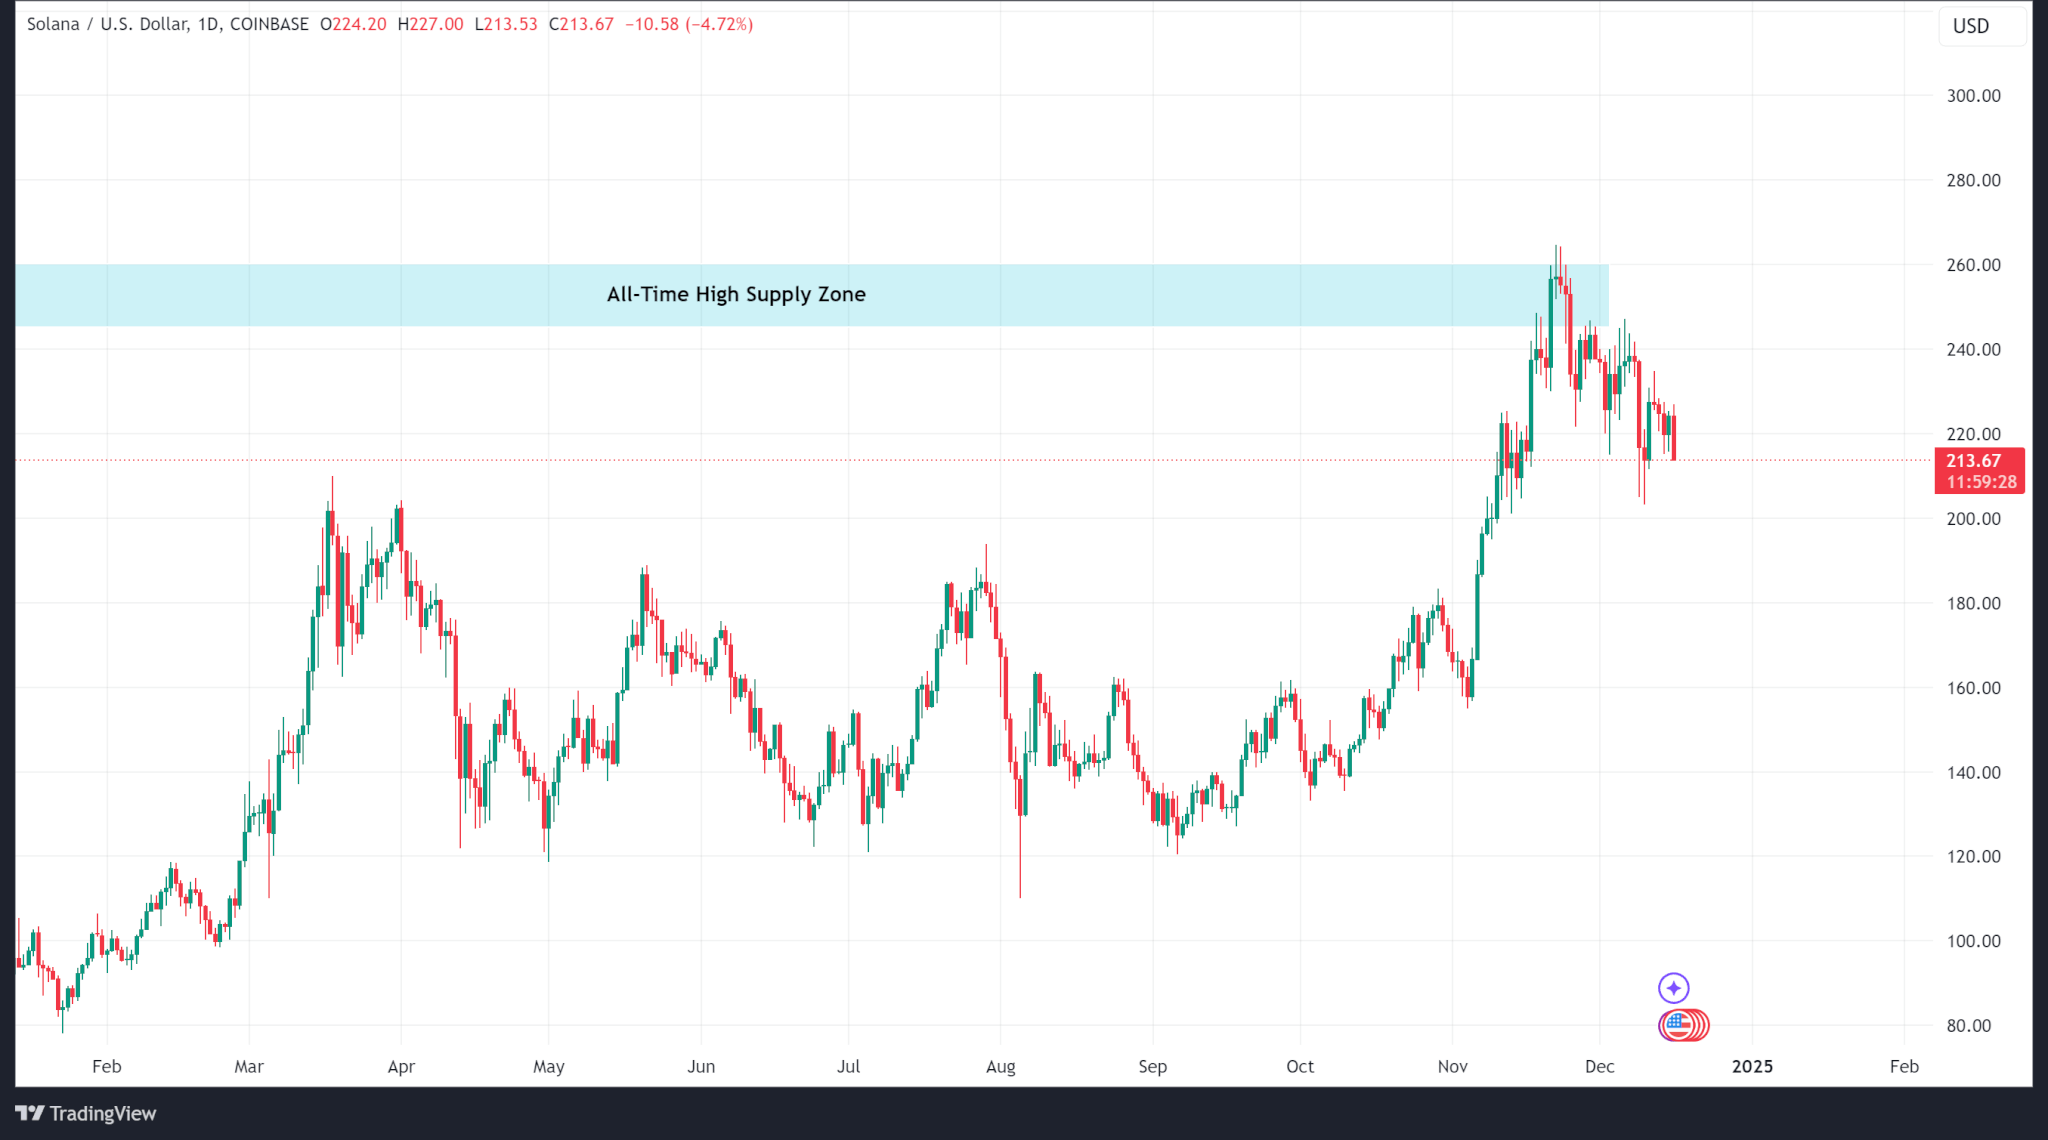
Price action on intermediate time frames (H4/H1) shows rejection and sells from local supply zones which may continue until a logical demand zone at $160. Solana’s price will need to break above $247 on the H4 and eventually close above the all-time high on the daily time frame to resume its bullish motion.

Weekly Price Analysis: The Market Recovers from Technical Selloff image 3

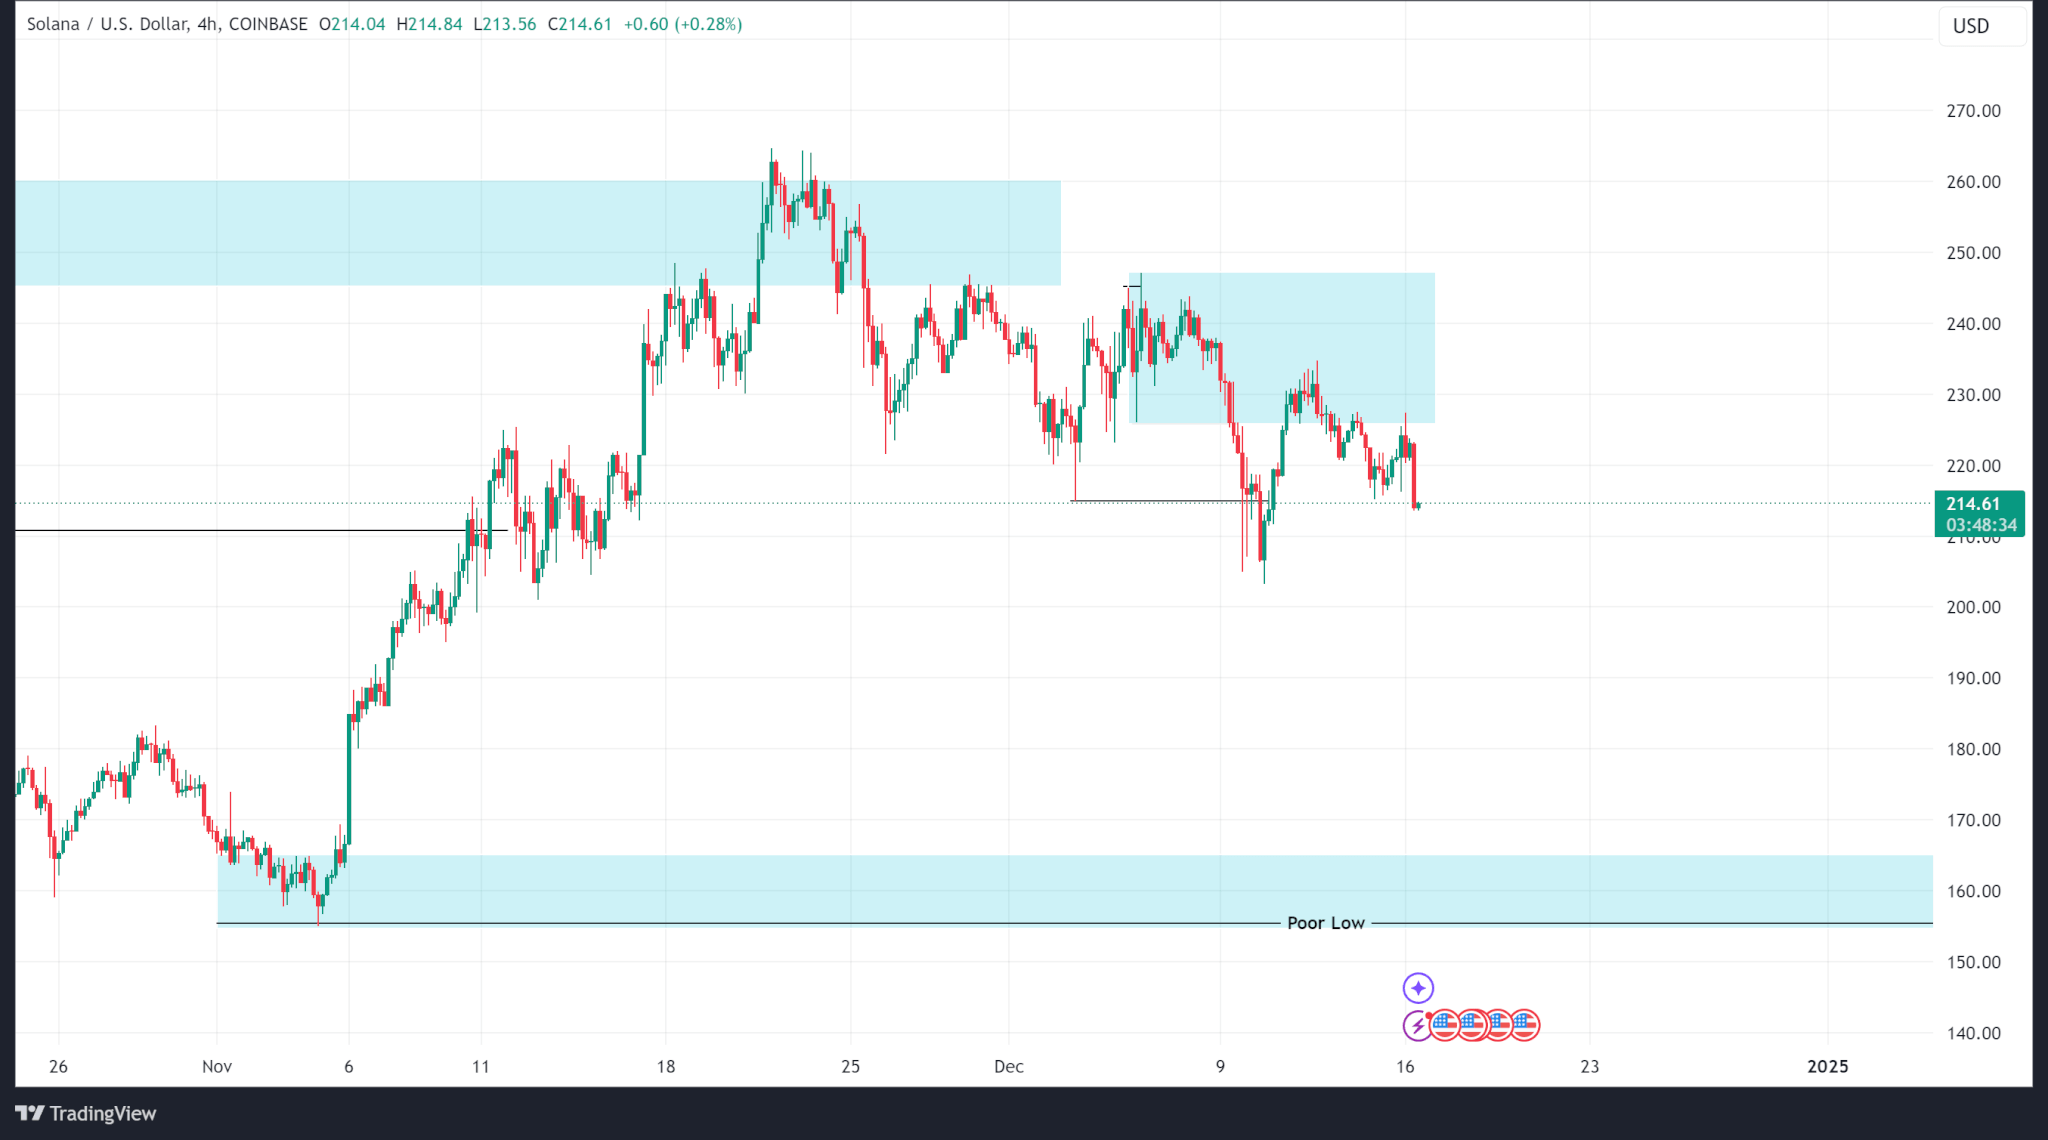
Solana trades at $214 at the time of publishing.

Ripple

Ripple’s price action has been incredibly bullish following its legal wins and expected changes to the US regulatory landscape. The crypto surpassed its former all-time high of $1.99 and formed a new ATH of $2.90 on Dec. 3.

Weekly Price Analysis: The Market Recovers from Technical Selloff image 4

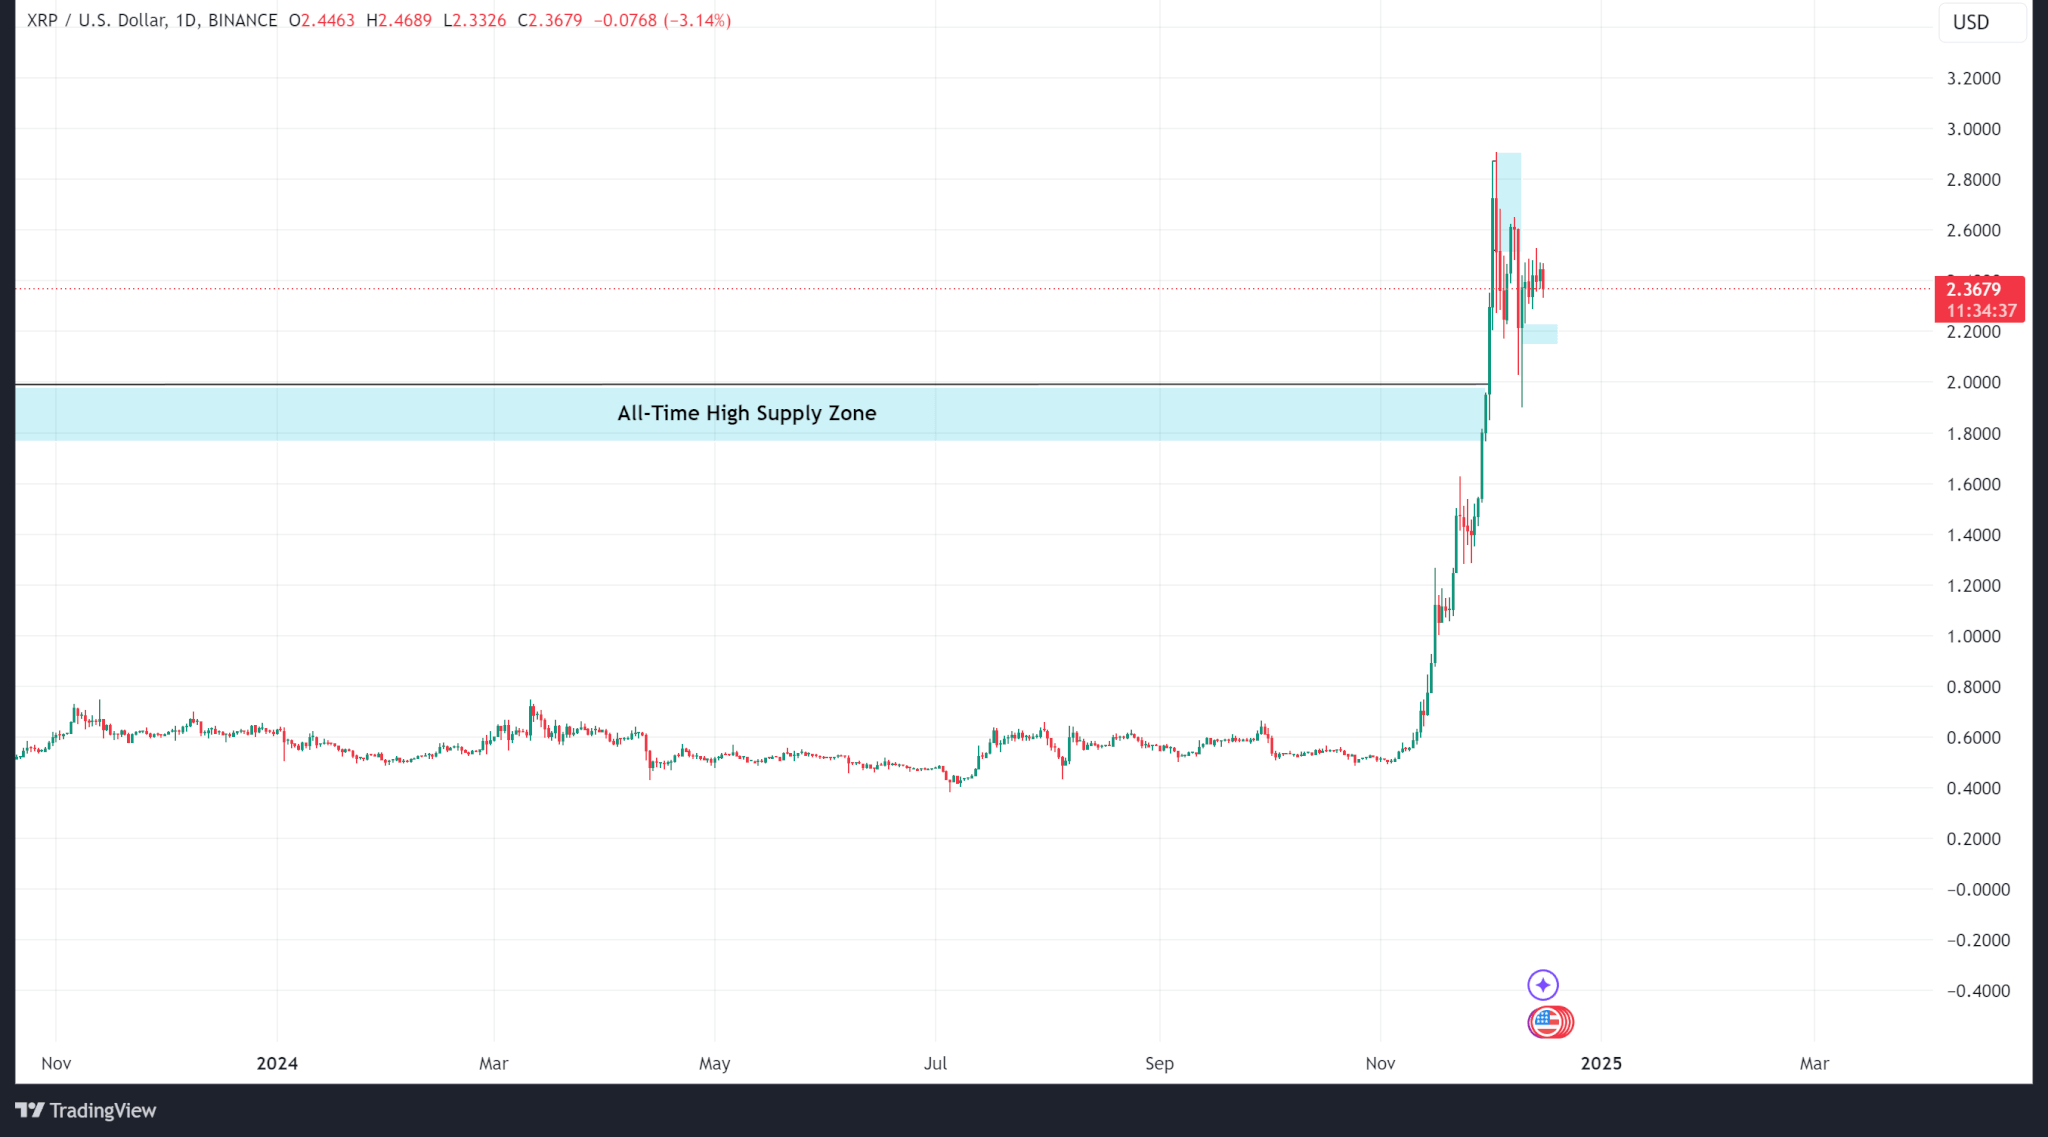
More recent price action shows a pullback from highs as the price formed a new local supply zone, rejected, and sold from it. A continuation of the current trend would see price take liquidity at the $1.90 level while a reversal would see price break above $2.65.

Weekly Price Analysis: The Market Recovers from Technical Selloff image 5

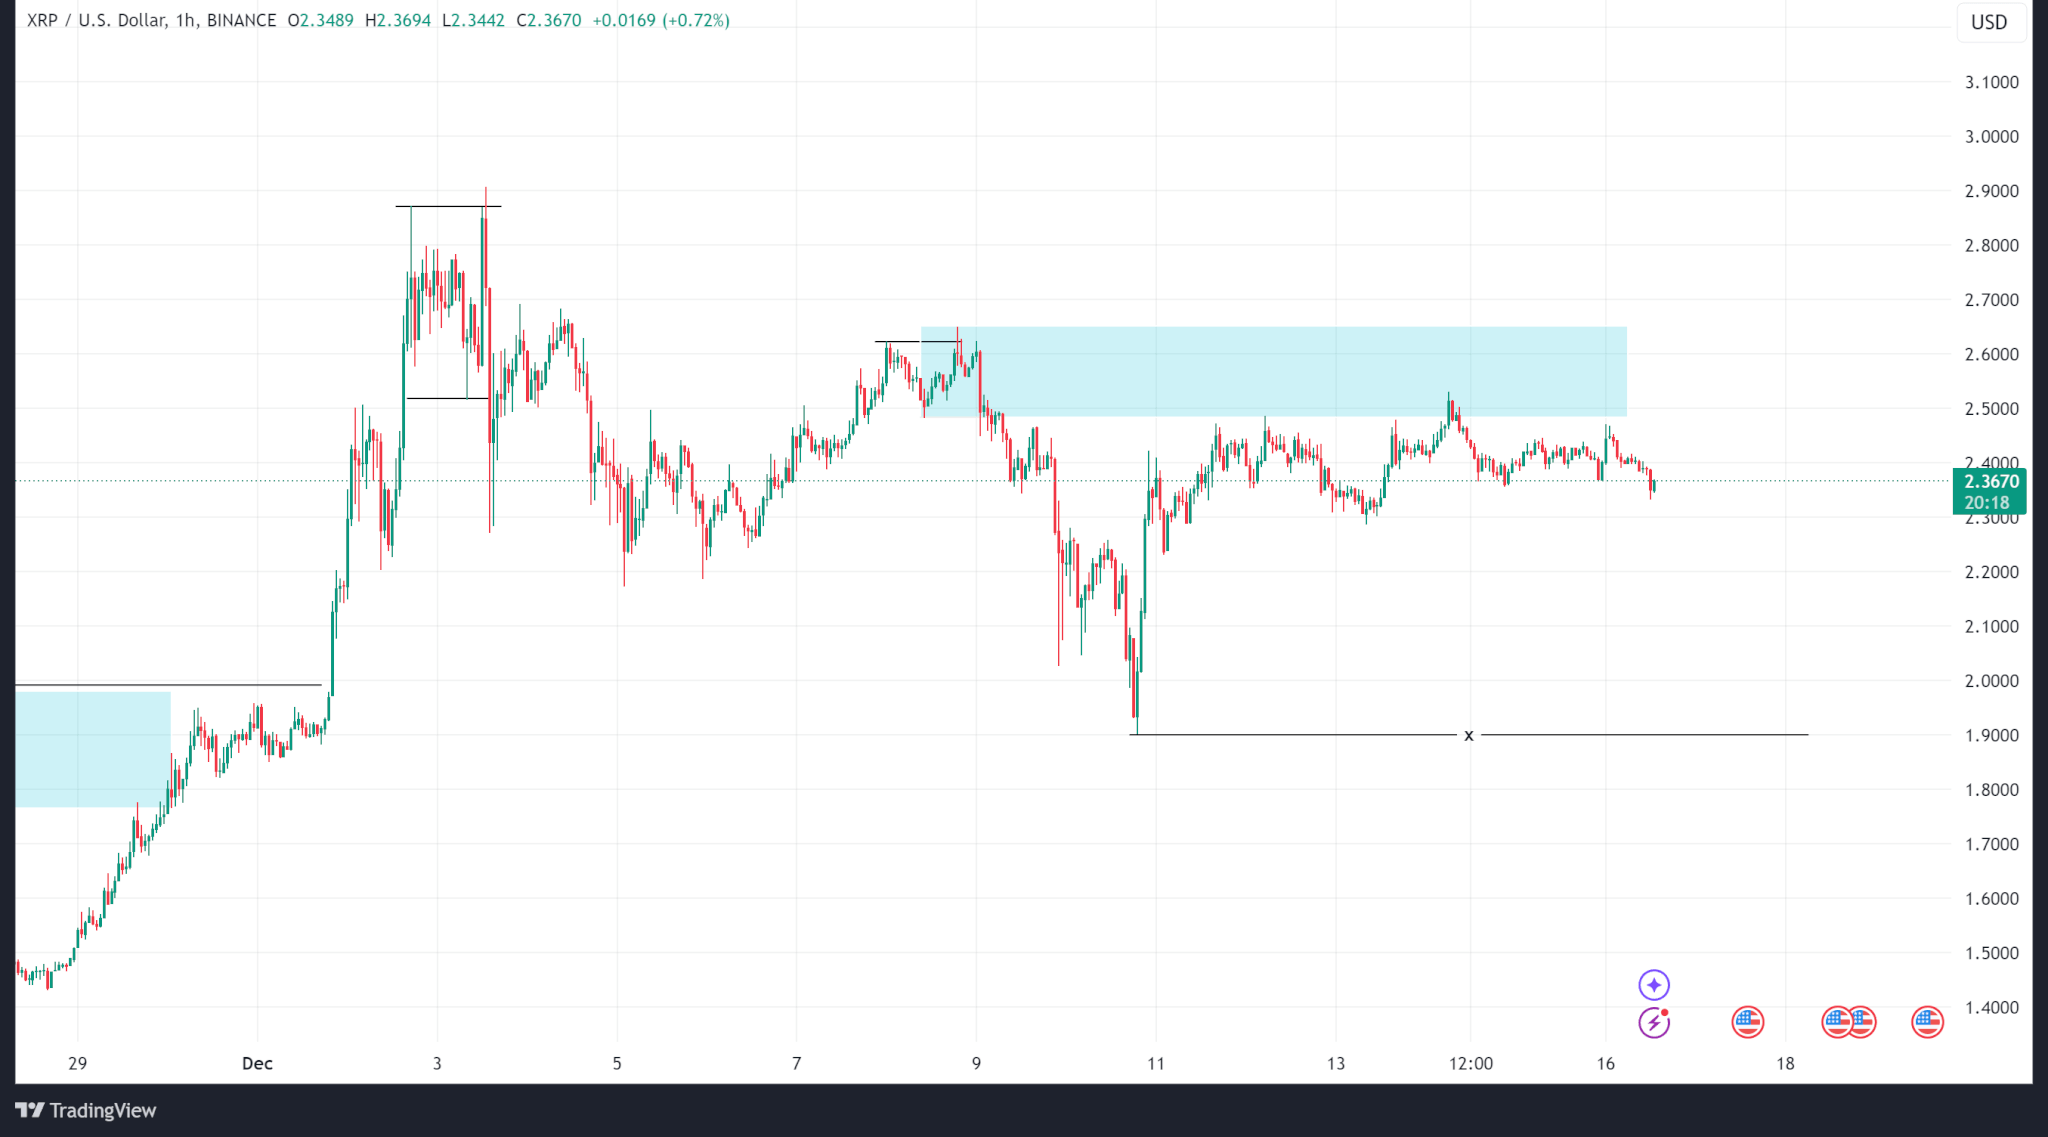
Ripple trades at $2.36 at the time of publishing.

Disclaimer: The content of this article solely reflects the author's opinion and does not represent the platform in any capacity. This article is not intended to serve as a reference for making investment decisions.
PoolX: Earn new token airdrops
Lock your assets and earn 10%+ APR
Lock now!

You may also like

New spot margin trading pair — HOLO/USDT!
Bitget Announcement2025/09/12 07:46
FUN drops by 32.34% within 24 hours as it faces a steep short-term downturn

- FUN plunged 32.34% in 24 hours to $0.008938, marking a 541.8% monthly loss amid prolonged bearish trends. - Technical breakdowns, elevated selling pressure, and forced liquidations highlight deteriorating market sentiment and risk-off behavior. - Analysts identify key support below $0.0080 as critical, with bearish momentum confirmed by RSI (<30) and MACD indicators. - A trend-following backtest strategy proposes short positions based on technical signals to capitalize on extended downward trajectories.

Bitget-RWA2025/09/12 06:14
OPEN has dropped by 189.51% within 24 hours during a significant market pullback

- OPEN's price plummeted 189.51% in 24 hours to $0.8907, marking its largest intraday decline in history. - The token fell 3793.63% over 7 days, matching identical monthly and yearly declines, signaling severe bearish momentum. - Technical analysts cite broken support levels and lack of bullish catalysts as key drivers of the sustained sell-off. - Absence of stabilizing volume or reversal patterns leaves the market vulnerable to further downward pressure.

Bitget-RWA2025/09/12 06:14
New spot margin trading pair — LINEA/USDT!
Bitget Announcement2025/09/11 10:04

Trending news

More
1
New spot margin trading pair — HOLO/USDT!
2
FUN drops by 32.34% within 24 hours as it faces a steep short-term downturn

Crypto prices

More
Bitcoin
Bitcoin
BTC
$115,812.2
+0.60%
Ethereum
Ethereum
ETH
$4,656.37
+2.62%
XRP
XRP
XRP
$3.14
+3.71%
Tether USDt
Tether USDt
USDT
$1
+0.03%
BNB
BNB
BNB
$937.12
+3.29%
Solana
Solana
SOL
$239.39
+0.40%
USDC
USDC
USDC
$0.9998
+0.01%
Dogecoin
Dogecoin
DOGE
$0.2991
+12.67%
Cardano
Cardano
ADA
$0.9408
+5.37%
TRON
TRON
TRX
$0.3500
+0.50%
How to sell PI
Bitget lists PI – Buy or sell PI quickly on Bitget!
Trade now
Become a trader now?A welcome pack worth 6200 USDT for new users!
Sign up now
Trade smarter