Bitcoin Price Struggles Below $100,000: What This Means for the Next Bull Run
Bitcoin has experienced significant price swings in the past 24 hours, briefly surpassing the $100,000 mark before retracing. The sudden drop reflects the ongoing market uncertainty, with traders reacting to short-term volatility.
However, long-term stability appears to be taking shape, largely supported by mature investors holding onto their positions.
Bitcoin has Taken A Different Approach
The RHODL (Realized HODL) ratio since Bitcoin’s recent all-time high (ATH) sits at 23%. While new demand remains significant in this cycle, the wealth held in coins older than three months is much lower than in previous cycles. This suggests that new demand inflows have been occurring in bursts rather than in a sustained pattern.
Unlike previous market cycles, which typically concluded one year after the first ATH break, the current cycle has taken an atypical trajectory. Bitcoin first reached a new ATH in March 2024, yet demand has yet to match the levels seen in past rallies. This deviation raises questions about how the rest of the cycle will unfold.
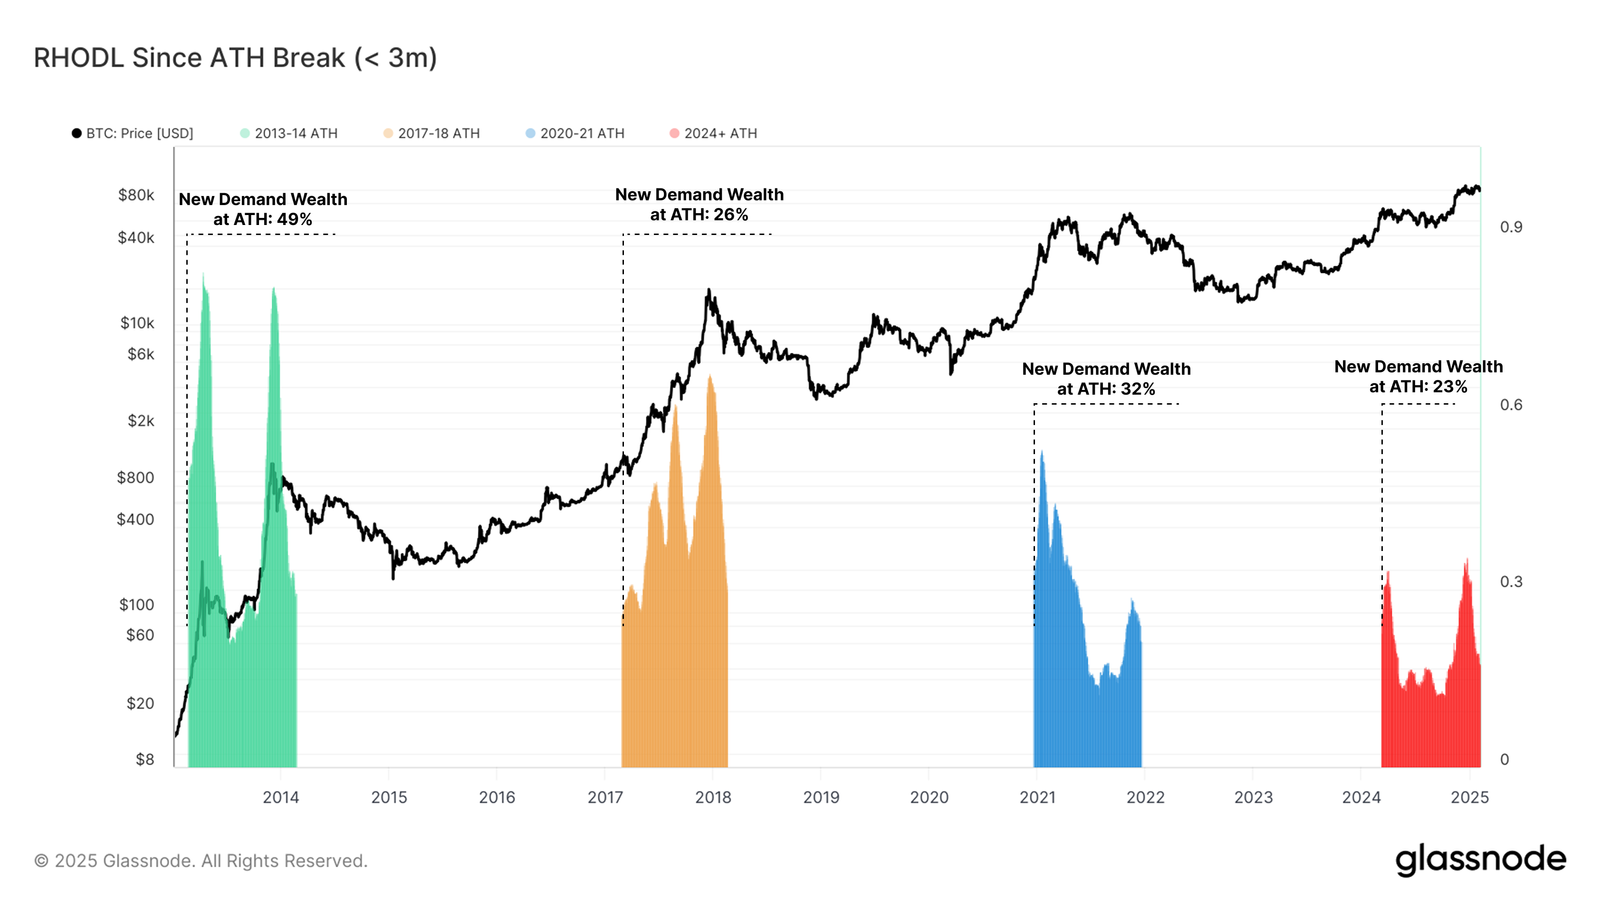 RHODL Since ATH. Source: Glassnode
 Realized volatility on a three-month rolling window remains below 50% in this cycle. In contrast, past bull runs saw volatility levels exceeding 80% to 100%. This reduction in volatility suggests that Bitcoin’s price action is more structured, with mature investors contributing to a more stable market environment.
The 2023-25 cycle has followed a stair-stepping pattern, with price rallies followed by consolidation periods. Unlike previous cycles characterized by extreme swings, Bitcoin’s current trajectory exhibits signs of gradual price increases. This trend supports a more controlled bull market, reducing the risk of extreme crashes.
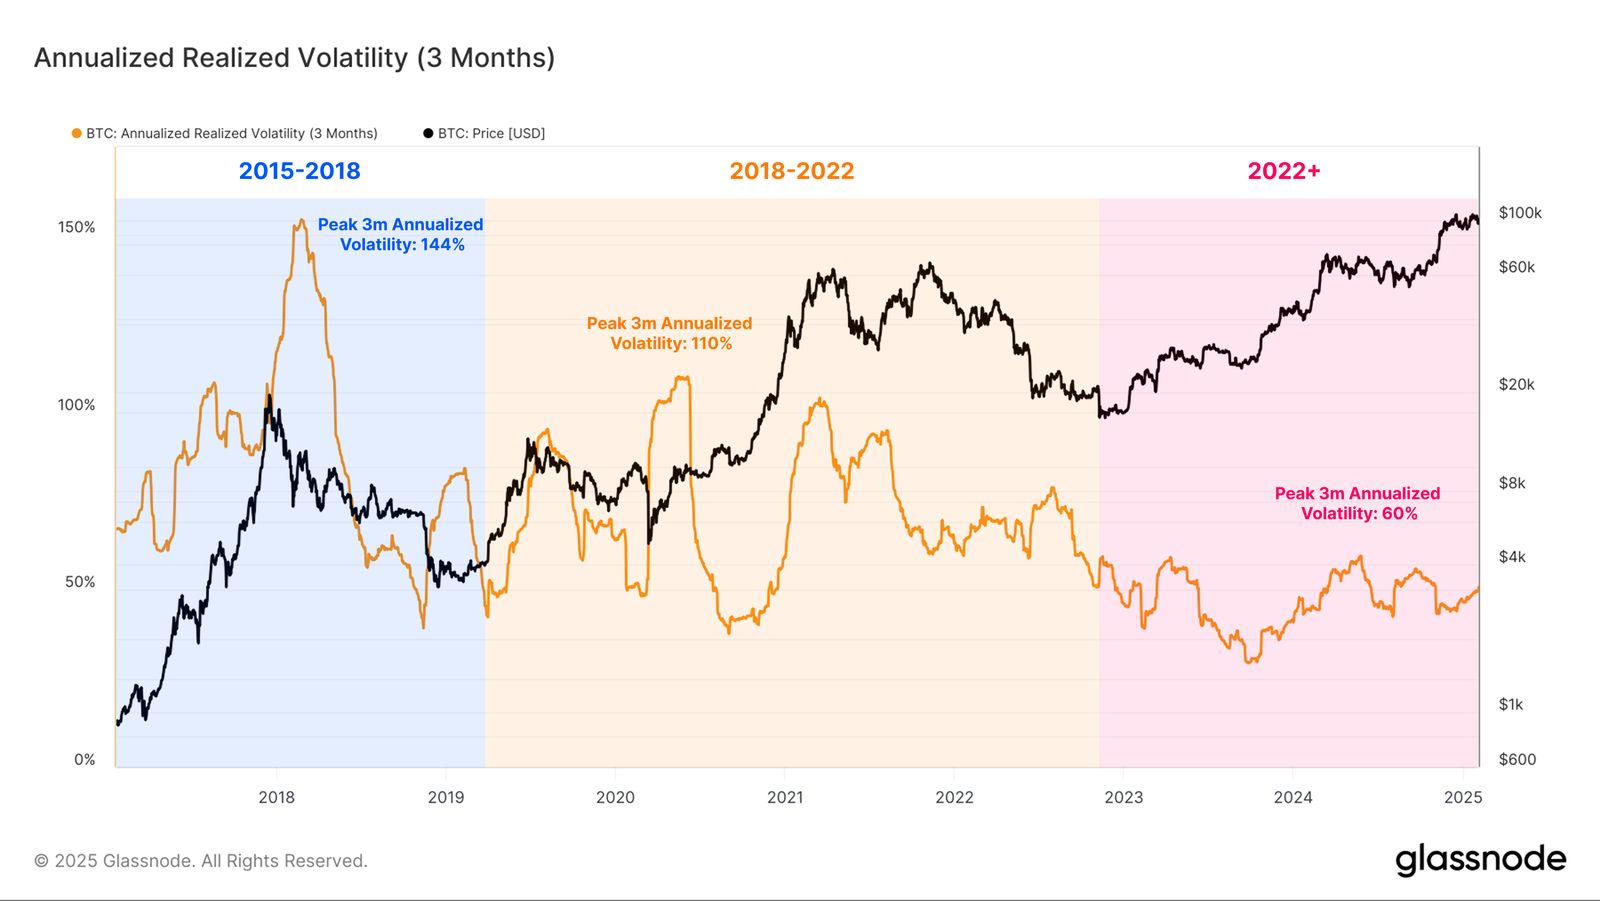 Bitcoin Realized Volatility. Source: Glassnode
 BTC Price Prediction: Holding Above A Crucial Support
Although Bitcoin’s long-term outlook remains uncertain due to rising short-term volatility, the immediate forecast suggests vulnerability to correction. The cryptocurrency is trading close to key support levels, and further declines could lead to a deeper retracement.
If Bitcoin loses the $95,869 support level, it may drop toward $93,625. While BTC holders have refrained from significant profit-taking, further losses could trigger a wave of selling. This scenario would put additional pressure on the price, extending Bitcoin’s correction.
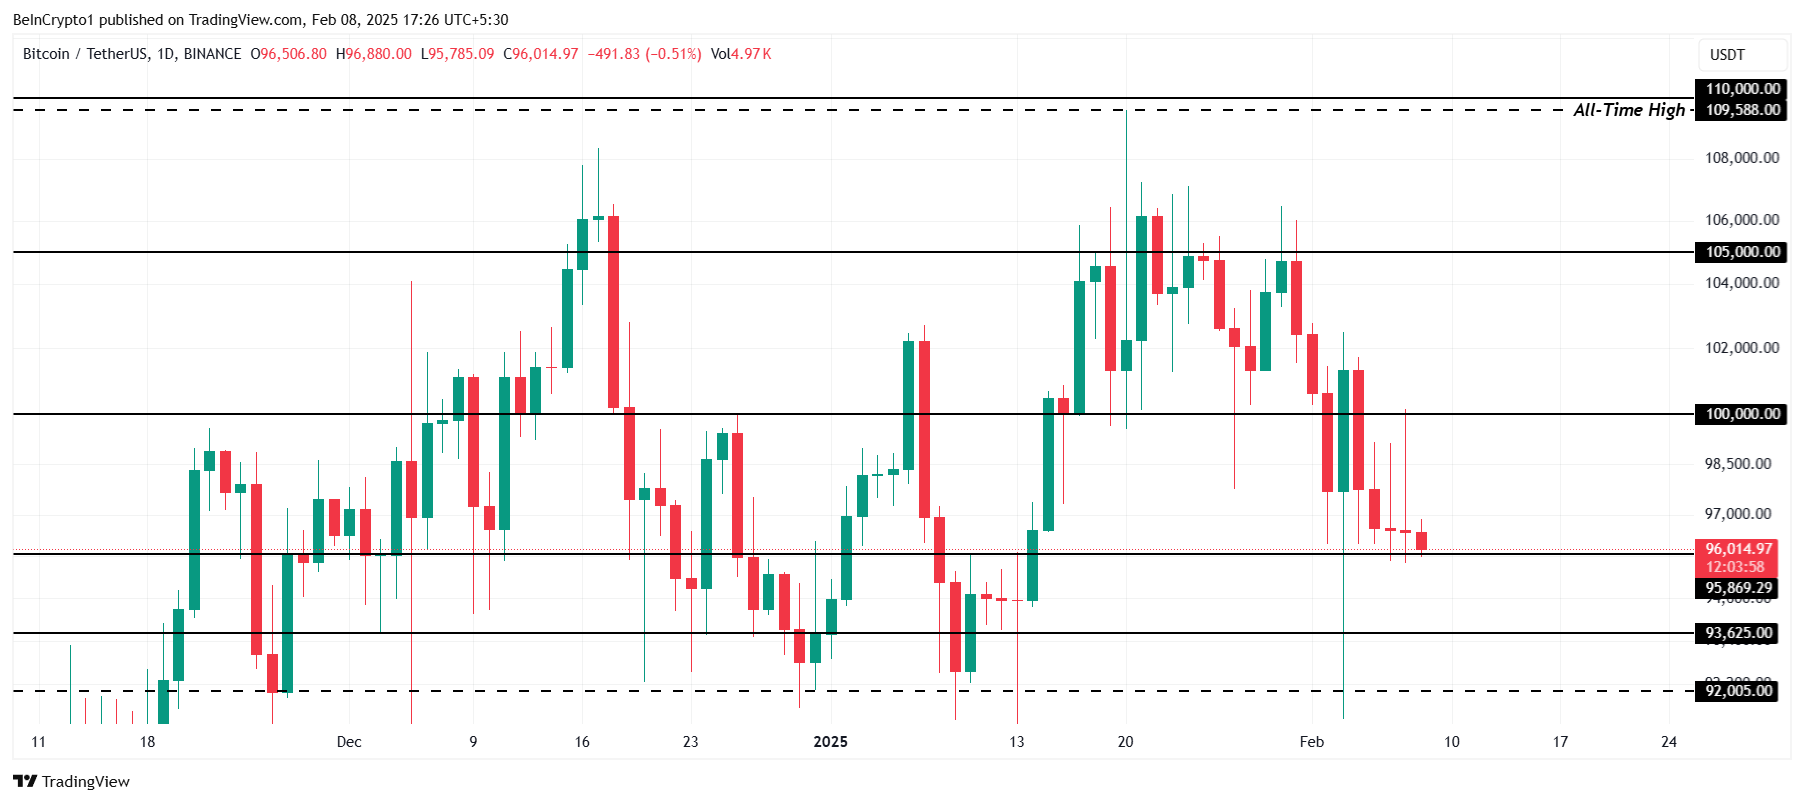 Bitcoin Price Analysis. Source: TradingView
 On the other hand, a bounce off $95,869 could enable Bitcoin to reclaim the $100,000 level. Successfully breaching this psychological barrier would invalidate the bearish outlook, potentially setting the stage for a renewed uptrend.