Date: Sun, February 9, 2025 | 08:12 AM GMT
The cryptocurrency market is showing signs of recovery today, with major memecoins and altcoins bouncing back after weeks of corrections. The recent downturn was largely driven by the launch of DeepSeek and tariff policies introduced by Donald Trump, which created bearish sentiment across the market.
However, with today’s rebound, top memecoins like Bonk (BONK) and Floki (FLOKI) are back in the green. BONK has gained 7%, while FLOKI has surged 12%, both reclaiming key support levels after suffering heavy losses of over 36% and 41% in the past month. Now, both tokens are flashing signs of a potential trend reversal.
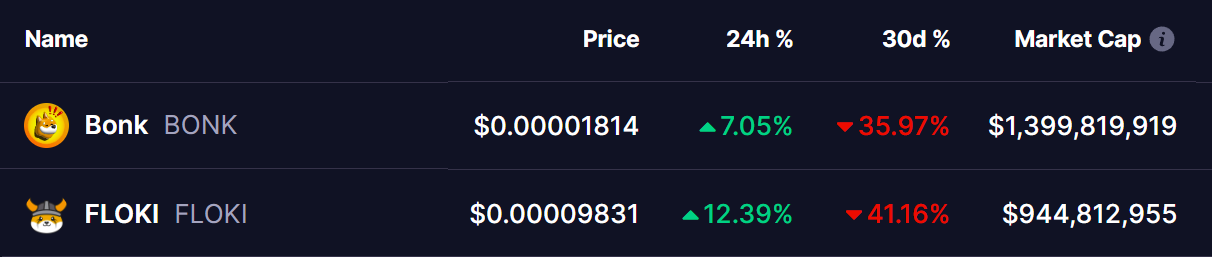 Source: Coinmarketcap
 Bonk (BONK)
BONK’s daily chart reveals that the price action has been moving within a descending triangle pattern, which was formed following a rejection from the $0.000060 level on November 6.
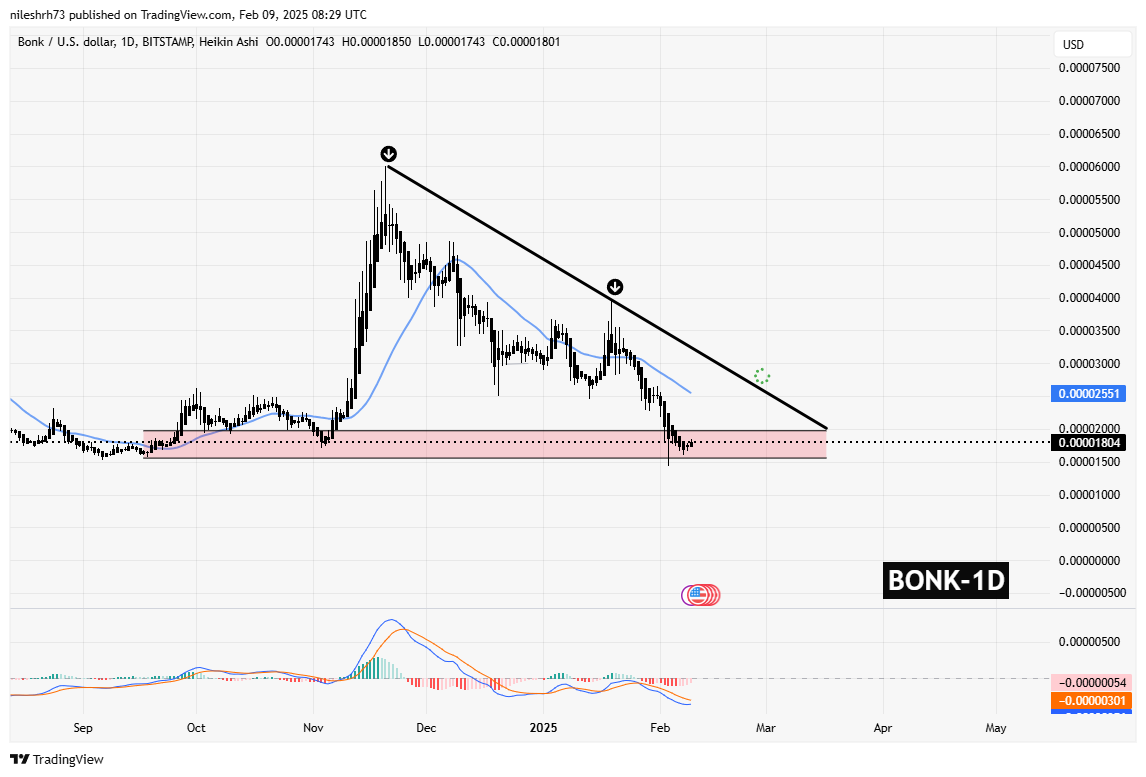 Bonk (BONK) Daily Chart/Coinsprobe (Source: Tradingview)
 The correction intensified after DeepSeek’s launch and geopolitical uncertainties, including Trump’s tariff policies, leading to a sharp sell-off across risk assets. As a result, BONK tested the crucial support zone of the triangle, reaching a low of $0.00001430.
However, the price has now rebounded to $0.000018, showing early signs of upside momentum. The MACD is flipping bullish, indicating potential strength in the trend.
If BONK continues this recovery and manages to break above its 25-day Simple Moving Average (SMA), it could pave the way for a retest of the upper resistance level of the triangle at $0.000027.
Floki (FLOKI)
Like BONK, FLOKI has also been trading within a descending triangle pattern since its June 2024 high of $0.00034.
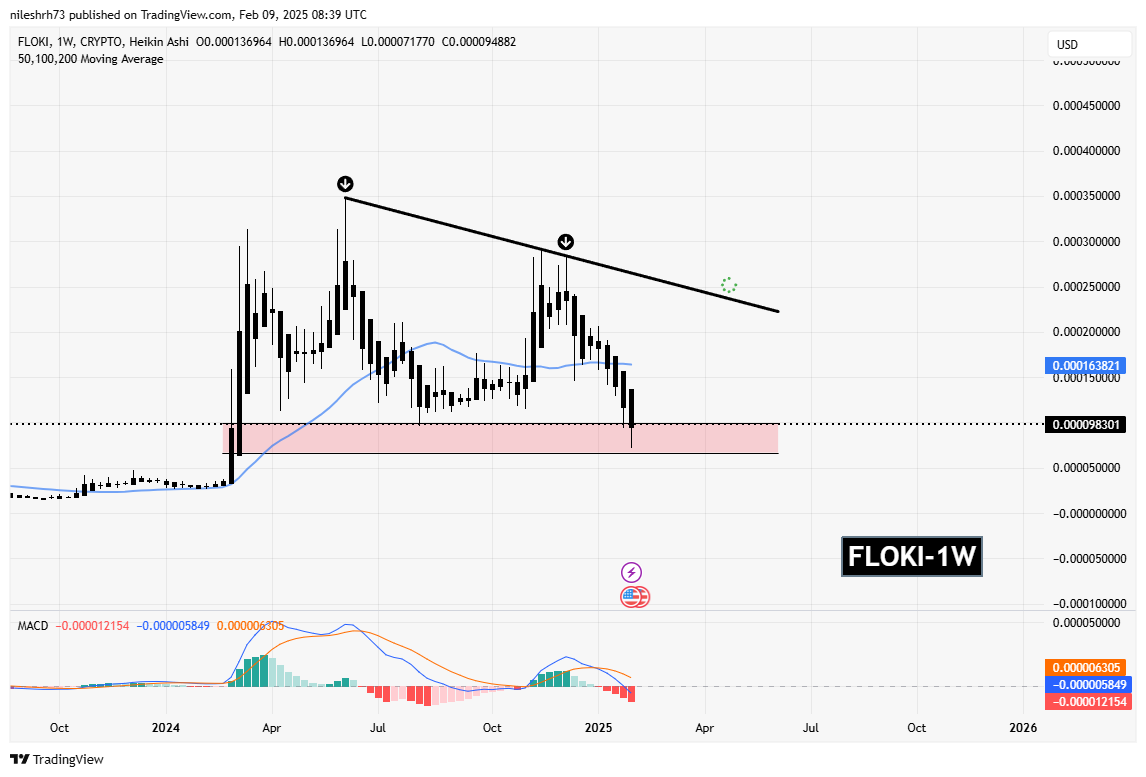 Floki (FLOKI) Weekly Chart/Coinsprobe (Source: Tradingview)
 The recent downtrend saw FLOKI testing its crucial support trendline, dropping to a low of $0.000071. However, the token has now bounced back to $0.000098, displaying promising upside momentum.
The MACD is also signaling a potential reversal, and if FLOKI manages to break above its 25-day SMA, it could trigger a rally toward the upper resistance of the triangle at $0.00023.
Is a Rebound Ahead?
Both BONK and FLOKI are holding their ground at crucial support levels and showing early signs of a potential trend reversal. The broader market, particularly Ethereum (ETH), which is currently trading at $2,670, will play a significant role in determining whether memecoins can sustain this recovery.
If ETH maintains its upward trajectory, we could see BONK and FLOKI break out of their triangle patterns, confirming a strong bullish reversal in the coming days.
Disclaimer: This article is for informational purposes only and does not constitute financial advice. Always conduct your own research before making any investment decisions.