Not only are the SP 500 and the Nasdaq being rejected from strong resistance levels, but gold is also. With such economic juggernauts facing further potential downside, what chance does Bitcoin have?
For Bitcoin and the crypto market to have the possibility to reverse the current downtrend, the U.S. stock market must surely start to turn around its own reversal. Even gold is now facing rejection from its all-time high of $3,060. Could Bitcoin be the first to buck the trend?
SP 500 - resistance is defeating the bulls so far
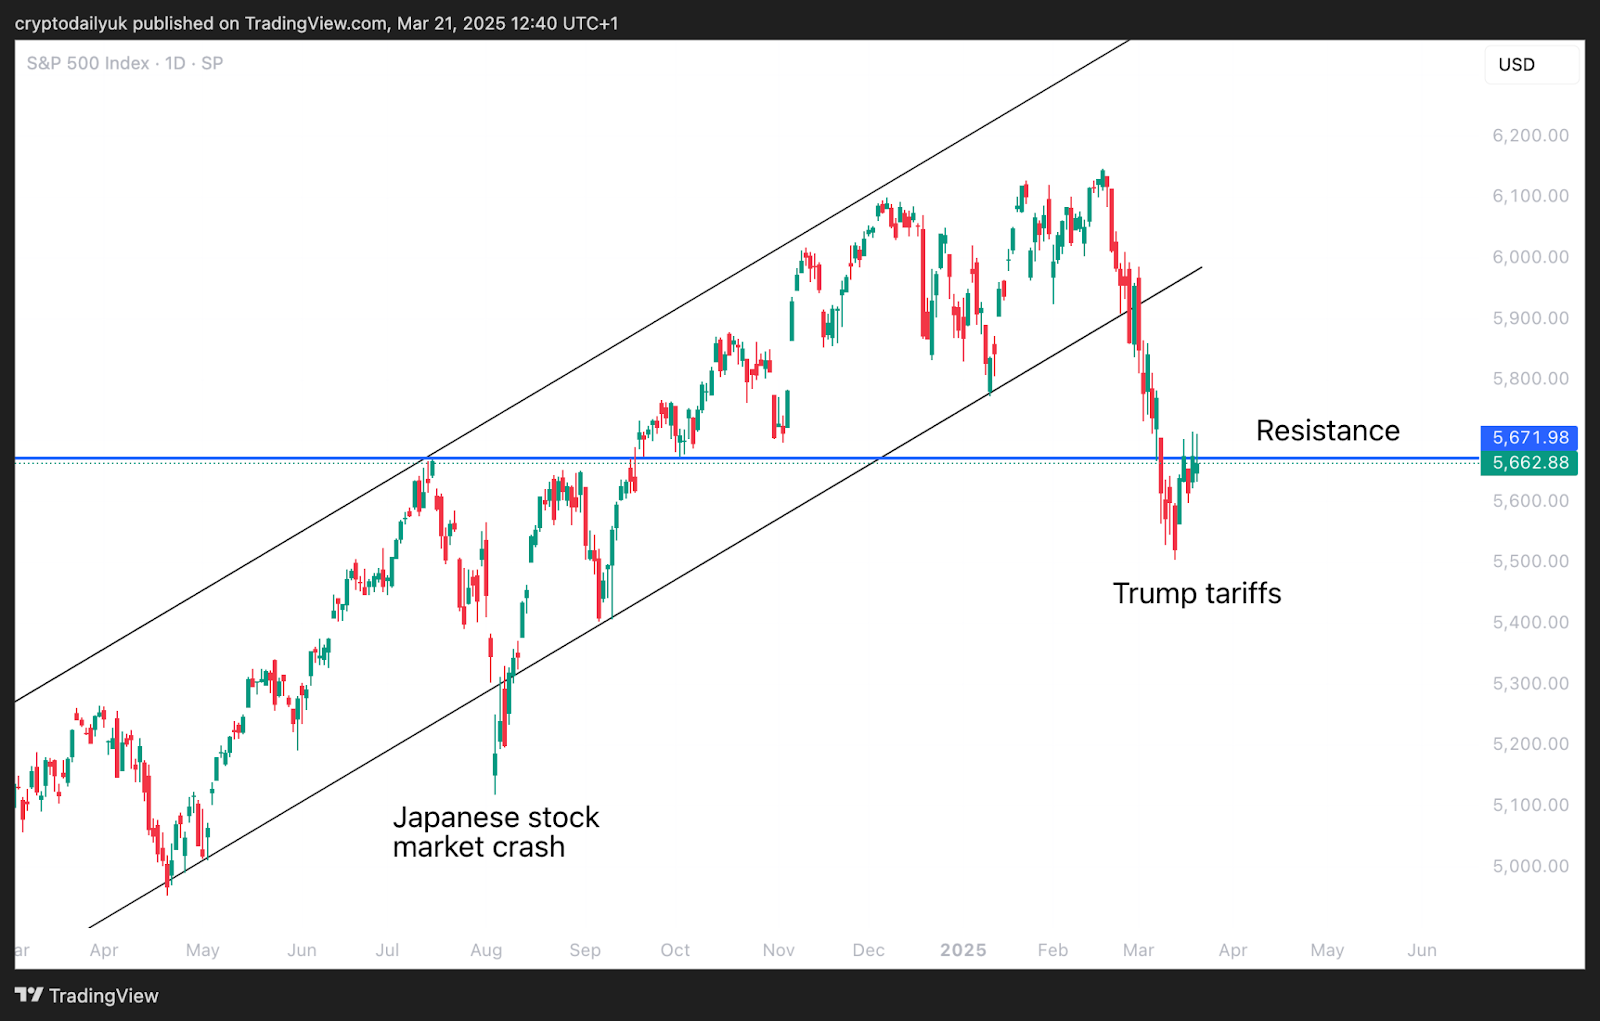
Source: TradingView
The price action for the SP 500 on the daily chart shows how the horizontal level at $5,670 has been flipped into resistance. The candle wicks up and through this resistance bears testament to just how hard the bulls are trying to break back through, but each time the bears are forcing the price back down again.
This current downward impulse is already starting to look a lot worse than the Japanese carry trade crash of last Summer. If this resistance level does prove the victor over the bulls at the end of play this week, and a weekly candle confirms below, the next major level of support at $5,400 becomes a possibility.
Nasdaq - index still remains below the ascending trendline
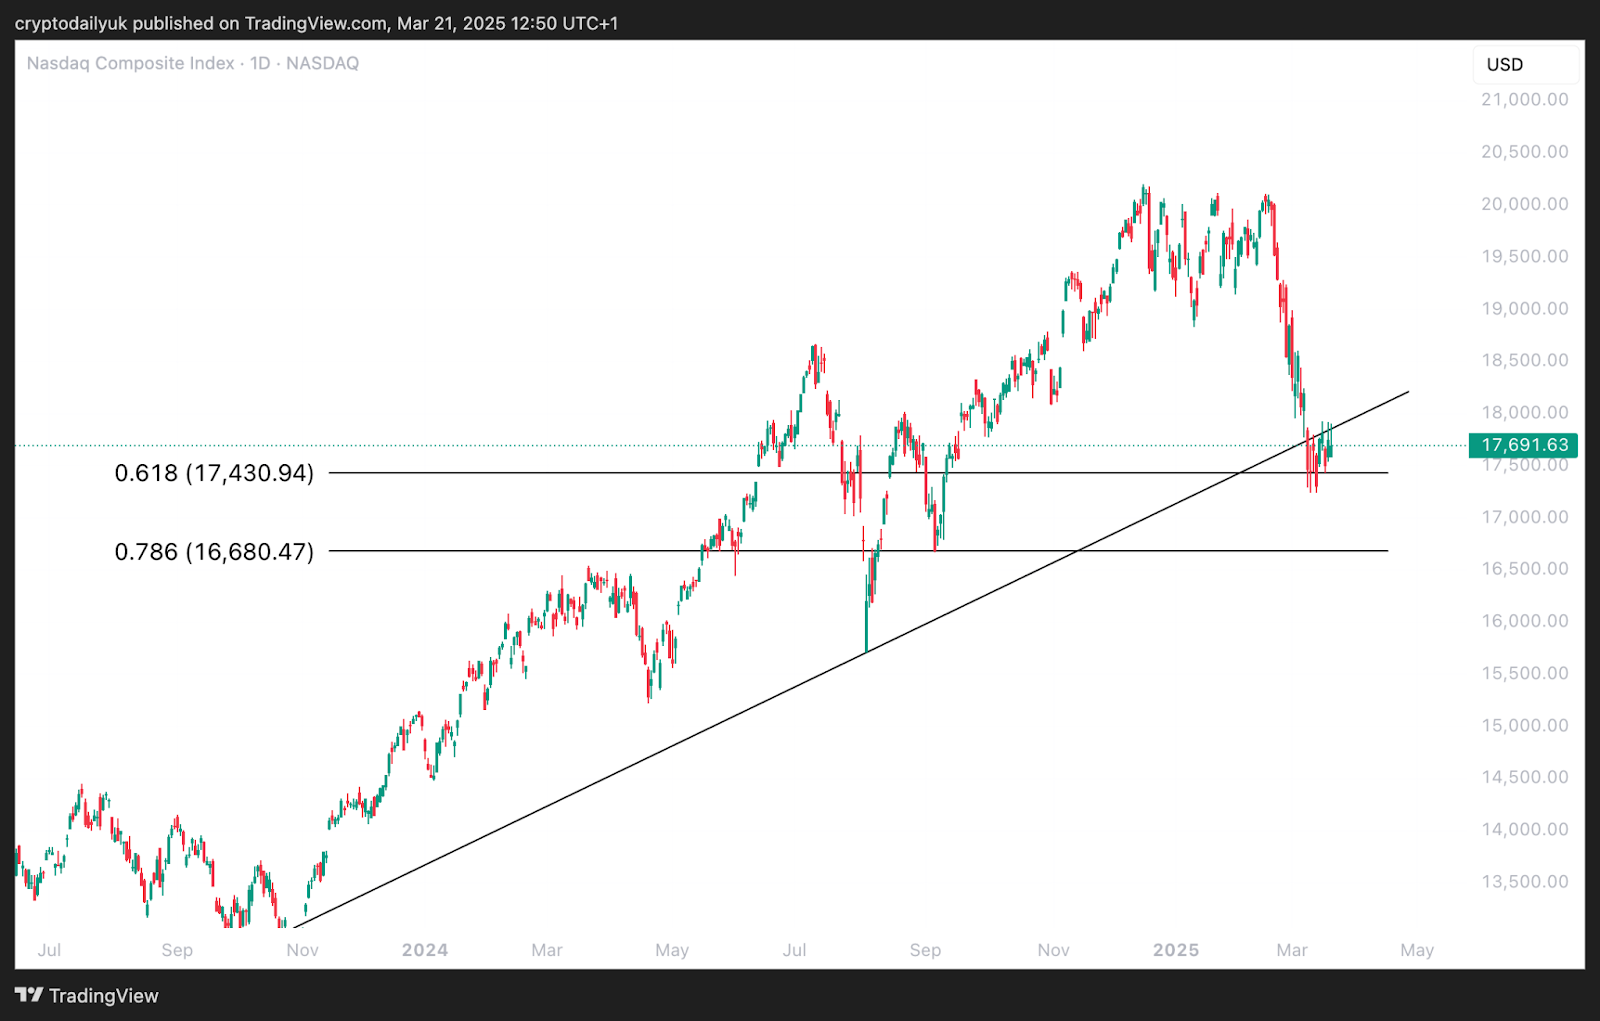
Source: TradingView
The Nasdaq Composite Index, shows a similar story. The index has already come down as much as 14.2%, and the price is currently being held below the ascending trendline. On a more positive note, the index does appear to be bottoming at the 0.618 Fibonacci, and clear horizontal support can be seen below which corresponds with the 0.786 Fibonacci retracement level. With AI really coming to the fore in 2025 it cannot be imagined that this tech-heavy index will stay down for too long.
Gold - price touches the top of the channel
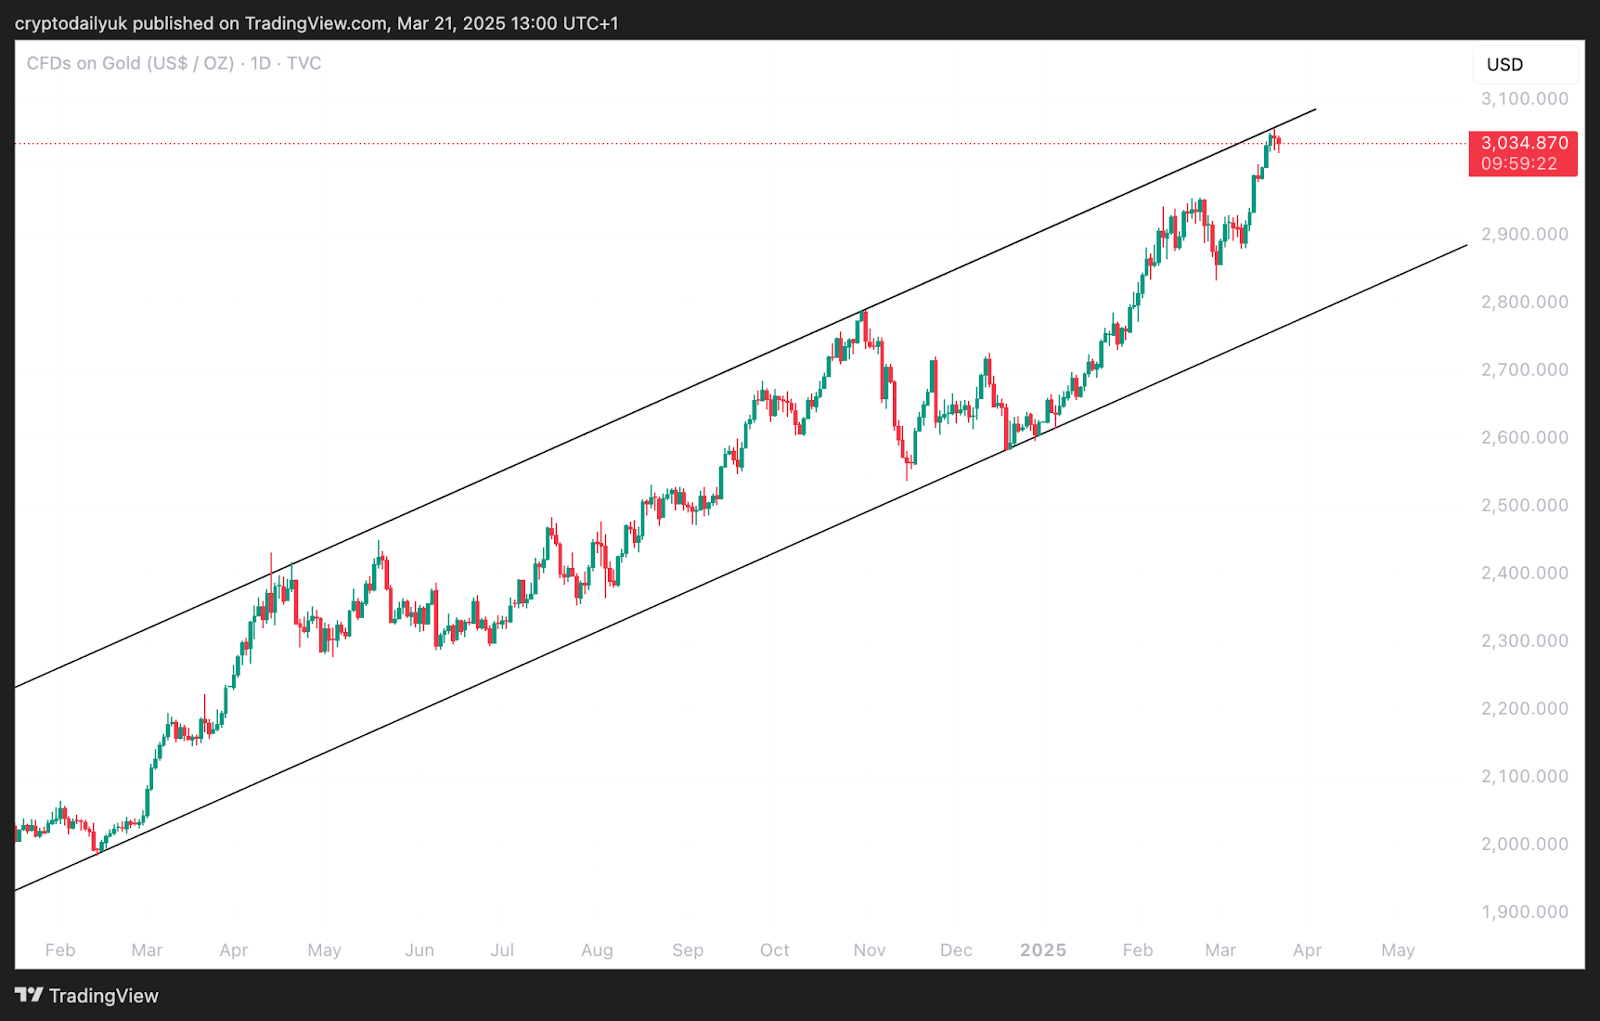
Source: TradingView
For gold, the daily chart is very clear indeed. The price has touched the very top of the ascending channel, and so it might be expected that a downward impulse takes shape from here. Nevertheless, with very positive market factors acting as a boost for gold, the price may not find the bottom of the channel before the next upside surge.
Will Trump want to see the stock market continue to fall?
In summary, these are the two most important U.S. stock indexes, and the biggest of the commodities. With all of them facing more potential downside price action, it will be very difficult for Bitcoin to move in the opposite direction.
That said, looking further out into 2025, it might be imagined that President Trump will not want to see his favourite economic indicator, in the U.S. stock market, continue to fall. There is very likely to be a method in the madness for this current downturn, and a big rally could be on the cards as tariffs get ironed out, and increasing market liquidity starts to have an effect. Bitcoin may be the first to take advantage.
Disclaimer: This article is provided for informational purposes only. It is not offered or intended to be used as legal, tax, investment, financial, or other advice.