Bitget App
Trade smarter
Open
HomepageSign up
Bitget>
News>
Hyperliquid (HYPE) Defends Key Support – Can This Pattern Spark a Rebound?

Hyperliquid (HYPE) Defends Key Support – Can This Pattern Spark a Rebound?

CoinsProbe2025/04/01 07:45
By: Nilesh Hembade
HYPE-1.21%ETH-1.02%GMT+1.62%

Date: Mon, March 31, 2025 | 03:30 PM GMT

The cryptocurrency market has faced significant selling pressure, with Ethereum (ETH) dropping over 11% in the past week. This decline has been driven by escalating global tariff tensions, creating a ripple effect across the altcoin sector. One of the hardest-hit tokens was Hyperliquid (HYPE), a decentralized derivatives exchange token, which fell over 22% due to whales exploiting its liquidation system.

To address this, Hyperliquid introduced key risk management updates, which have brought some relief to investors. The market has shown a slight recovery in the last few hours, with HYPE bouncing back into the green with a 5% surge, thanks to its successful defense of a critical support level.

Hyperliquid (HYPE) Defends Key Support – Can This Pattern Spark a Rebound? image 0 
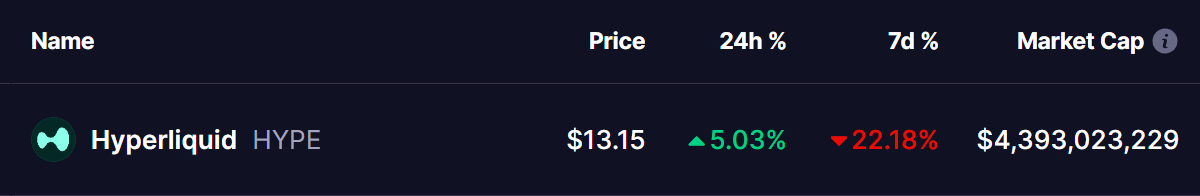
Source: Coinmarketcap

HYPE Defends Key Support

On the daily chart, HYPE has been forming a symmetrical triangle pattern since its rejection from its all-time high of $35.29 on December 21. This rejection triggered a steep correction, leading to a 65% decline and pushing the token down to its crucial ascending support level of $12.19.

Hyperliquid (HYPE) Defends Key Support – Can This Pattern Spark a Rebound? image 1 
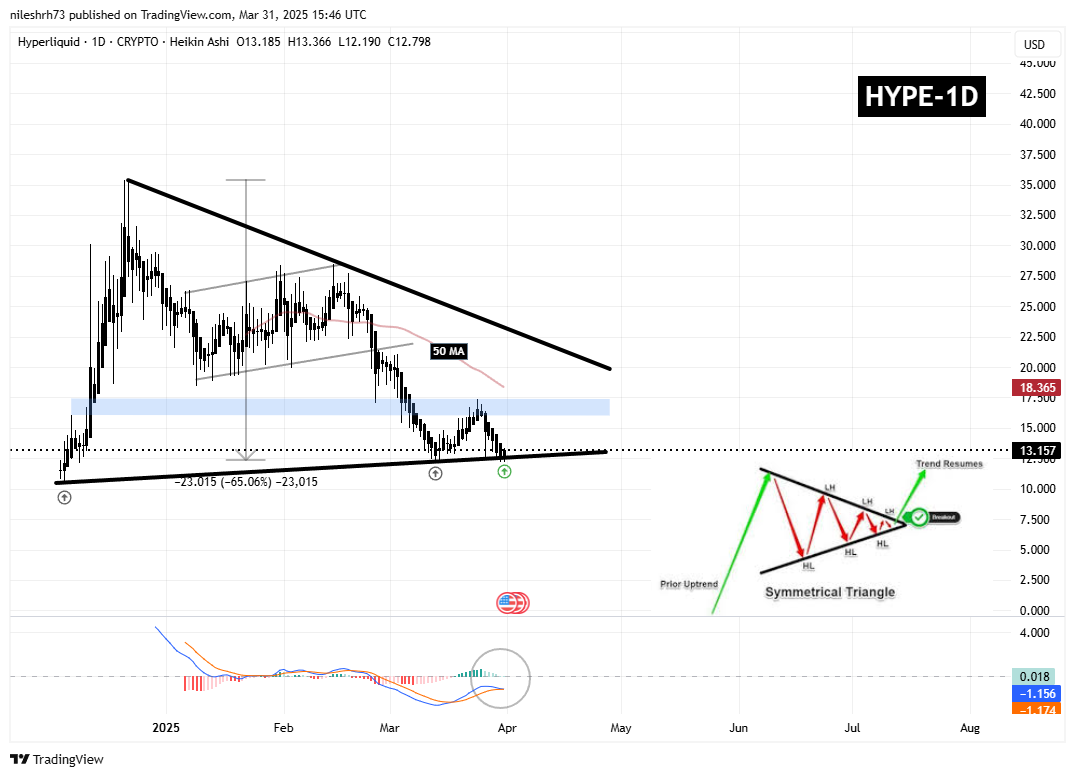
Hyperliquid (HYPE) Daily Chart/Coinsprobe (Source: Tradingview)

After testing this level, HYPE has managed to defend the support and bounce back to $13.15, showing resilience. The chart indicates that if this pattern holds, a potential breakout could be on the horizon. A move above the next resistance at $17.34, followed by the 50-day moving average (50 MA), could confirm an uptrend, setting the stage for a bullish reversal.

However, if HYPE fails to hold the $12.00 support range, it will invalidate the pattern, potentially inviting further downside toward the $10.50 support zone.

Looking at the MACD indicator on the daily timeframe, a bullish crossover appears to be forming. This suggests that momentum might shift in favor of buyers, increasing the likelihood of an upward breakout from the symmetrical triangle.

Can This Pattern Spark a Rebound?

The symmetrical triangle pattern is often a sign of consolidation before a breakout. If HYPE can maintain its ascending support and break above key resistance levels, a bullish reversal could take shape. The next few days will be critical in determining whether the price can push higher.

As always, traders should keep an eye on key resistance and support levels while considering broader market trends before making any investment decisions.

Disclaimer: This article is for informational purposes only and should not be considered financial advice. Always conduct your own research before investing in cryptocurrencies.

Disclaimer: The content of this article solely reflects the author's opinion and does not represent the platform in any capacity. This article is not intended to serve as a reference for making investment decisions.
PoolX: Earn new token airdrops
Lock your assets and earn 10%+ APR
Lock now!

You may also like

New spot margin trading pair — HOLO/USDT!
Bitget Announcement2025/09/12 07:46
FUN drops by 32.34% within 24 hours as it faces a steep short-term downturn

- FUN plunged 32.34% in 24 hours to $0.008938, marking a 541.8% monthly loss amid prolonged bearish trends. - Technical breakdowns, elevated selling pressure, and forced liquidations highlight deteriorating market sentiment and risk-off behavior. - Analysts identify key support below $0.0080 as critical, with bearish momentum confirmed by RSI (<30) and MACD indicators. - A trend-following backtest strategy proposes short positions based on technical signals to capitalize on extended downward trajectories.

Bitget-RWA2025/09/12 06:14
OPEN has dropped by 189.51% within 24 hours during a significant market pullback

- OPEN's price plummeted 189.51% in 24 hours to $0.8907, marking its largest intraday decline in history. - The token fell 3793.63% over 7 days, matching identical monthly and yearly declines, signaling severe bearish momentum. - Technical analysts cite broken support levels and lack of bullish catalysts as key drivers of the sustained sell-off. - Absence of stabilizing volume or reversal patterns leaves the market vulnerable to further downward pressure.

Bitget-RWA2025/09/12 06:14
New spot margin trading pair — LINEA/USDT!
Bitget Announcement2025/09/11 10:04

Trending news

More
1
New spot margin trading pair — HOLO/USDT!
2
FUN drops by 32.34% within 24 hours as it faces a steep short-term downturn

Crypto prices

More
Bitcoin
Bitcoin
BTC
$115,916.47
-0.15%
Ethereum
Ethereum
ETH
$4,658.67
-0.96%
XRP
XRP
XRP
$3.12
+0.24%
Tether USDt
Tether USDt
USDT
$1
-0.01%
Solana
Solana
SOL
$241.56
+0.01%
BNB
BNB
BNB
$931.22
+0.55%
USDC
USDC
USDC
$0.9998
+0.01%
Dogecoin
Dogecoin
DOGE
$0.2880
+3.80%
Cardano
Cardano
ADA
$0.9278
+1.35%
TRON
TRON
TRX
$0.3497
-0.68%
How to sell PI
Bitget lists PI – Buy or sell PI quickly on Bitget!
Trade now
Become a trader now?A welcome pack worth 6200 USDT for new users!
Sign up now
Trade smarter