- Stellar (XLM) is consolidating under trendline resistance.
- XLM Bulls eye a 50-70% rally if resistance breaks.
- Bearish warning: A “Death Cross” could trigger a 20% drop.
Stellar (XLM) is at a tipping point. After an 8% surge on Tuesday, Stellar (XLM) is consolidating under trendline resistance, setting the stage for a make-or-break move.
Stellar (XLM) Price Action: Approaching Key Trendline Resistance
As of April 2, Stellar (XLM) is trading at approximately $0.267 , down 4% today after an 8% rally on Tuesday, as increased trading volume reignited optimism among XLM holders.
Sponsored
The Ripple (XRP) competitor reached its lowest price in March at $0.25 on March 31 but has since been forming higher highs and higher lows, fueling hopes of a trend reversal.
Since reaching a multi-year high of $0.638 in November 2024, Stellar has been in a downtrend. Bulls attempted to reignite the uptrend in January, but resistance at $0.51 forced XLM lower. It has since been trading below the 200-day moving average (MA) at around $0.26.
However, on the daily timeframe, XLM is approaching a crucial inflection point—will it break trendline resistance, or face another rejection?
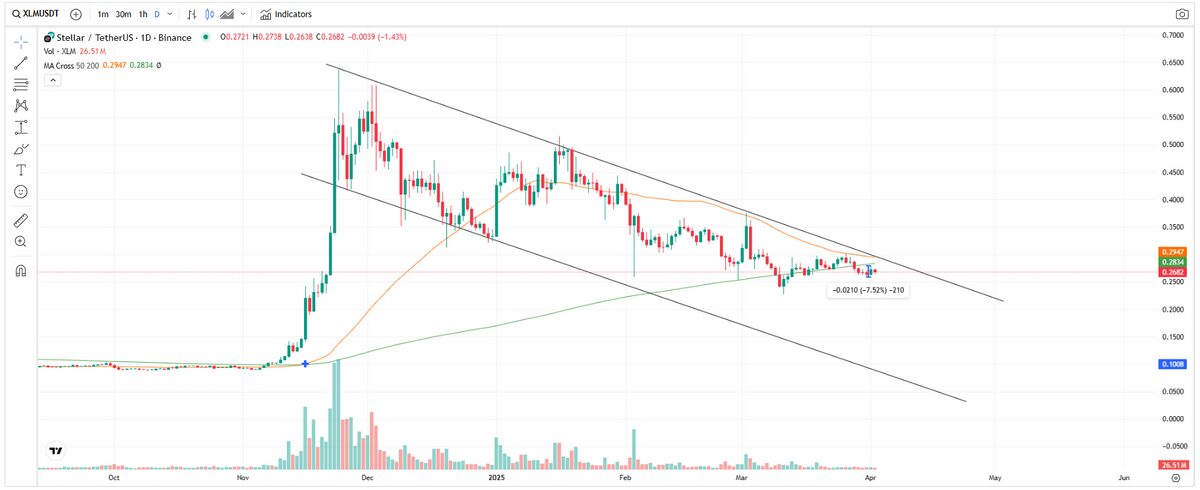 Stellar (XLM) price is getting closer to trendline resistance. Source: Tradingview
 The short-term price predictions for XLM vary among analysts.
Short-Term XLM Price Predictions: Bullish vs. Bearish Outlook
Bullish Scenario
Crypto trader CryptoCharts isn’t holding back, saying XLM could explode by 70% if the resistance level is broken.
“XLM is looking very strong here, at least in the short term. It is consolidating under trendline resistance, and a 50-70% bullish rally is expected after a successful breakout,” says crypto trader on X.
According to this projection, if XLM breaks above trendline resistance, the price could surge to $0.40 or even $0.46.
Bearish Scenario
Other analysts caution against a potential downside, at least in the short term.
One key concern is the position of the Moving Averages (MA) and the potential formation of a Death Cross . Technical analysis shows that the 50-day MA is nearing the 200-day MA, which could be a bearish signal.
If MA50 crosses below MA200, forming a Death Cross, it could trigger a 20% drop , sending XLM below its monthly low of $0.22.
In such a case, XLM could find potential support between $0.19 and $0.21.
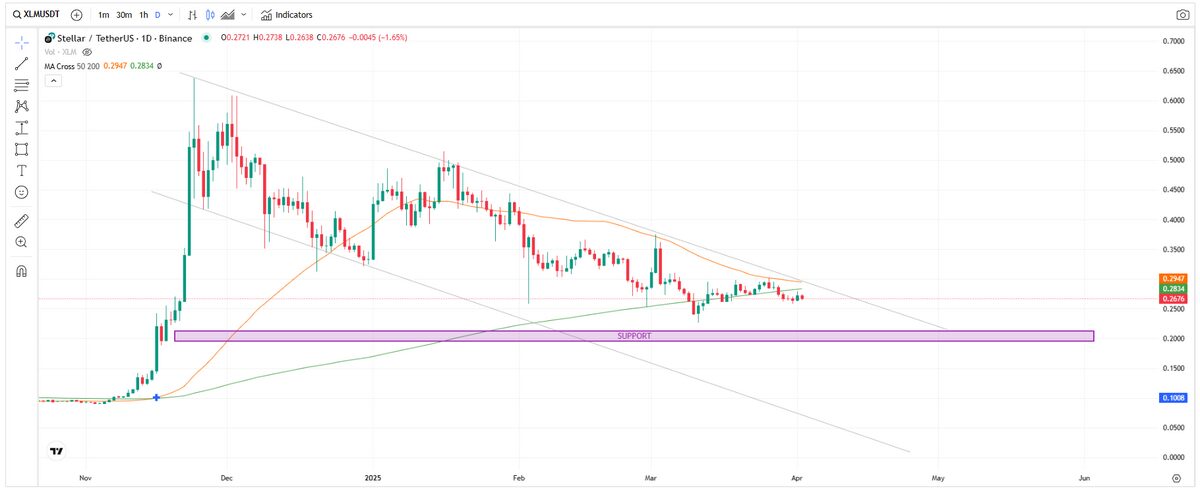 Stellar (XLM) price has potential support in the pessimistic scenario. Source: Tradingview
 Why This Matters
Stellar (XLM) is approaching a make-or-break moment. The price direction remains uncertain, given overall crypto market trends and the macroeconomic landscape—including Trump’s import tariffs on cars and auto parts announced today.
Read DailyCoin’s trending crypto stories:
Trump Family Starts Bitcoin Mining Venture, Confusing Market Watchers
HBAR Price Gearing Up For $1? Hedera Builds Institutional Chain