Bitget App
Trade smarter
Open
HomepageSign up
Bitget>
News>
Jupiter (JUP) Mirrors Key Fractal Pattern – Is a Bullish Rally on Horizon?

Jupiter (JUP) Mirrors Key Fractal Pattern – Is a Bullish Rally on Horizon?

CoinsProbe2025/04/12 14:55
By: Nilesh Hembade
AVAX-1.26%JUP-0.25%ETH-0.60%

Date: Sat, April 12, 2025 | 10:10 AM GMT

The cryptocurrency market has endured a brutal start to the year, with Ethereum (ETH) logging a staggering 51% drop in Q1 — its worst quarterly performance in years. This widespread downturn rippled across the entire altcoin and memecoin sectors. However, investor sentiment is beginning to shift following U.S. President Trump’s recent announcement of a 90-day tariff pause, a move that injected fresh optimism into the market.

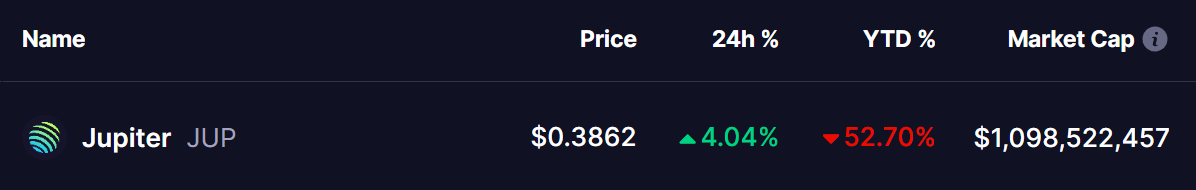
One token that appears to be taking advantage of the changing tide is Jupiter (JUP). After suffering a steep 52% decline this year, the decentralized exchange (DEX) token has bounced back with noticeable gain. But more importantly, traders are now noticing something far more intriguing — JUP’s chart structure is starting to mirror a key fractal from the past: Avalanche’s (AVAX) 2021.

Jupiter (JUP) Mirrors Key Fractal Pattern – Is a Bullish Rally on Horizon? image 0 Source: Coinmarketcap

JUP Chart Resembles AVAX’s Past Price Behavior

In 2021, Avalanche (AVAX) dropped nearly 84% from its peak before entering a long consolidation phase. During this time, the price moved sideways just below a descending trendline — a sign of accumulation. After several weeks of building a base, AVAX broke out with force and went on to rally over 700%, becoming one of the top-performing altcoins of that cycle.

AVAX and JUP Tokens Chart Comparison/Coinsprobe (Source: Tradingview)

Now, Jupiter (JUP) seems to be showing a very similar setup. The token has corrected about 84% from its highs, falling from around $1.84 to $0.31. Over the past week, JUP has been consolidating in a wide range under a descending resistance line — just like AVAX did. The MACD indicator is also starting to turn upward, hinting at weakening bearish momentum and a potential bullish crossover.

Is a Bullish Rally on Horizon?

If this historical fractal continues to play out, JUP may be entering the early stages of a massive bullish breakout. A clean move above the descending resistance line could confirm the end of the accumulation phase and signal the beginning of a steep uptrend. Based on the projected structure of the AVAX fractal, JUP could be eyeing a price target around $2.50 — a level that would represent over 550% gains from current prices.

While there are no guarantees in technical analysis, fractals like these often reflect repeating patterns of collective market psychology. The close resemblance between AVAX’s breakout structure and JUP’s current price action offers a compelling case that a powerful rally may soon unfold.

Disclaimer: This article is for informational purposes only and not financial advice. Always conduct your own research before investing in cryptocurrencies

Disclaimer: The content of this article solely reflects the author's opinion and does not represent the platform in any capacity. This article is not intended to serve as a reference for making investment decisions.
PoolX: Earn new token airdrops
Lock your assets and earn 10%+ APR
Lock now!

You may also like

New spot margin trading pair — HOLO/USDT!
Bitget Announcement2025/09/12 07:46
FUN drops by 32.34% within 24 hours as it faces a steep short-term downturn

- FUN plunged 32.34% in 24 hours to $0.008938, marking a 541.8% monthly loss amid prolonged bearish trends. - Technical breakdowns, elevated selling pressure, and forced liquidations highlight deteriorating market sentiment and risk-off behavior. - Analysts identify key support below $0.0080 as critical, with bearish momentum confirmed by RSI (<30) and MACD indicators. - A trend-following backtest strategy proposes short positions based on technical signals to capitalize on extended downward trajectories.

Bitget-RWA2025/09/12 06:14
OPEN has dropped by 189.51% within 24 hours during a significant market pullback

- OPEN's price plummeted 189.51% in 24 hours to $0.8907, marking its largest intraday decline in history. - The token fell 3793.63% over 7 days, matching identical monthly and yearly declines, signaling severe bearish momentum. - Technical analysts cite broken support levels and lack of bullish catalysts as key drivers of the sustained sell-off. - Absence of stabilizing volume or reversal patterns leaves the market vulnerable to further downward pressure.

Bitget-RWA2025/09/12 06:14
New spot margin trading pair — LINEA/USDT!
Bitget Announcement2025/09/11 10:04

Trending news

More
1
New spot margin trading pair — HOLO/USDT!
2
FUN drops by 32.34% within 24 hours as it faces a steep short-term downturn

Crypto prices

More
Bitcoin
Bitcoin
BTC
$115,922.49
-0.04%
Ethereum
Ethereum
ETH
$4,644.17
-1.50%
XRP
XRP
XRP
$3.07
-2.99%
Tether USDt
Tether USDt
USDT
$1
-0.01%
Solana
Solana
SOL
$246.56
+1.85%
BNB
BNB
BNB
$933.75
-0.64%
USDC
USDC
USDC
$0.9998
+0.00%
Dogecoin
Dogecoin
DOGE
$0.2868
-2.84%
TRON
TRON
TRX
$0.3495
-0.99%
Cardano
Cardano
ADA
$0.9076
-3.65%
How to sell PI
Bitget lists PI – Buy or sell PI quickly on Bitget!
Trade now
Become a trader now?A welcome pack worth 6200 USDT for new users!
Sign up now
Trade smarter