Bitget App
Trade smarter
Open
HomepageSign up
Bitget>
News>
Bitcoin Range Vs. Altcoin Surge: Key Crypto Charts Analyzed

Bitcoin Range Vs. Altcoin Surge: Key Crypto Charts Analyzed

CoinEdition2025/04/18 16:00
By: Parth Dubey
BTC-0.14%SOL-0.65%ETH-1.11%
Bitcoin is trading just above key support, with analysts eyeing $86,000 for a breakout. ETH is below a historically crucial buying level as SOL shows strength due to reduced exchange supply. The total crypto market cap excluding Bitcoin (TOTAL2) has broken out of a bullish falling wedge.
  • Bitcoin is trading just above key support, with analysts eyeing $86,000 for a breakout.
  • ETH is below a historically crucial buying level as SOL shows strength due to reduced exchange supply.
  • The total crypto market cap excluding Bitcoin (TOTAL2) has broken out of a bullish falling wedge.

Bitcoin is locked in a tight trading range, hovering just above key support. Priced near $85,190 , BTC holds above the critical $83,627 level. This consolidation has traders on alert, watching for a push past $86,000 resistance or a fall below $83,000 support.

What Are Bitcoin and Ethereum Signals Showing?

Analyst Ali Martinez notes a BTC surge above $91,275 (STH realized price) would signal bullish continuation.

Adding weight to the bullish case, Bitcoin whales (100+ BTC wallets) buy over 3x daily new supply, adding support.

Related: Four Bullish Reasons That Could Soon Flip The Crypto Market

Meanwhile, Ethereum (ETH) is trading at $1,596.45, battling resistance at its 20-day EMA near $1,668. Martinez notes ETH is below its lower MVRV band, a historical buy zone for long-term investors.

How Are Top Altcoins Performing?

Solana shows notable strength, up nearly 4% today. Lookonchain reports Galaxy Digital withdrew 606k SOL ($79.7M) and staked 462k SOL ($60M) recently, reducing available supply. 

This reduction in liquid supply has contributed to SOL’s outperformance against BTC and ETH.

Other major altcoins are also attempting to regain technical footing. Binance Coin (BNB) is at $590.26, XRP at $2.084, and Cardano (ADA) at $0.6283—each striving to reclaim their respective 20-day EMAs ($589, $2.08, and $0.6277).

Is An ‘Altseason’ Starting?

The broader altcoin market shows bullish signs. The TOTAL2 chart (market cap ex-BTC) recently broke out from a falling wedge, supported by rising MACD, higher lows.

Bitcoin Range Vs. Altcoin Surge: Key Crypto Charts Analyzed image 0 Bitcoin Range Vs. Altcoin Surge: Key Crypto Charts Analyzed image 1

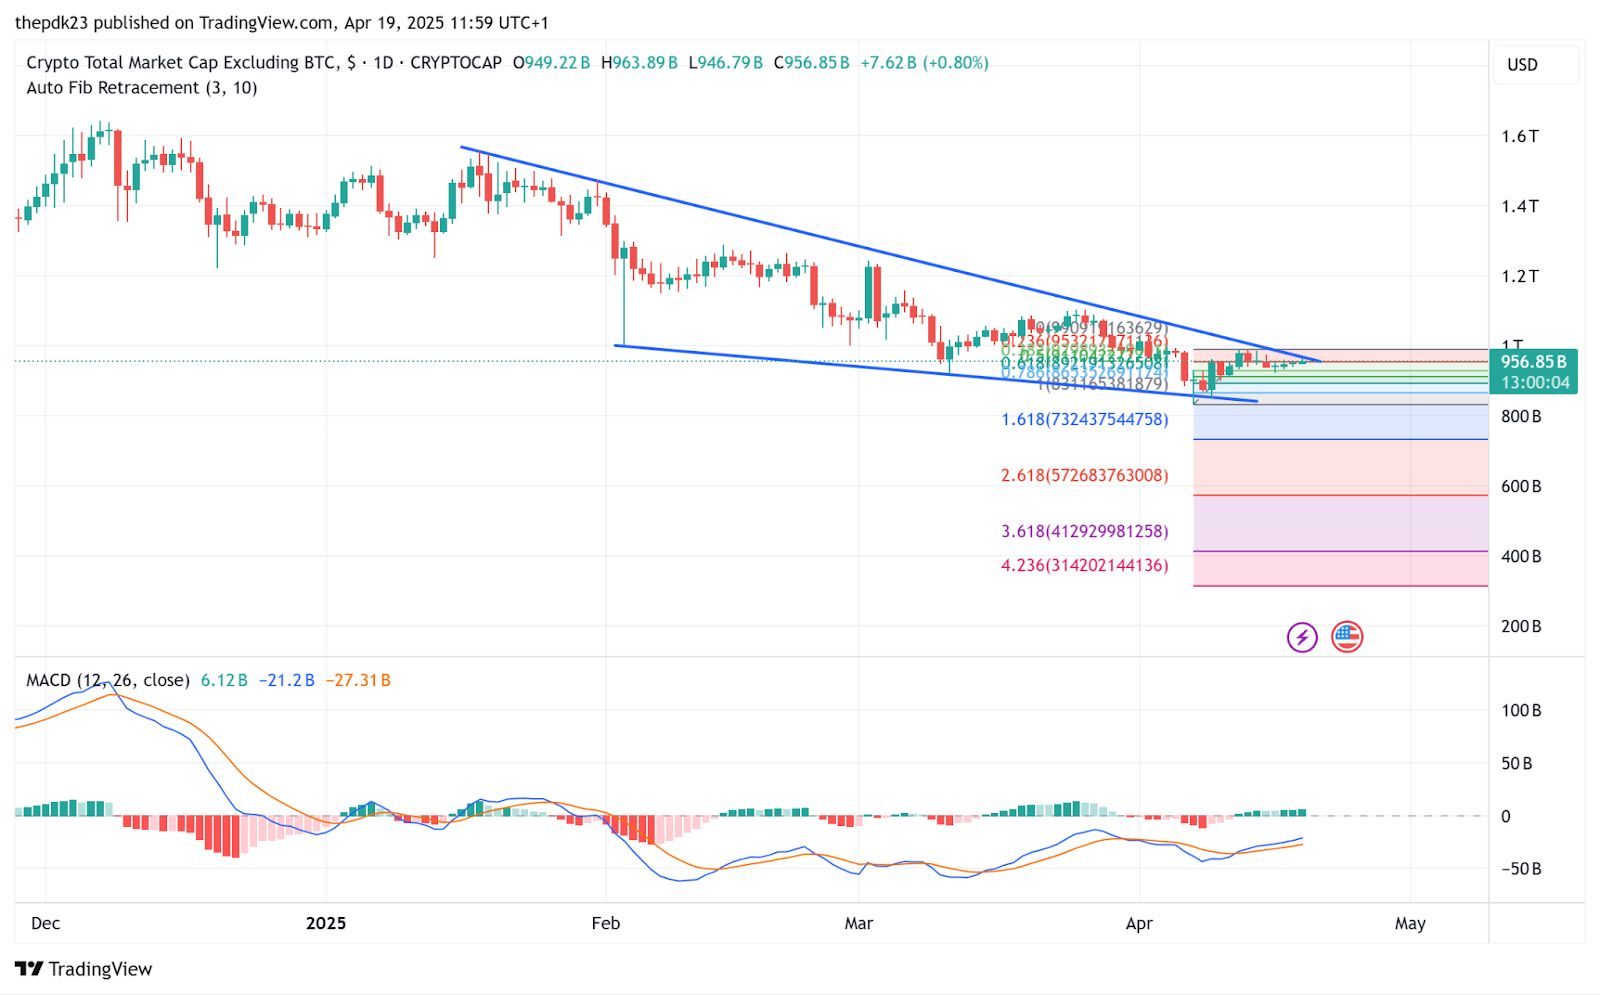
Now above $950 billion, nearing $1 trillion, TOTAL2’s breakout indicates renewed altcoin momentum. The wedge target points towards $1.1 trillion short-term, then potentially $1.3 trillion. 

Related: Massive Dip in JTO, TRUMP, TON CO—Buy the Fear or Run for Cover?

Fibonacci extensions suggest higher resistance targets for the altcoin market cap at $1.163T, $1.3T, and $1.47T, reachable if capital rotates strongly from Bitcoin into altcoins.

Disclaimer: The information presented in this article is for informational and educational purposes only. The article does not constitute financial advice or advice of any kind. Coin Edition is not responsible for any losses incurred as a result of the utilization of content, products, or services mentioned. Readers are advised to exercise caution before taking any action related to the company.

Disclaimer: The content of this article solely reflects the author's opinion and does not represent the platform in any capacity. This article is not intended to serve as a reference for making investment decisions.
PoolX: Earn new token airdrops
Lock your assets and earn 10%+ APR
Lock now!

You may also like

New spot margin trading pair — HOLO/USDT!
Bitget Announcement2025/09/12 07:46
FUN drops by 32.34% within 24 hours as it faces a steep short-term downturn

- FUN plunged 32.34% in 24 hours to $0.008938, marking a 541.8% monthly loss amid prolonged bearish trends. - Technical breakdowns, elevated selling pressure, and forced liquidations highlight deteriorating market sentiment and risk-off behavior. - Analysts identify key support below $0.0080 as critical, with bearish momentum confirmed by RSI (<30) and MACD indicators. - A trend-following backtest strategy proposes short positions based on technical signals to capitalize on extended downward trajectories.

Bitget-RWA2025/09/12 06:14
OPEN has dropped by 189.51% within 24 hours during a significant market pullback

- OPEN's price plummeted 189.51% in 24 hours to $0.8907, marking its largest intraday decline in history. - The token fell 3793.63% over 7 days, matching identical monthly and yearly declines, signaling severe bearish momentum. - Technical analysts cite broken support levels and lack of bullish catalysts as key drivers of the sustained sell-off. - Absence of stabilizing volume or reversal patterns leaves the market vulnerable to further downward pressure.

Bitget-RWA2025/09/12 06:14
New spot margin trading pair — LINEA/USDT!
Bitget Announcement2025/09/11 10:04

Trending news

More
1
New spot margin trading pair — HOLO/USDT!
2
FUN drops by 32.34% within 24 hours as it faces a steep short-term downturn

Crypto prices

More
Bitcoin
Bitcoin
BTC
$116,010.13
-0.01%
Ethereum
Ethereum
ETH
$4,661.04
-0.15%
XRP
XRP
XRP
$3.12
+0.38%
Tether USDt
Tether USDt
USDT
$1
-0.05%
Solana
Solana
SOL
$240.52
+0.68%
BNB
BNB
BNB
$930.24
+0.71%
USDC
USDC
USDC
$0.9997
-0.01%
Dogecoin
Dogecoin
DOGE
$0.2895
+6.75%
Cardano
Cardano
ADA
$0.9311
+2.94%
TRON
TRON
TRX
$0.3496
-0.41%
How to sell PI
Bitget lists PI – Buy or sell PI quickly on Bitget!
Trade now
Become a trader now?A welcome pack worth 6200 USDT for new users!
Sign up now
Trade smarter