Bitget App
Trade smarter
Open
HomepageSign up
Bitget>
News>
Quant (QNT) To Continue Rebound? Key Harmonic Pattern Signaling an Upside Move

Quant (QNT) To Continue Rebound? Key Harmonic Pattern Signaling an Upside Move

CoinsProbe2025/04/29 16:11
By: Nilesh Hembade
QNT+1.94%ETH-1.05%XOLDTOKEN0.00%

Date: Mon, April 28, 2025 | 11:08 AM GMT

Ater a rough start to 2025, where even Ethereum (ETH) tanked by 45% in Q1, the crypto market is finally flashing signs of much-needed relief. ETH is up 29% over the past three weeks, and this bullish momentum is now spilling over into the broader altcoin market.

Among these altcoins, Quant (QNT) — which had also endured a harsh correction — has managed to pull off a noticeable rebound. The token surged by 13% over the past week, trimming its yearly losses to 28%. Now, a key harmonic pattern is forming on the charts, hinting that the recovery may not be over just yet.

Quant (QNT) To Continue Rebound? Key Harmonic Pattern Signaling an Upside Move image 0 
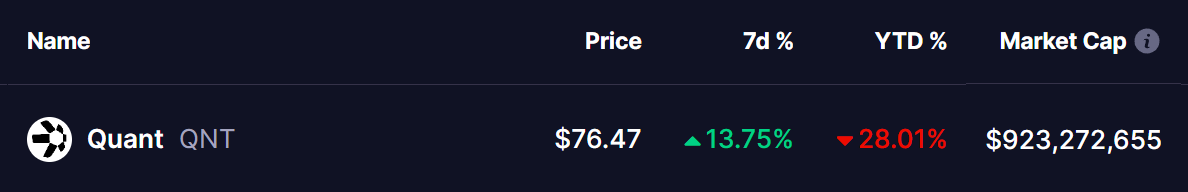
Source: Coinmarketcap

Harmonic Pattern Signals More Upside Move

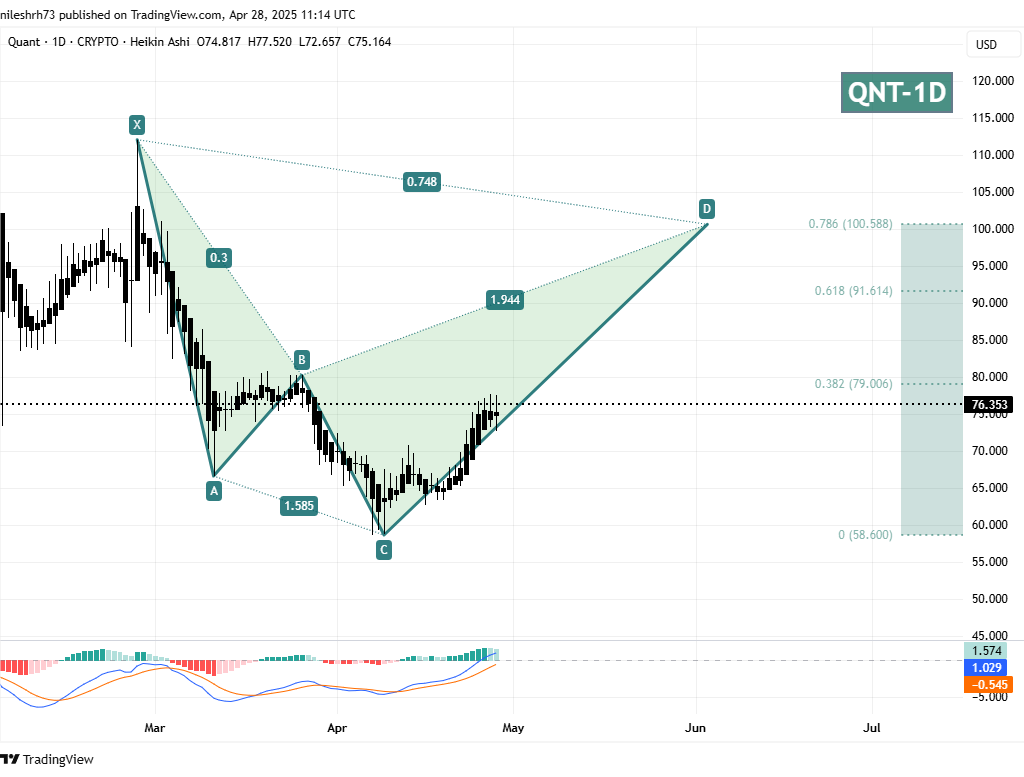
The daily chart for QNT, viewed through Heikin Ashi candles, reveals a Bearish Cypher pattern — a harmonic structure that often signals a bullish continuation up to a key reversal zone.

The structure began at point X, which marked a rejection from the February 26 high of around $112.02. From there, the price plunged sharply to point A, bounced back to point B, and then dipped again deeply to point C, bottoming out around $58.60 on April 7 — marking a sharp 47% correction from the X point.

Quant (QNT) To Continue Rebound? Key Harmonic Pattern Signaling an Upside Move image 1 Quant (QNT) Daily Chart/Coinsprobe (Source: Tradingview)

Currently, QNT is building the final CD leg with strong upward momentum, steadily pushing prices higher.

If the Cypher pattern plays out as expected, the next major target is point D, aligning with the 78.6% Fibonacci retracement of the X to C move — sitting around $100.58. From the current price of $76.31, this would represent a potential upside of about 32%.

What’s Next for QNT?

QNT is now approaching a critical resistance zone during this CD leg — an area that could either trigger profit-taking or, if bulls remain strong, fuel a sharp breakout higher.

Before it can target point D, QNT needs to overcome the first major hurdle around $79.00, which coincides with the 0.382 Fibonacci retracement level. A clean breakout above this zone could provide the momentum needed to sprint towards the final Cypher target near $100.58.

On the technical front, the setup looks promising:

  • MACD: A bullish crossover is currently active, signaling growing buying pressure and supporting further upside movement.

Disclaimer: This article is for informational purposes only and not financial advice. Always conduct your own research before investing in cryptocurrencies.

Disclaimer: The content of this article solely reflects the author's opinion and does not represent the platform in any capacity. This article is not intended to serve as a reference for making investment decisions.
PoolX: Earn new token airdrops
Lock your assets and earn 10%+ APR
Lock now!

You may also like

New spot margin trading pair — HOLO/USDT!
Bitget Announcement2025/09/12 07:46
FUN drops by 32.34% within 24 hours as it faces a steep short-term downturn

- FUN plunged 32.34% in 24 hours to $0.008938, marking a 541.8% monthly loss amid prolonged bearish trends. - Technical breakdowns, elevated selling pressure, and forced liquidations highlight deteriorating market sentiment and risk-off behavior. - Analysts identify key support below $0.0080 as critical, with bearish momentum confirmed by RSI (<30) and MACD indicators. - A trend-following backtest strategy proposes short positions based on technical signals to capitalize on extended downward trajectories.

Bitget-RWA2025/09/12 06:14
OPEN has dropped by 189.51% within 24 hours during a significant market pullback

- OPEN's price plummeted 189.51% in 24 hours to $0.8907, marking its largest intraday decline in history. - The token fell 3793.63% over 7 days, matching identical monthly and yearly declines, signaling severe bearish momentum. - Technical analysts cite broken support levels and lack of bullish catalysts as key drivers of the sustained sell-off. - Absence of stabilizing volume or reversal patterns leaves the market vulnerable to further downward pressure.

Bitget-RWA2025/09/12 06:14
New spot margin trading pair — LINEA/USDT!
Bitget Announcement2025/09/11 10:04

Trending news

More
1
New spot margin trading pair — HOLO/USDT!
2
FUN drops by 32.34% within 24 hours as it faces a steep short-term downturn

Crypto prices

More
Bitcoin
Bitcoin
BTC
$115,897.65
+0.06%
Ethereum
Ethereum
ETH
$4,660.22
+0.15%
XRP
XRP
XRP
$3.12
+0.78%
Tether USDt
Tether USDt
USDT
$1
-0.03%
Solana
Solana
SOL
$240.49
+0.30%
BNB
BNB
BNB
$932.97
+1.01%
USDC
USDC
USDC
$0.9996
-0.02%
Dogecoin
Dogecoin
DOGE
$0.2903
+6.88%
Cardano
Cardano
ADA
$0.9305
+2.93%
TRON
TRON
TRX
$0.3496
-0.36%
How to sell PI
Bitget lists PI – Buy or sell PI quickly on Bitget!
Trade now
Become a trader now?A welcome pack worth 6200 USDT for new users!
Sign up now
Trade smarter