Bitget App
Trade smarter
Open
HomepageSign up
Bitget>
News>
Solana May Test Support at $145.68 Amid Growing Seller Pressure

Solana May Test Support at $145.68 Amid Growing Seller Pressure

Coinotag2025/05/02 16:00
By: Marisol Navaro
SOL-0.20%TSTBSC0.00%TEST0.00%
  • Solana has faced significant trading challenges, having been trapped in a narrow price range while key indicators hint at potential downward pressure.

  • The ongoing market dynamics suggest that sellers are increasingly in control, raising alarms among traders and investors regarding a possible decline.

  • As noted by COINOTAG, “The failure to maintain above key support levels could lead to further market turmoil.”

Solana shows increased bearish pressure as it struggles to maintain price stability, with key indicators pointing towards potential declines.

Technical Indicators Suggest Bearish Sentiment for Solana

The current trend in Solana (SOL) indicates a potential breakdown as key technical indicators point towards a bearish sentiment in the market. The Moving Average Convergence Divergence (MACD) indicator is nearing a critical death cross, suggesting an increased likelihood of a downtrend.

Understanding the MACD Signal and Market Implications

The MACD indicator’s significance lies in its ability to signal shifts in momentum. When the MACD line crosses below the signal line, it typically indicates a weakening price action. Recent readings show that SOL’s MACD line (in blue) is closely approaching the signal line (in orange), suggesting traders should watch for a potential validation of this bearish crossover.

Solana May Test Support at $145.68 Amid Growing Seller Pressure image 0
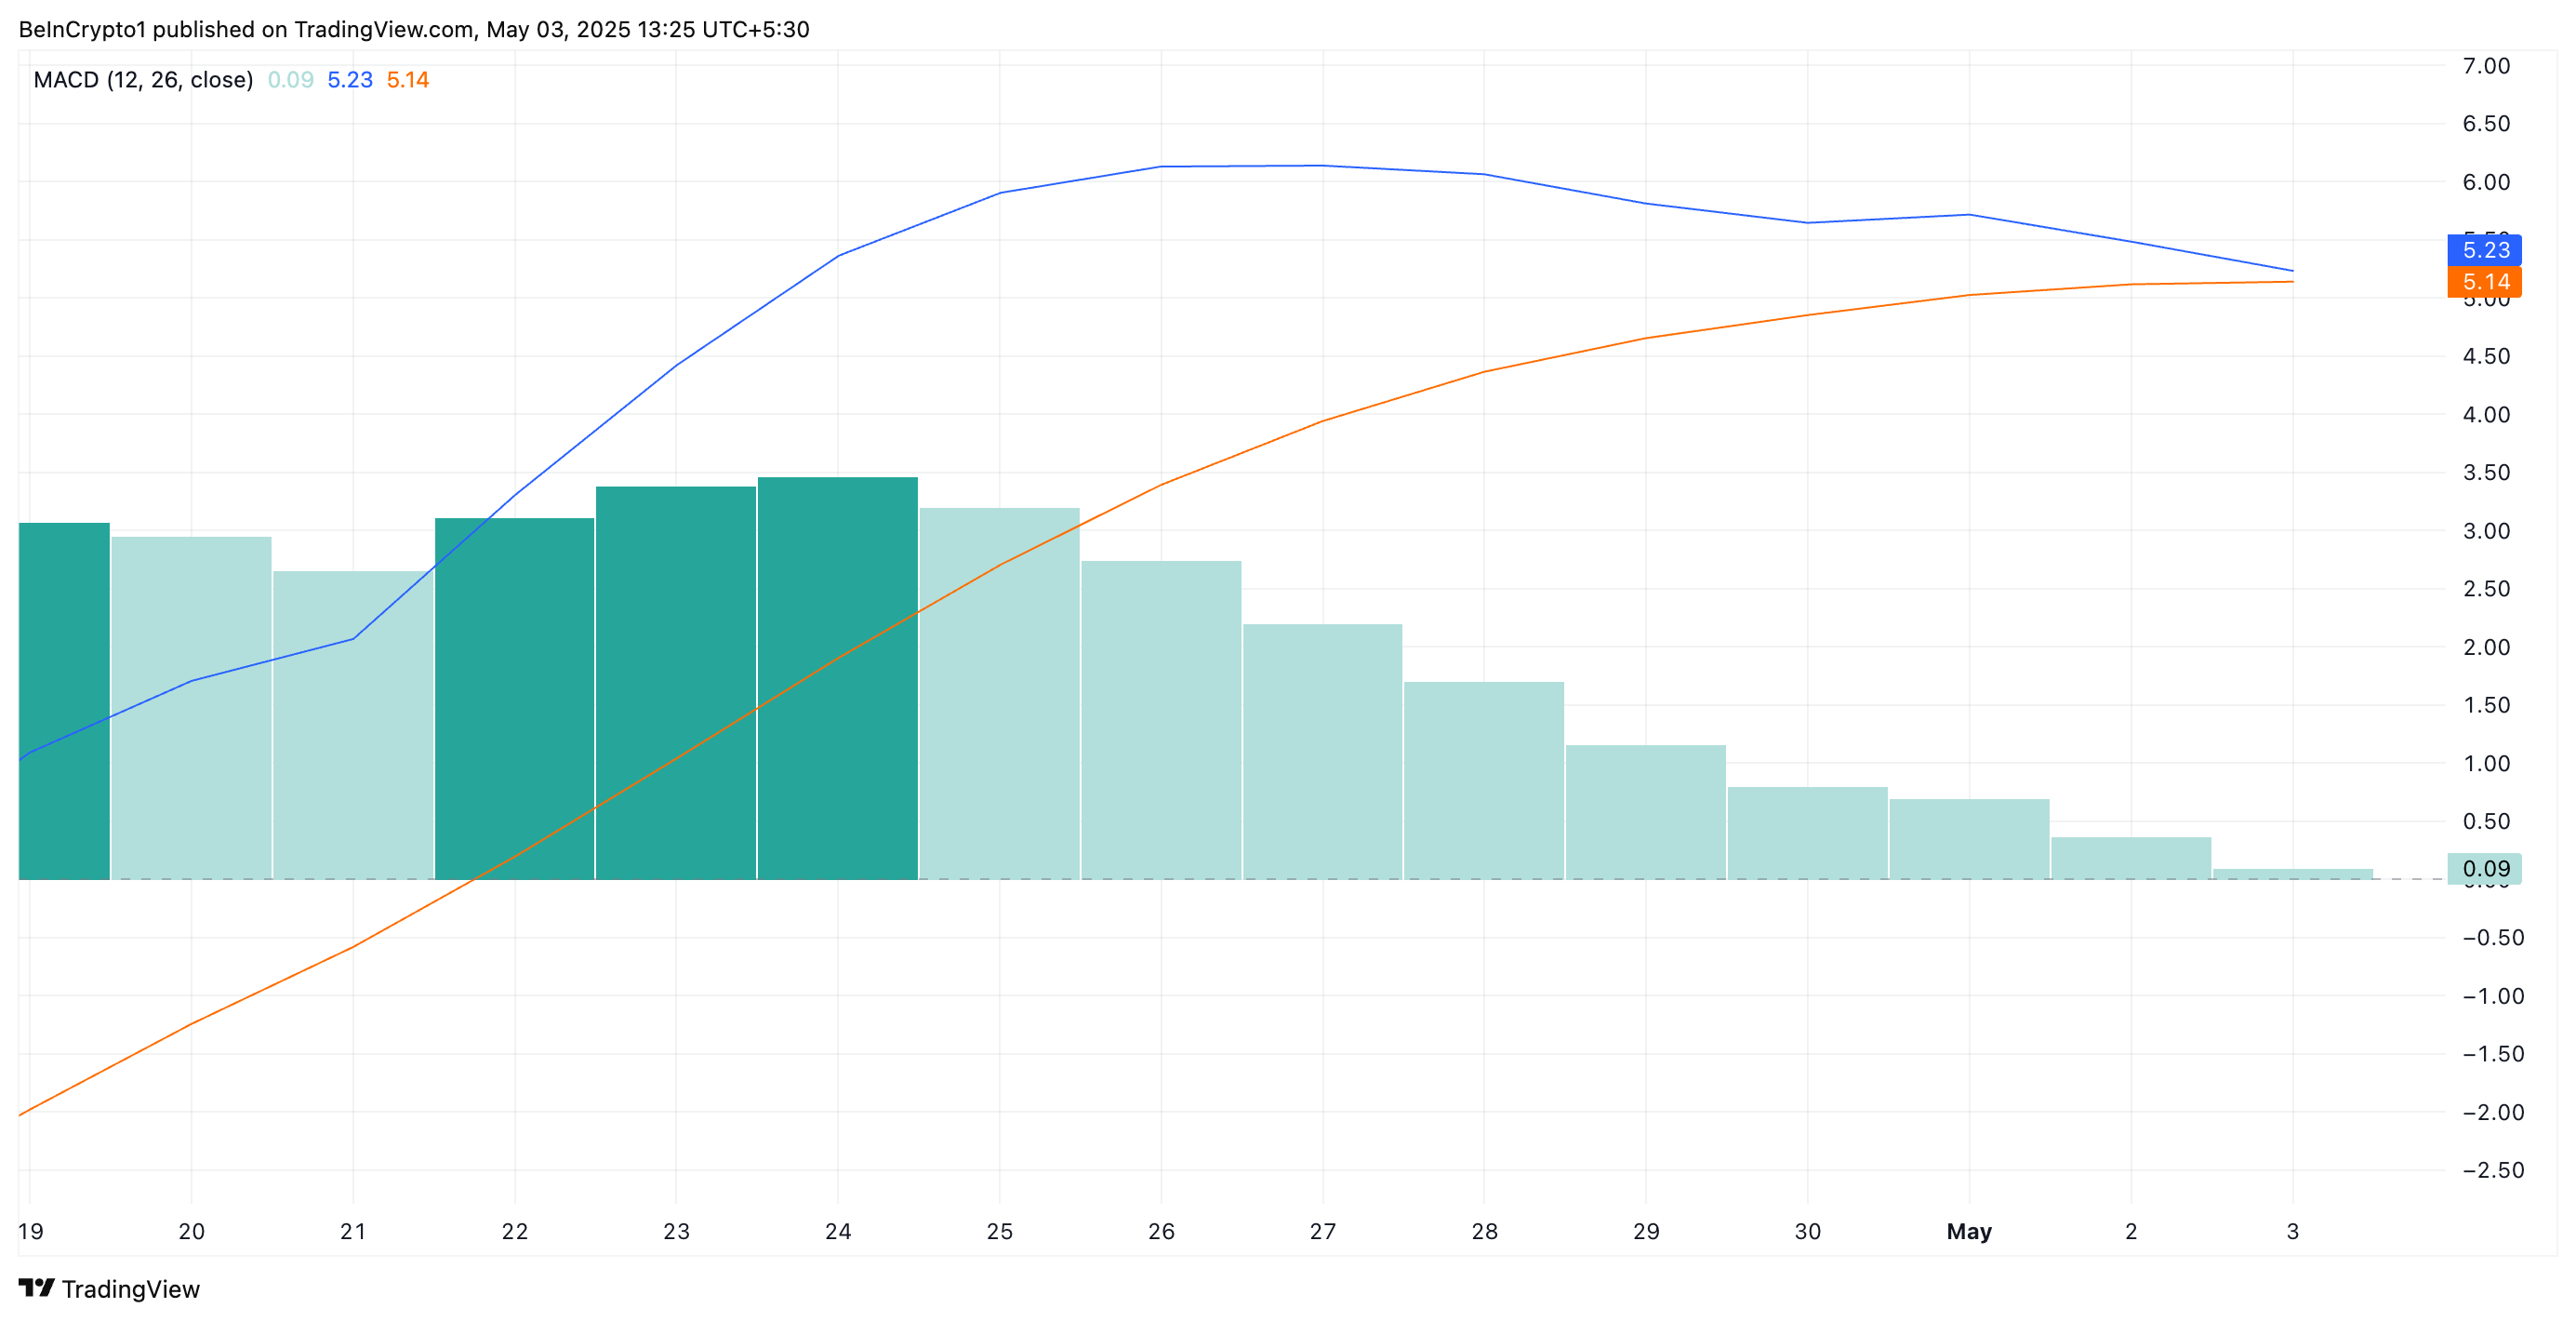
SOL MACD. Source: TradingView

Moreover, the Balance of Power (BoP) indicator confirms the challenging outlook for SOL. With the BoP currently standing at -0.12, this further cements the viewpoint that sellers have taken the upper hand in the market.

Support Levels Under Threat as Market Dynamics Shift

The recent bearish momentum places SOL on shaky grounds as it approaches critical support at $145.68. A decisive break below this threshold could catalyze a downward trend, potentially leading prices toward $142.32.

If support holds at this level, there may be a temporary respite for buyers; however, failure to reclaim this ground could subsequently push SOL to lower levels, including a further plunge towards $133.94.

Solana May Test Support at $145.68 Amid Growing Seller Pressure image 1
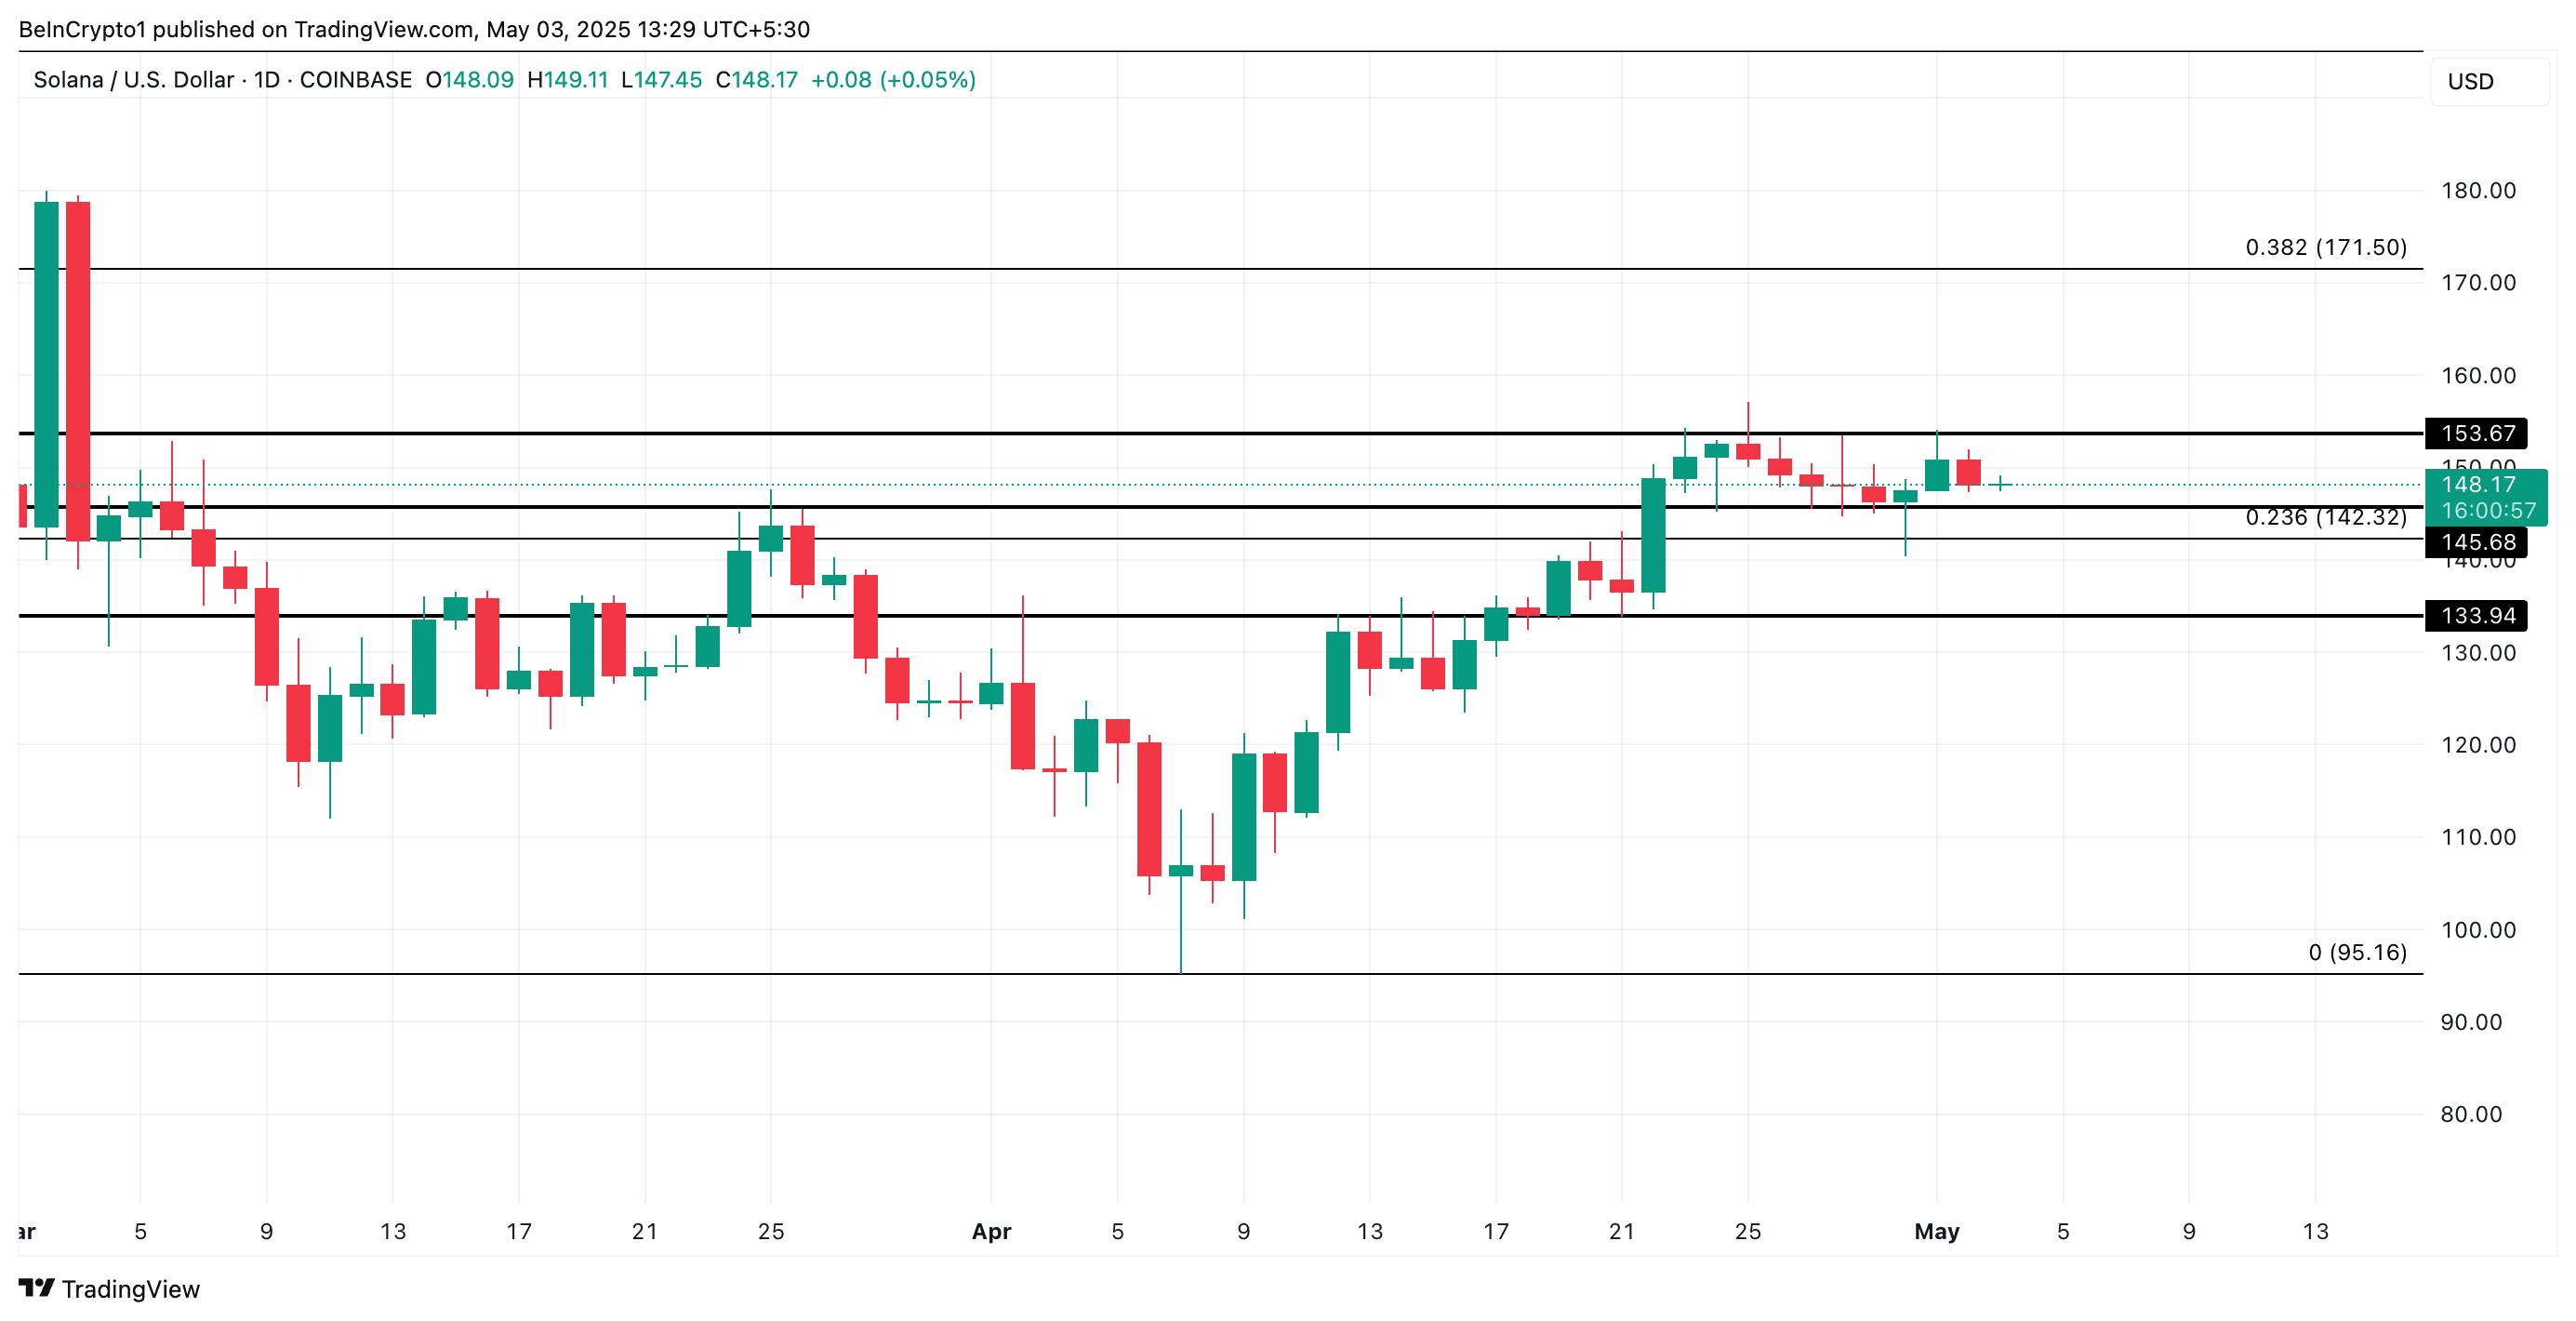
SOL Price Analysis. Source: TradingView

Conversely, should market conditions shift favorably, and buying interest resurges, Solana could clear the critical resistance at $153.67. Such a development might pave the way for a rally towards $171.50, reaffirming bullish momentum.

Conclusion

In summary, Solana is under significant pressure as bearish indicators mount, suggesting a critical juncture ahead. Traders should remain vigilant, monitoring both resistance and support levels closely. The outcome in the coming weeks will be vital in determining whether Solana can stabilize or if further declines are imminent. As always, prudent risk management continues to be essential for participants in this volatile space.

In Case You Missed It: Cardano's ETF Prospects: Analyzing the 75% Odds Amid Market Hesitation
Disclaimer: The content of this article solely reflects the author's opinion and does not represent the platform in any capacity. This article is not intended to serve as a reference for making investment decisions.
PoolX: Earn new token airdrops
Lock your assets and earn 10%+ APR
Lock now!

You may also like

New spot margin trading pair — HOLO/USDT!
Bitget Announcement2025/09/12 07:46
FUN drops by 32.34% within 24 hours as it faces a steep short-term downturn

- FUN plunged 32.34% in 24 hours to $0.008938, marking a 541.8% monthly loss amid prolonged bearish trends. - Technical breakdowns, elevated selling pressure, and forced liquidations highlight deteriorating market sentiment and risk-off behavior. - Analysts identify key support below $0.0080 as critical, with bearish momentum confirmed by RSI (<30) and MACD indicators. - A trend-following backtest strategy proposes short positions based on technical signals to capitalize on extended downward trajectories.

Bitget-RWA2025/09/12 06:14
OPEN has dropped by 189.51% within 24 hours during a significant market pullback

- OPEN's price plummeted 189.51% in 24 hours to $0.8907, marking its largest intraday decline in history. - The token fell 3793.63% over 7 days, matching identical monthly and yearly declines, signaling severe bearish momentum. - Technical analysts cite broken support levels and lack of bullish catalysts as key drivers of the sustained sell-off. - Absence of stabilizing volume or reversal patterns leaves the market vulnerable to further downward pressure.

Bitget-RWA2025/09/12 06:14
New spot margin trading pair — LINEA/USDT!
Bitget Announcement2025/09/11 10:04

Trending news

More
1
New spot margin trading pair — HOLO/USDT!
2
FUN drops by 32.34% within 24 hours as it faces a steep short-term downturn

Crypto prices

More
Bitcoin
Bitcoin
BTC
$116,117.89
+0.54%
Ethereum
Ethereum
ETH
$4,708.97
+5.57%
XRP
XRP
XRP
$3.11
+2.17%
Tether USDt
Tether USDt
USDT
$1
+0.03%
Solana
Solana
SOL
$242.28
+5.93%
BNB
BNB
BNB
$924.87
+2.45%
USDC
USDC
USDC
$0.9997
-0.01%
Dogecoin
Dogecoin
DOGE
$0.2754
+7.71%
TRON
TRON
TRX
$0.3526
+1.75%
Cardano
Cardano
ADA
$0.9168
+2.55%
How to sell PI
Bitget lists PI – Buy or sell PI quickly on Bitget!
Trade now
Become a trader now?A welcome pack worth 6200 USDT for new users!
Sign up now
Trade smarter