Date: Fri, May 09, 2025 | 06:50 PM GMT
The cryptocurrency market continues to build on its recent strength, with Bitcoin (BTC) and Ethereum (ETH) leading the charge. In the past 24 hours, BTC has crossed the $103K mark, while ETH has soared more than 13%, now trading above $2,300 — its highest level in months. This bullish wave is spilling into altcoins too, including The Graph (GRT).
GRT is currently up over 10% today, pushing its monthly gain to an impressive 24%. Now trading near $0.11, the altcoin is showing strong bullish structure — and the charts hint at even more upside potential.
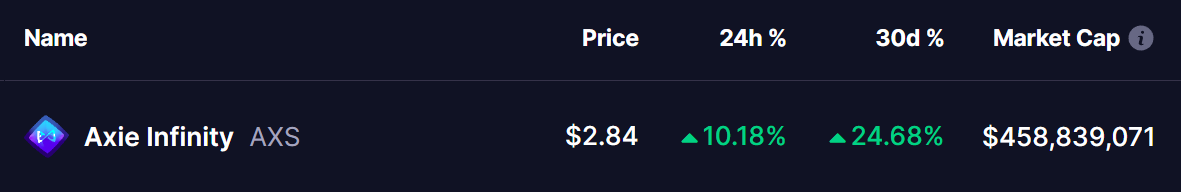 Source: Coinmarketcap
 Inverse Head and Shoulders Pattern in Play
On the daily timeframe, GRT is showing a textbook inverse head and shoulders pattern — a classic bullish reversal setup. The formation started in early March with the left shoulder, followed by a deeper dip to $0.066 on April 7 that formed the head. The price has since recovered and formed the right shoulder, which recently bounced from the 50-day moving average support zone around $0.089.
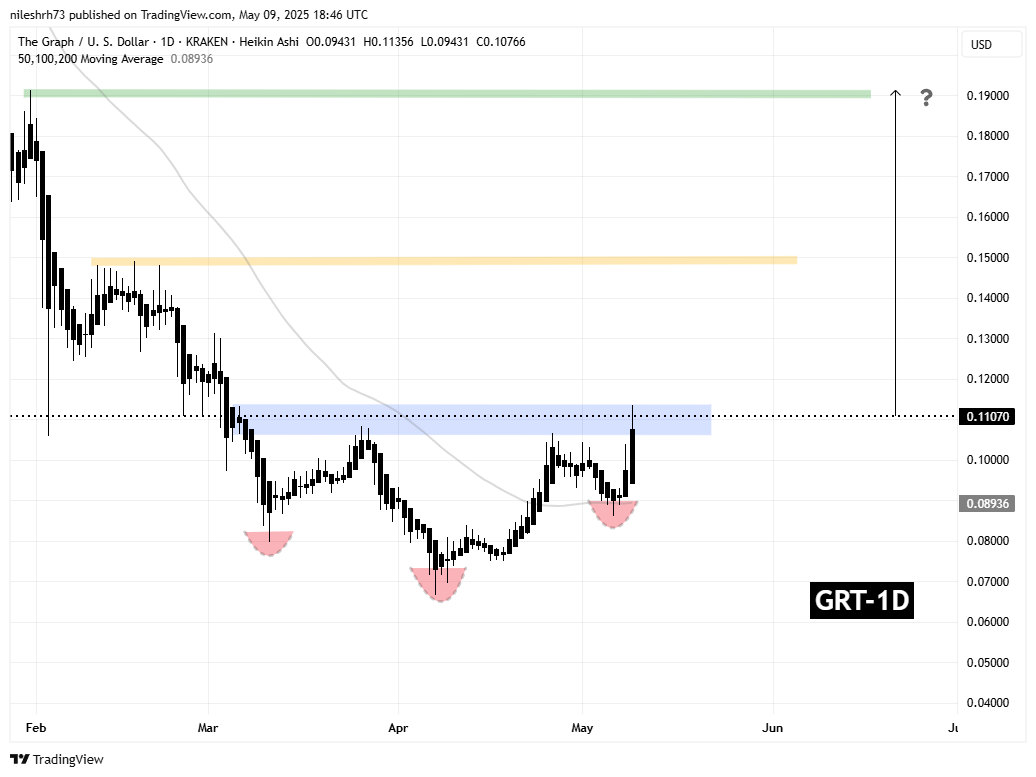 The Graph (GRT) Daily Chart/Coinsprobe (Source: Tradingview)
 Now, all eyes are on the neckline resistance around $0.115 — a critical level where GRT has faced rejection multiple times in the past. The blue resistance zone marked on the chart highlights this key area. A confirmed breakout and daily close above this neckline could validate the pattern and open the door for a strong rally ahead.
What’s Next for GRT?
If bulls successfully break through the neckline, the first major target lies at the yellow resistance zone near $0.1491. This area acted as strong support-turned-resistance earlier in the year and could pose a challenge — but also offers a 35% potential upside from current prices.
In the event of a full breakout, GRT may even rally toward the green resistance area near $0.1912. That level, last seen before the February crash, could become the final destination of this bullish setup — representing a gain of over 70% from where we are now.
With improving sentiment, solid technical structure, and broader market tailwinds, GRT might just be getting ready for its next big move.
Disclaimer: This article is for informational purposes only and not financial advice. Always do your own research before making investment decisions.