Bitget App
Trade smarter
Open
HomepageSign up
Bitget>
News>
Ethena (ENA) to Continue Its Rebound? Analyst Spots Key Fractal Hinting at an Upside Move

Ethena (ENA) to Continue Its Rebound? Analyst Spots Key Fractal Hinting at an Upside Move

CoinsProbe2025/05/17 16:00
By: Nilesh Hembade

Date: Fri, May 16, 2025 | 07:40 PM GMT

The cryptocurrency market has seen a much-needed revival in recent weeks. After a brutal Q1 that saw Ethereum (ETH) fall by 45%, the second-largest crypto has now surged over 62% in the past month and is trading near $2,600 — its highest level in months. This renewed bullish sentiment is not just limited to ETH. It’s lifting altcoins across the board, including Ethena (ENA).

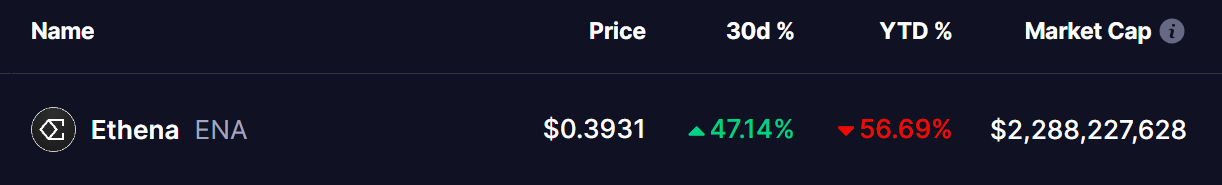
ENA has gained over 47% in the last month, trimming its yearly losses to 56%. Now, a compelling fractal pattern is emerging — one that could suggest the recovery isn’t over just yet.

Ethena (ENA) to Continue Its Rebound? Analyst Spots Key Fractal Hinting at an Upside Move image 0 Source: Coinmarketcap

ENA Mirrors SUI’s Historical Breakout

As highlighted by crypto analyst @CryptoBullet1 , the current price structure of ENA in 2025 looks strikingly similar to the price action of SUI in 2024. When comparing the two charts side-by-side, a clear pattern emerges — a bullish fractal.

Ethena (ENA) to Continue Its Rebound? Analyst Spots Key Fractal Hinting at an Upside Move image 1 
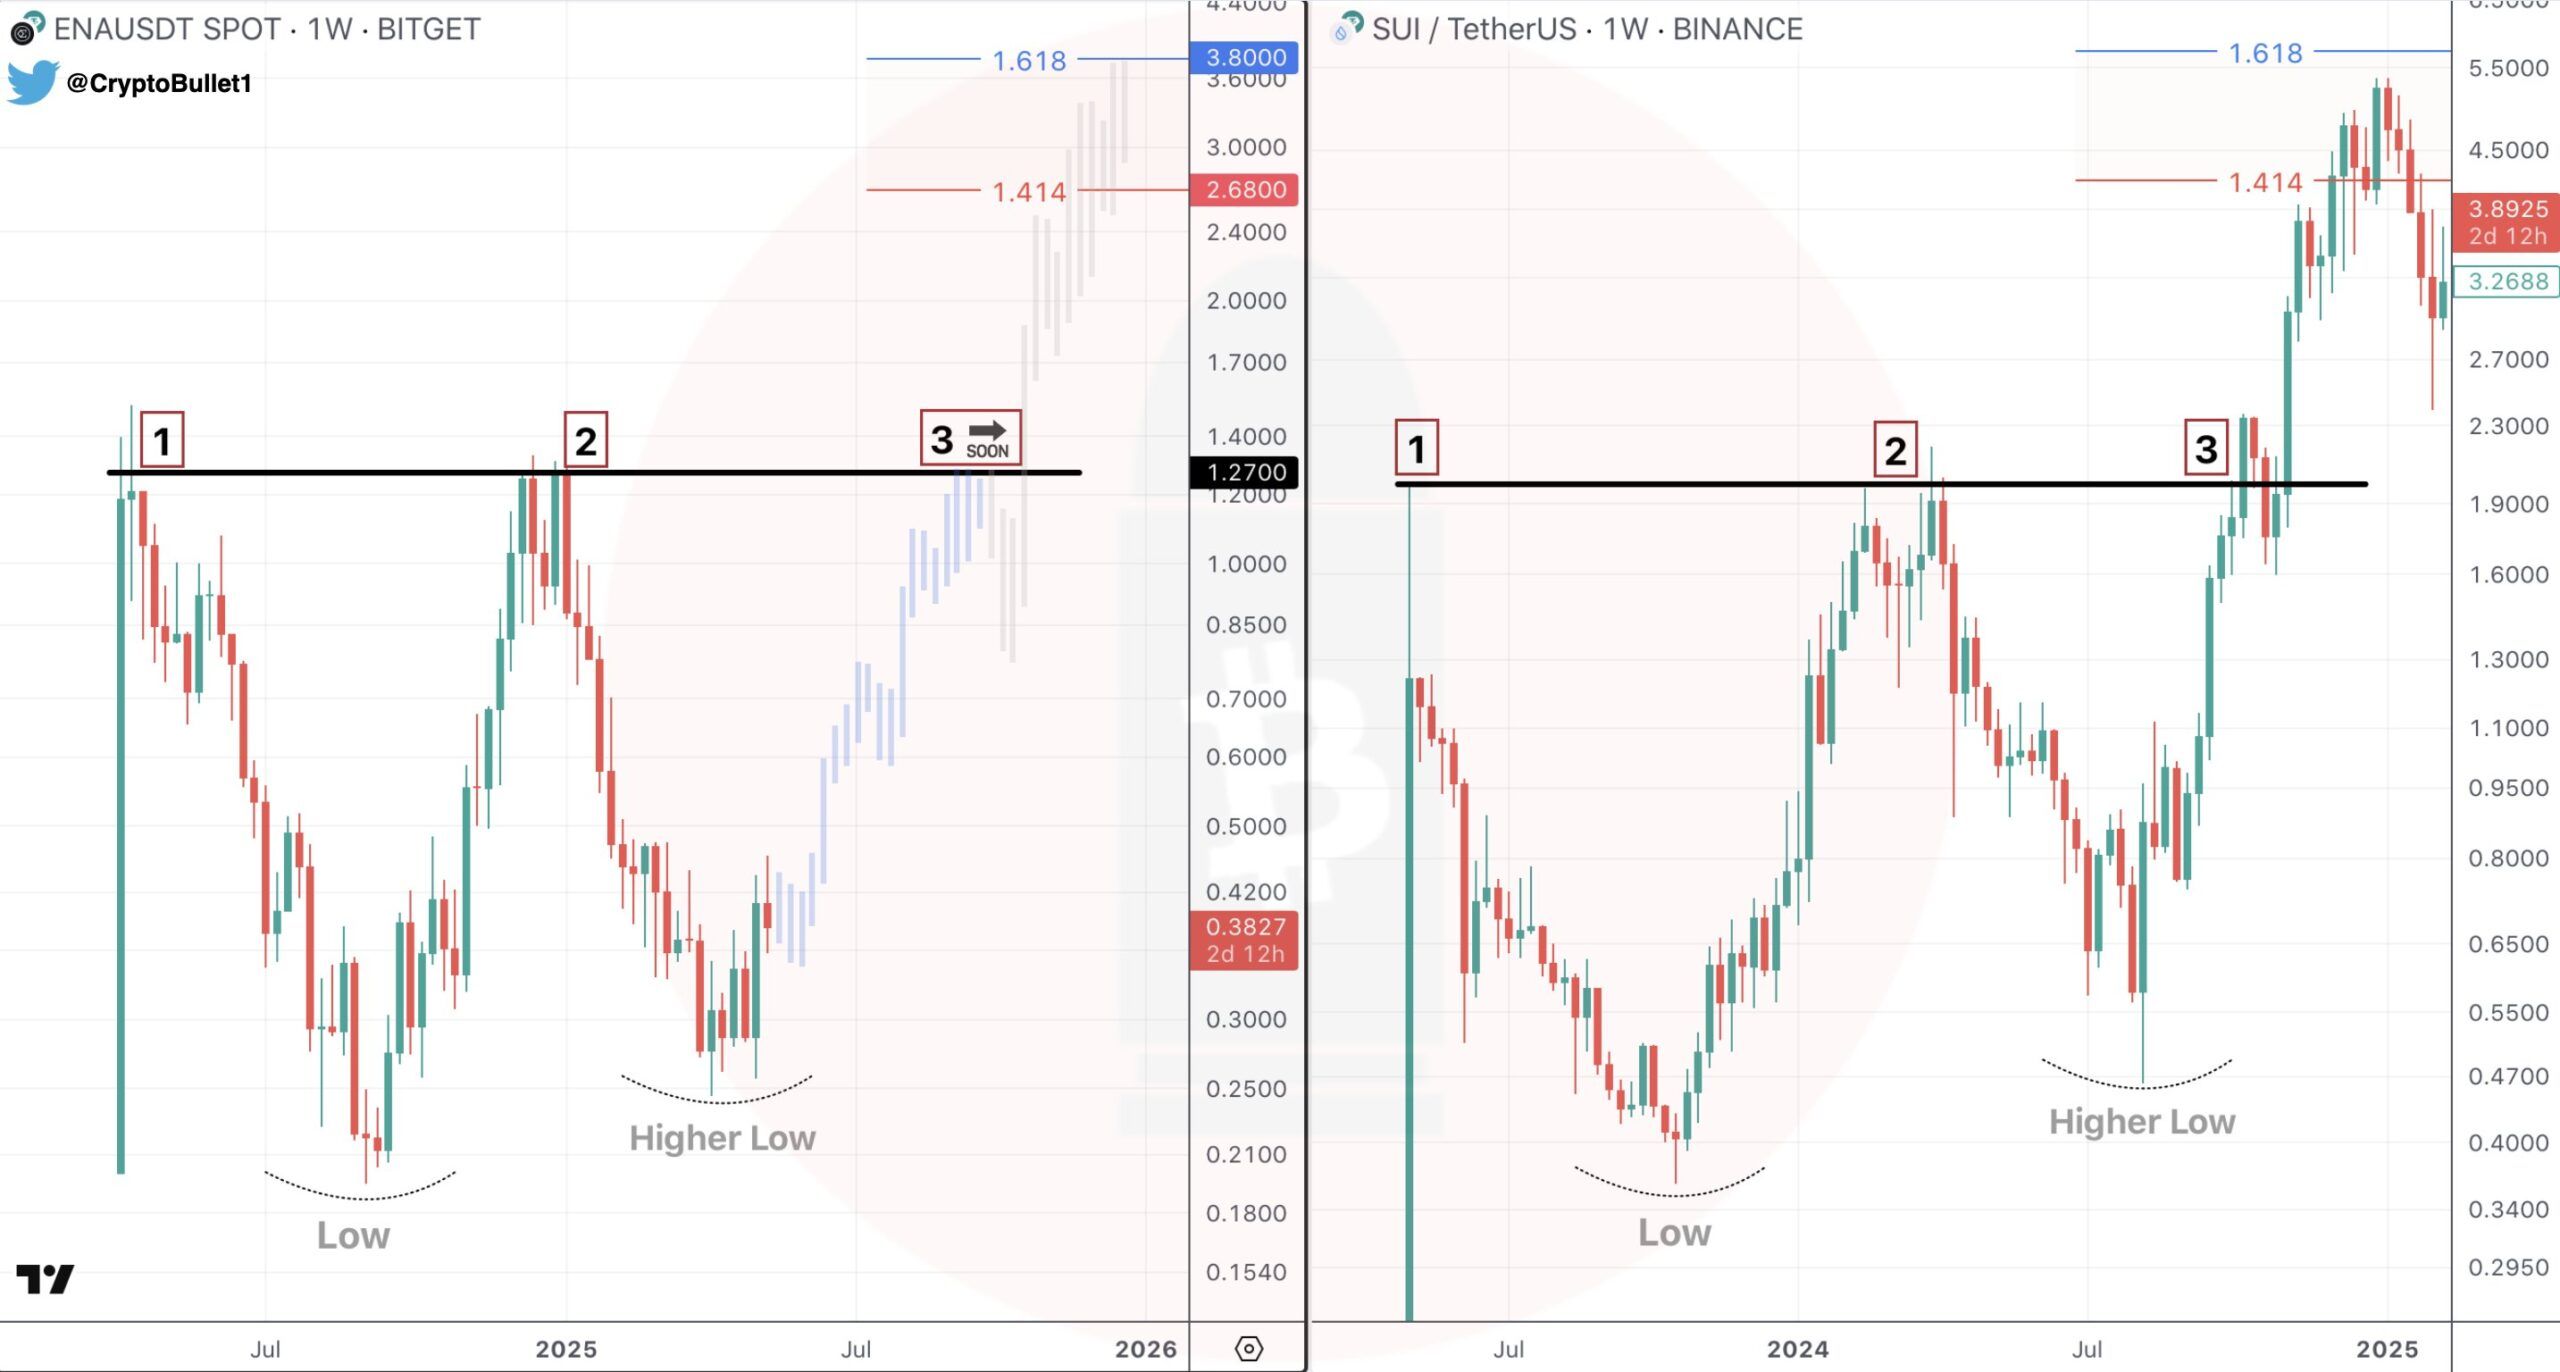
ENA and SUI Fractal Chart/Source: @CryptoBullet1 (X)

The structure includes:

  • [1] Listing Pump: A strong move shortly after launch.
  • [2] Second Resistance Attempt: A failed breakout that results in a pullback.
  • [3] Third Attempt & Breakout: The moment of bullish confirmation.

Importantly, both charts also show the formation of “Higher Lows” after each correction, indicating strengthening bullish momentum. This setup suggests that ENA could be gearing up for a similar third test of resistance — and potentially a breakout like SUI did last year.

Upside Targets If History Repeats

If ENA follows the same fractal as SUI, the next upside phase could trigger significant gains. The analyst lays out three major targets:

  • Target 1: $1.27 – A retest of the current resistance zone.
  • Target 2: $2.68 – 1.414 Fibonacci extension level.
  • Target 3: $3.80 – 1.618 Fibonacci extension, mirroring SUI’s final move.

Conclusion

With the broader market showing strength and ENA forming a structurally bullish pattern, the odds of continuation look increasingly favorable. While nothing is guaranteed in crypto, fractals like this offer helpful context — especially when supported by improving sentiment and price action.

Keep an eye on that third resistance test. If ENA breaks above it, the next leg up may come quicker than expected.

Disclaimer: This article is for informational purposes only and not financial advice. Always conduct your own research before investing in cryptocurrencies.

Disclaimer: The content of this article solely reflects the author's opinion and does not represent the platform in any capacity. This article is not intended to serve as a reference for making investment decisions.
PoolX: Earn new token airdrops
Lock your assets and earn 10%+ APR
Lock now!

You may also like

New spot margin trading pair — HOLO/USDT!
Bitget Announcement2025/09/12 07:46
FUN drops by 32.34% within 24 hours as it faces a steep short-term downturn

- FUN plunged 32.34% in 24 hours to $0.008938, marking a 541.8% monthly loss amid prolonged bearish trends. - Technical breakdowns, elevated selling pressure, and forced liquidations highlight deteriorating market sentiment and risk-off behavior. - Analysts identify key support below $0.0080 as critical, with bearish momentum confirmed by RSI (<30) and MACD indicators. - A trend-following backtest strategy proposes short positions based on technical signals to capitalize on extended downward trajectories.

Bitget-RWA2025/09/12 06:14
OPEN has dropped by 189.51% within 24 hours during a significant market pullback

- OPEN's price plummeted 189.51% in 24 hours to $0.8907, marking its largest intraday decline in history. - The token fell 3793.63% over 7 days, matching identical monthly and yearly declines, signaling severe bearish momentum. - Technical analysts cite broken support levels and lack of bullish catalysts as key drivers of the sustained sell-off. - Absence of stabilizing volume or reversal patterns leaves the market vulnerable to further downward pressure.

Bitget-RWA2025/09/12 06:14
New spot margin trading pair — LINEA/USDT!
Bitget Announcement2025/09/11 10:04

Trending news

More
1
New spot margin trading pair — HOLO/USDT!
2
FUN drops by 32.34% within 24 hours as it faces a steep short-term downturn

Crypto prices

More
Bitcoin
Bitcoin
BTC
$115,733.58
+0.35%
Ethereum
Ethereum
ETH
$4,709.44
+3.75%
XRP
XRP
XRP
$3.11
+1.89%
Tether USDt
Tether USDt
USDT
$1
+0.00%
Solana
Solana
SOL
$242.69
+1.97%
BNB
BNB
BNB
$924.86
+1.79%
USDC
USDC
USDC
$0.9997
-0.01%
Dogecoin
Dogecoin
DOGE
$0.2834
+8.47%
TRON
TRON
TRX
$0.3538
+1.37%
Cardano
Cardano
ADA
$0.9278
+2.96%
How to sell PI
Bitget lists PI – Buy or sell PI quickly on Bitget!
Trade now
Become a trader now?A welcome pack worth 6200 USDT for new users!
Sign up now
Trade smarter