Starknet Price Prediction 2025-35: Will It Hit $30 by 2035?
- STRK flipped its funding rate positive—an early sign that traders are leaning bullish.
- Bullish MACD reveals early momentum shift as buyers regain market control from sellers.
- 2025 price outlook sees STRK climbing to $0.05–$3.50, driven by demand and network growth.
Starknet (STRK) Overview
| Cryptocurrency | Starknet |
| Ticker | STRK |
| Current Price | $0.1497 |
| Price Change (30D) | +23.96% |
| Price Change (1Y) | -86.78% |
| Market Cap | $465.32 Million |
| Circulating Supply | 3.1 Billion |
| All-Time High | $3.66 |
| All-Time Low | $0.1103 |
| Total Supply | 10 Billion |
What is Starknet (STRK)?
Starknet (STRK) is not just another Ethereum Layer 2—it’s one of the most advanced scalability solutions, reshaping how decentralized applications (dApps) interact with blockchain infrastructure. Built as a Validity Rollup (ZK-Rollup), Starknet leverages advanced cryptographic technology to scale Ethereum without compromising security or decentralization.
 Source: Starknet
 At its core, STRK is Starknet’s native token, powering its ecosystem through utility, governance, and, soon, staking.
How Starknet Works: Power Meets Efficiency
Starknet boosts Ethereum’s throughput by moving transaction execution off-chain. Instead of processing each transaction on the Ethereum mainnet, Starknet:
- Bundles transactions into a STARK proof, a special zero-knowledge proof that verifies computation without revealing data.
- Submits this proof to Ethereum as a single on-chain transaction.
- Reduces gas costs and increases speed while inheriting Ethereum’s security guarantees.
This approach drastically reduces network congestion and gas fees, making Starknet a perfect environment for high-speed dApps like trading platforms and onchain games.
The Starknet Ecosystem: Scalable, Customizable, Decentralized
The SN Stack: Build Your Chain, Your Way
Starknet is powered by the SN Stack—a modular, battle-tested zero-knowledge tech stack that allows developers to create custom Layer 2 or even Layer 3 chains with:
- Adjustable block size, time, fees, and branding
- Native Account Abstraction
- Ethereum-level composability and security
Implementation flavors include:
- StarkWare Sequencer – most proven and stable
- Madara – ultra-customizable for unique use cases
- Dojo – built for onchain games
All flavors share the same core tech the public Starknet network uses, enabling a seamless, secure, and composable experience.
What Does STRK Do?
The STRK token is central to Starknet’s functionality and governance:
- Transaction Fees: While fees were initially paid only in ETH, Starknet now allows STRK to be used for gas. Sequencers can convert STRK to ETH to pay Ethereum L1 fees.
- Staking (Upcoming): STRK will be required to participate in critical services like sequencing, data availability, and proving—enhancing security and decentralization.
- Governance: STRK holders propose and vote on protocol upgrades, such as the Starknet Operating System updates and consensus changes.
STRK Token Allocation: A Community-Centered Rollout
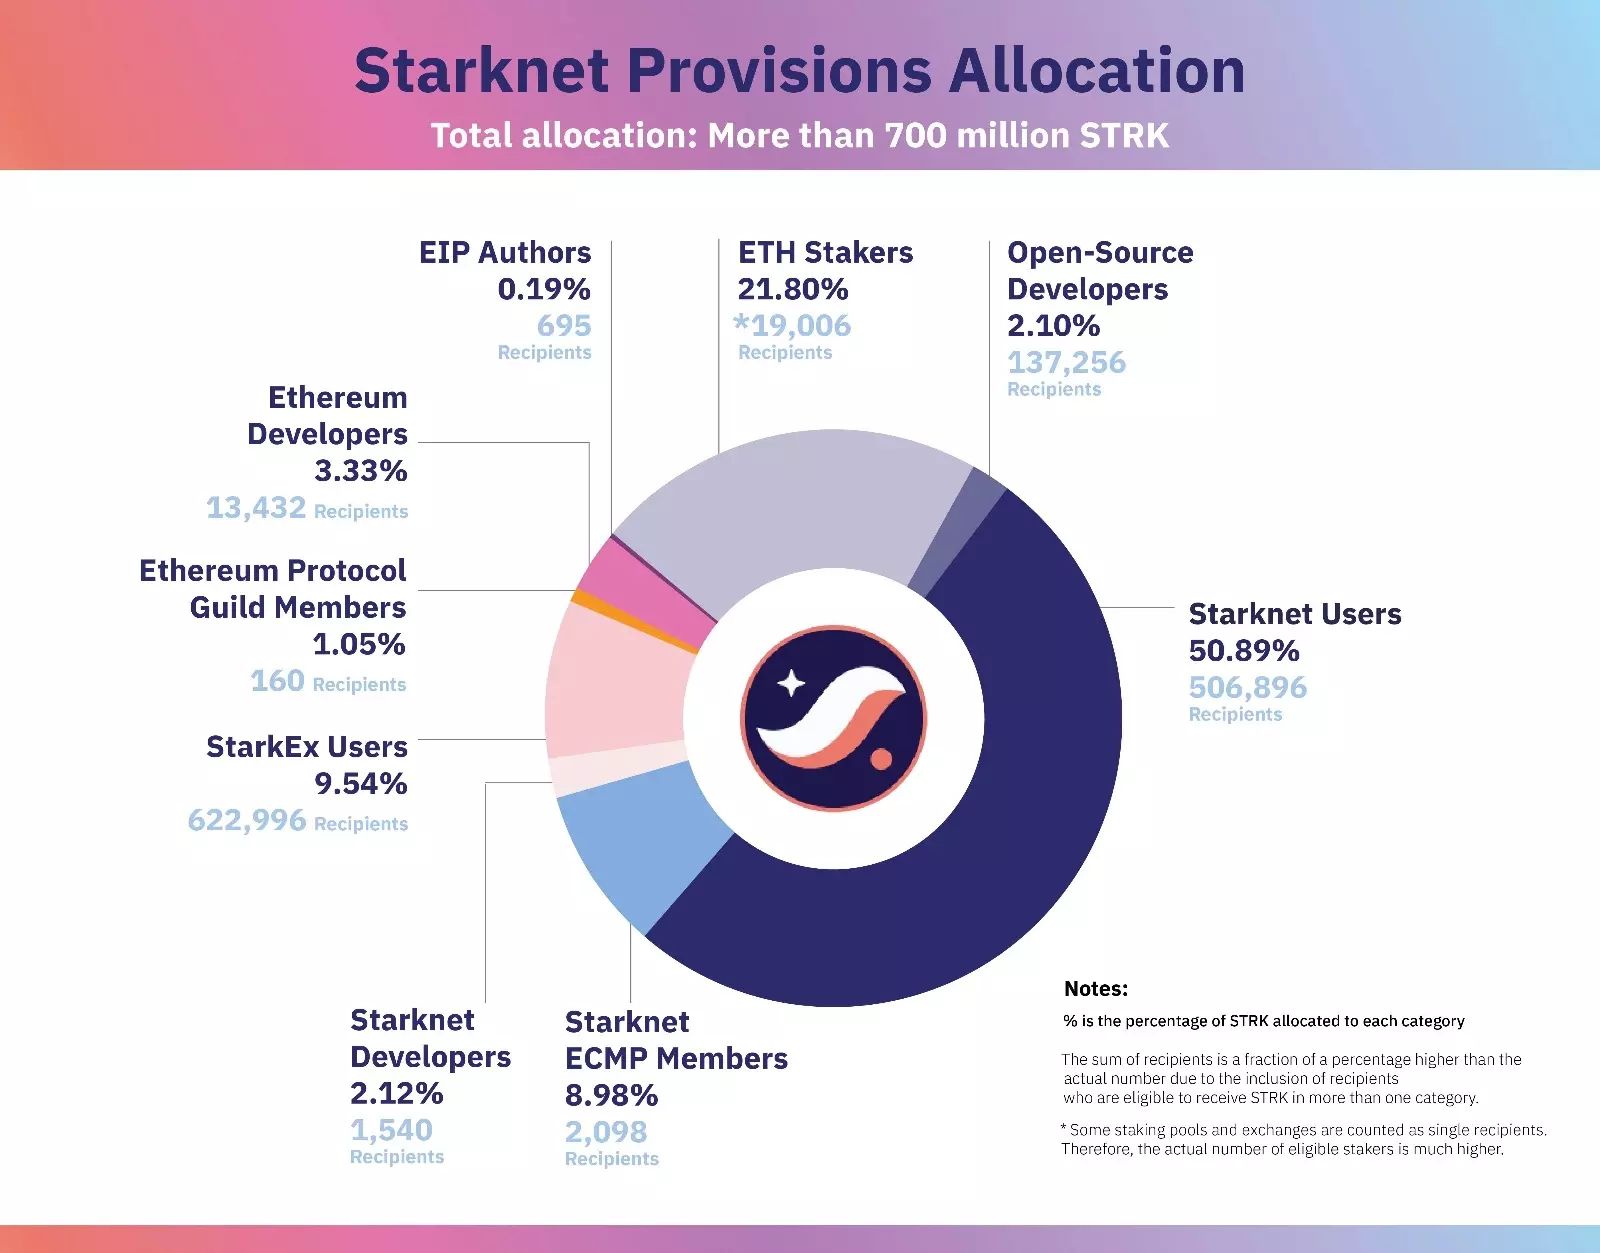
To ensure decentralization and broad community involvement, Starknet has allocated over 700 million STRK tokens through its Starknet Provisions program, designed to reward early contributors, users, and supporters across the Ethereum and Starknet ecosystems.
 Source: Starknet
 Here’s how the STRK distribution breaks down:
- Starknet Users: 50.89%: There are over 506,000 recipients, making this the largest allocation. This rewards users who’ve engaged with Starknet early and frequently, recognizing their critical role in network growth.
- StarkEx Users: 9.54%: 622,996 recipients from platforms powered by StarkEx (like dYdX, Immutable X) also receive STRK, reflecting StarkWare’s broader impact on Layer 2 innovation.
- ETH Stakers: 21.80%: 19,006 participants who staked ETH help secure the Ethereum network and now benefit from Starknet’s expansion.
- Starknet Developers: 2.12%: 1,540 builders contributing directly to the Starknet ecosystem, through code, tools, or infrastructure, are rewarded.
- Open-Source Developers: 2.10%: Recognizing the broader open-source community with 137,256 recipients, reinforcing Starknet’s commitment to collaborative development.
- Ethereum Developers: 3.33%: 13,432 developers working on Ethereum protocols are acknowledged as foundational contributors to Layer 2 scaling efforts.
- EIP Authors: 0.19%: 695 contributors who’ve authored Ethereum Improvement Proposals receive STRK for guiding Ethereum’s evolution.
- Ethereum Protocol Guild Members: 1.05%: A select group of 160 members involved in core protocol development is included.
- Starknet ECMP Members: 8.98%: 2,098 Starknet’s Early Community Member Program (ECMP) members are rewarded for their early support.
Starknet Price History
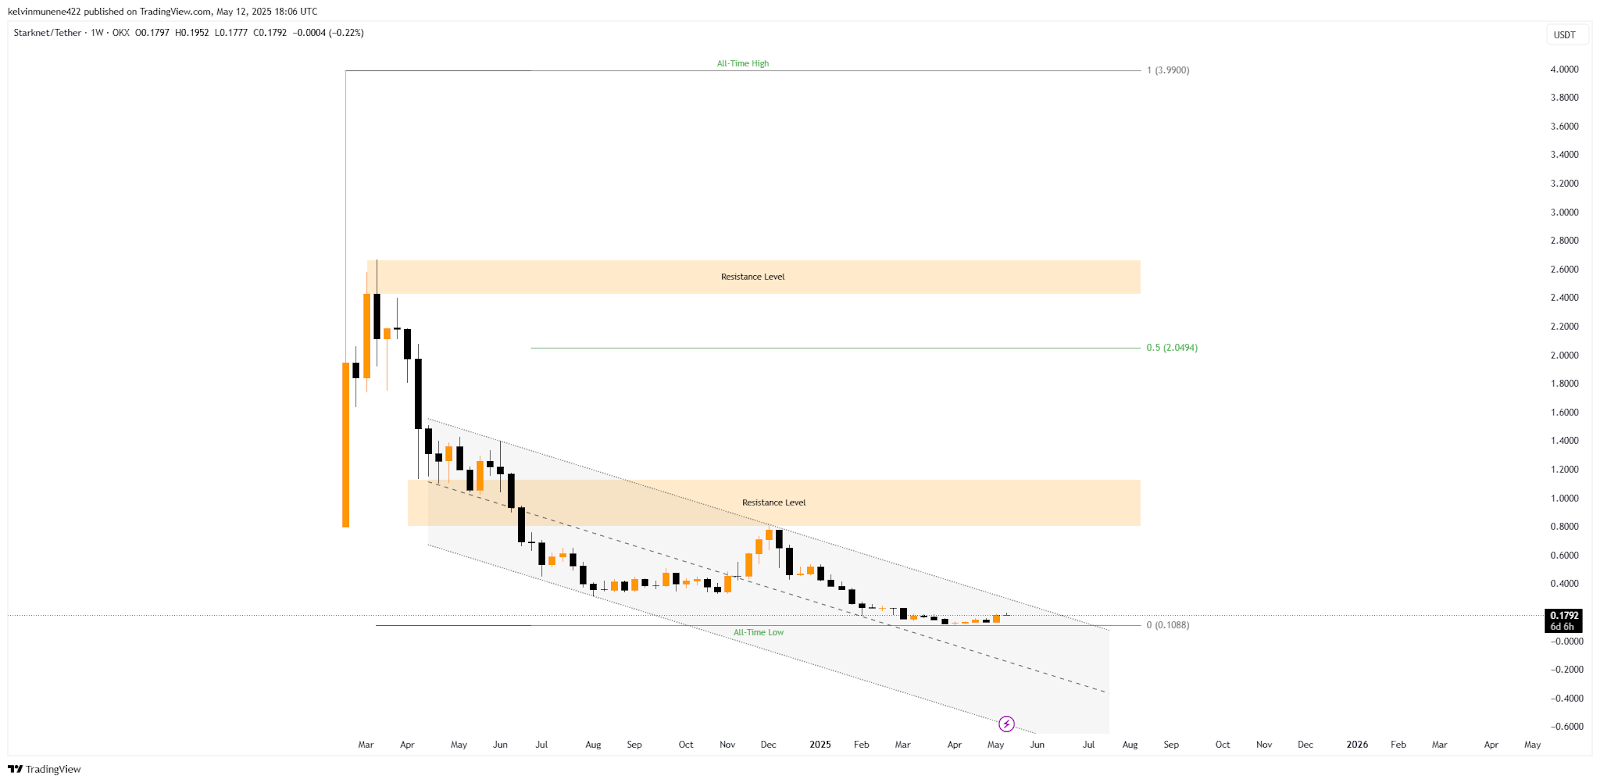
After an explosive debut, the token skyrocketed nearly 400% to hit an all-time high (ATH) of around $3.66. But what shot up fast came down just as quickly. The price plunged over 70%, eventually landing in the $1.13–$0.80 support zone—a level that initially held firm but couldn’t withstand mounting pressure.
That former support later flipped into a key resistance area, with the token failing to reclaim it during recent attempts. The downward trend persisted, dragging the price to a new low near $0.1103, where it finally found footing.
Since then, there’s been a flicker of hope; the token has climbed to the current level of $0.1792. Zooming out, the token still moves within a descending channel, reinforcing the broader bearish trend.
 Source: TradingView
 However, it’s now close to the upper boundary of that channel. A breakout here could mark the start of a bullish reversal. If momentum builds, the first major hurdle is the $1.13–$0.80 resistance.
A successful breakout above that could pave the way toward the $2.66–$2.42 region—levels not seen since 2024—or even a retest of the ATH. On the flip side, if bearish sentiment resurfaces, the token could revisit its all-time low—or potentially sink into uncharted territory below it.
Funding Rate Flip Hints at Bullish Revival for STRK
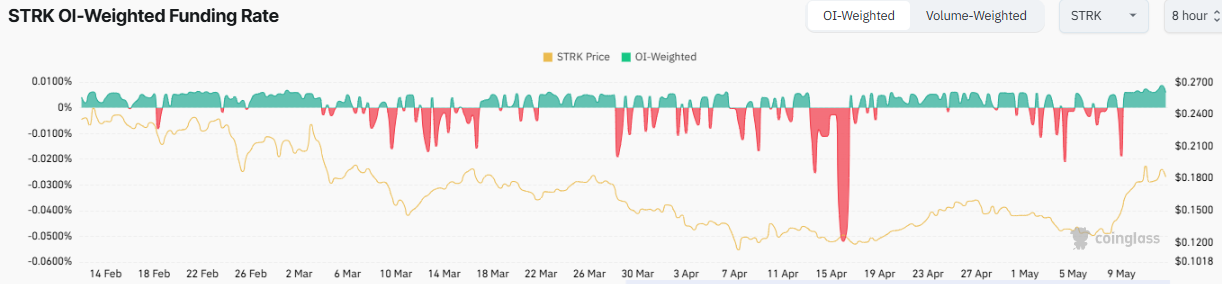
Adding to the bullish case, the Open Interest (OI)-Weighted Funding Rate for STRK has flipped positive, signaling a notable shift in trader sentiment. This means that long-position holders—those betting on the token’s price going up—are now paying a premium to short sellers just to keep their positions open. It’s a classic sign of growing confidence among bulls.
 Source: Coinglass
 In recent months, the funding rate remained negative, reflecting bearish dominance and an overall risk-averse mood in the market. However, as prices began to lift from the $0.1103 zone, the funding rate flipped and has held mostly above zero. This indicates increased demand for long exposure and hints at strengthening conviction that the worst might be behind.
Related: Loopring Price Prediction 2025-35: Will It Hit $50 by 2035?
Yearly Highs and Lows of Starknet
| Year | Starknet Price | |
| High | Low | |
| 2025 | $0.5383 | $0.1103 |
| 2024 | $3.66 | $0.3146 |
Starknet Technical Analysis
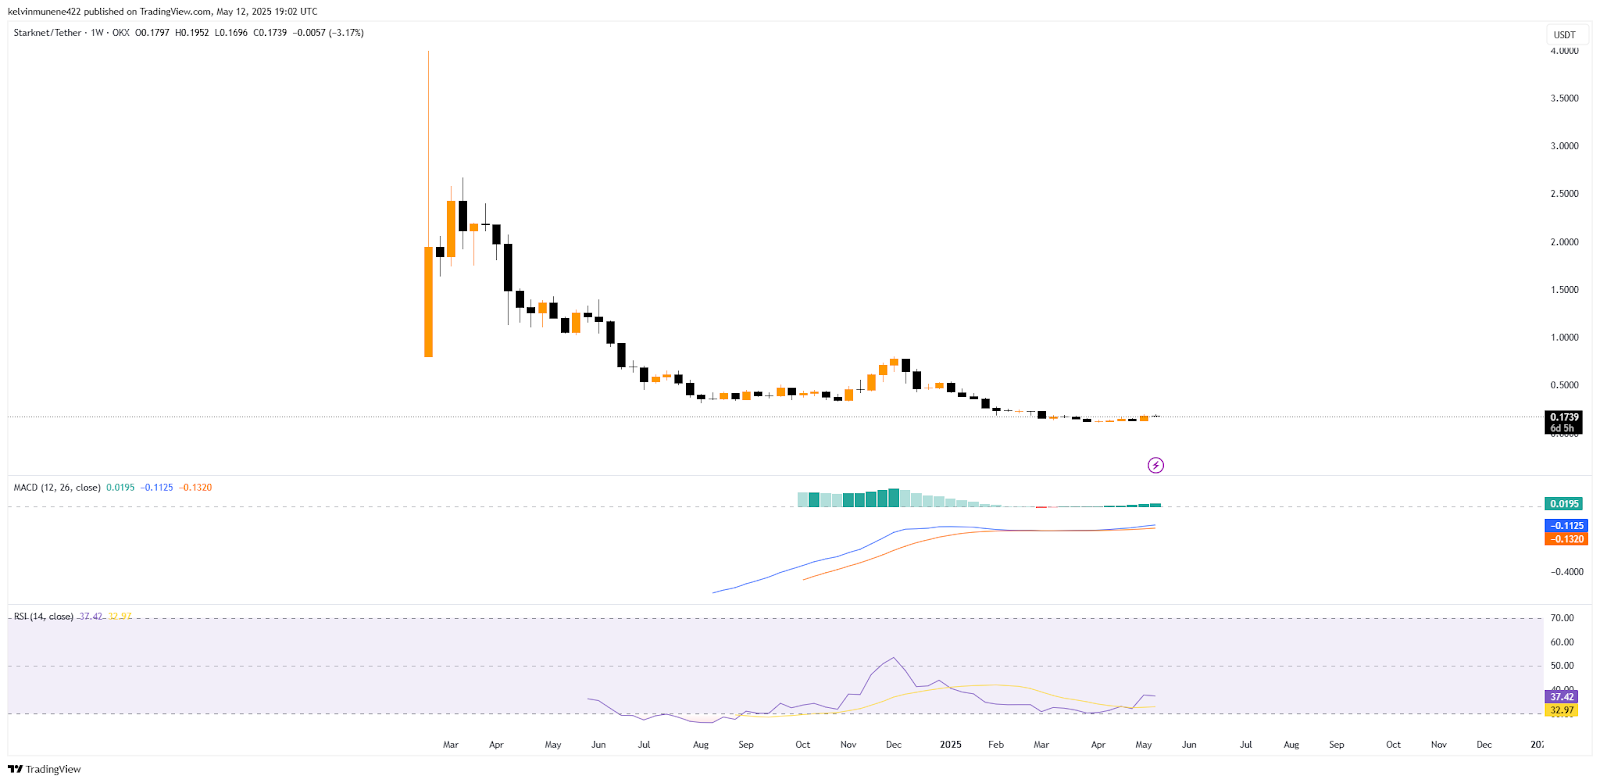
The MACD for STRK shows early signs of bullish momentum, with the MACD line at -0.1125 above the signal line at -0.1320. This indicates a potential shift in trend direction. What reinforces this signal further is the presence of green histogram bars, which reflect increasing upward momentum and support the argument that sellers are losing control.
 Source: TradingView
 The RSI (Relative Strength Index) currently reads 37.42, recovering from a recent low of 32.97. Although still below the neutral 50 level, this rise suggests that bearish pressure is fading and the market may be gearing up for a reversal or consolidation before a potential breakout. The RSI’s movement away from oversold territory aligns well with the bullish MACD crossover, creating a technical setup that favors buyers.
Starknet (STRK) Price Forecast Based on Fair Value Gap
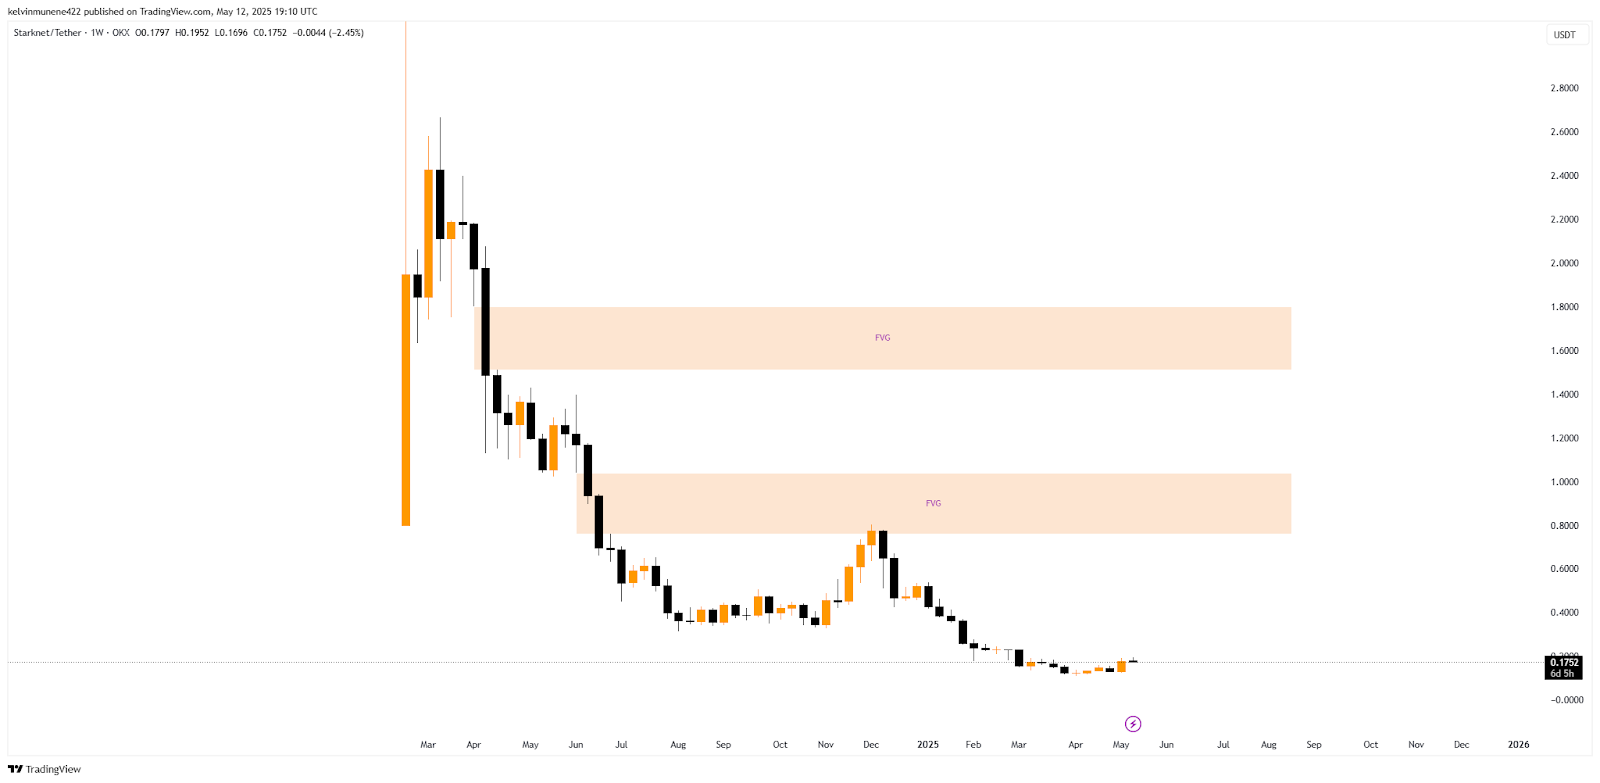
The first FVG is between $1.03 and $0.76, while the second, higher zone sits between $1.80 and $1.51. These imbalances in price action were formed during sharp downward moves and remain unfilled, which often invites the price to revisit and fill the gap. Currently trading around $0.1752, STRK has significant ground to cover before approaching the nearest FVG.
 Source: TradingView
 However, if bullish momentum continues, the token’s price could aim to test the immediate FVG near $0.76-$1.03. Historically, price tends to gravitate toward unfilled FVGs, and this region could serve as a magnet, especially if volume picks up and market sentiment turns positive.
Should STRK break through this initial FVG, the next logical target would be the $1.51-$1.80 zone, which could present stronger resistance due to the larger price inefficiency it represents. However, these levels also mark areas where significant sell-side pressure may return.
Starknet (STRK) Price Forecast Based on MA Ribbon Analysis
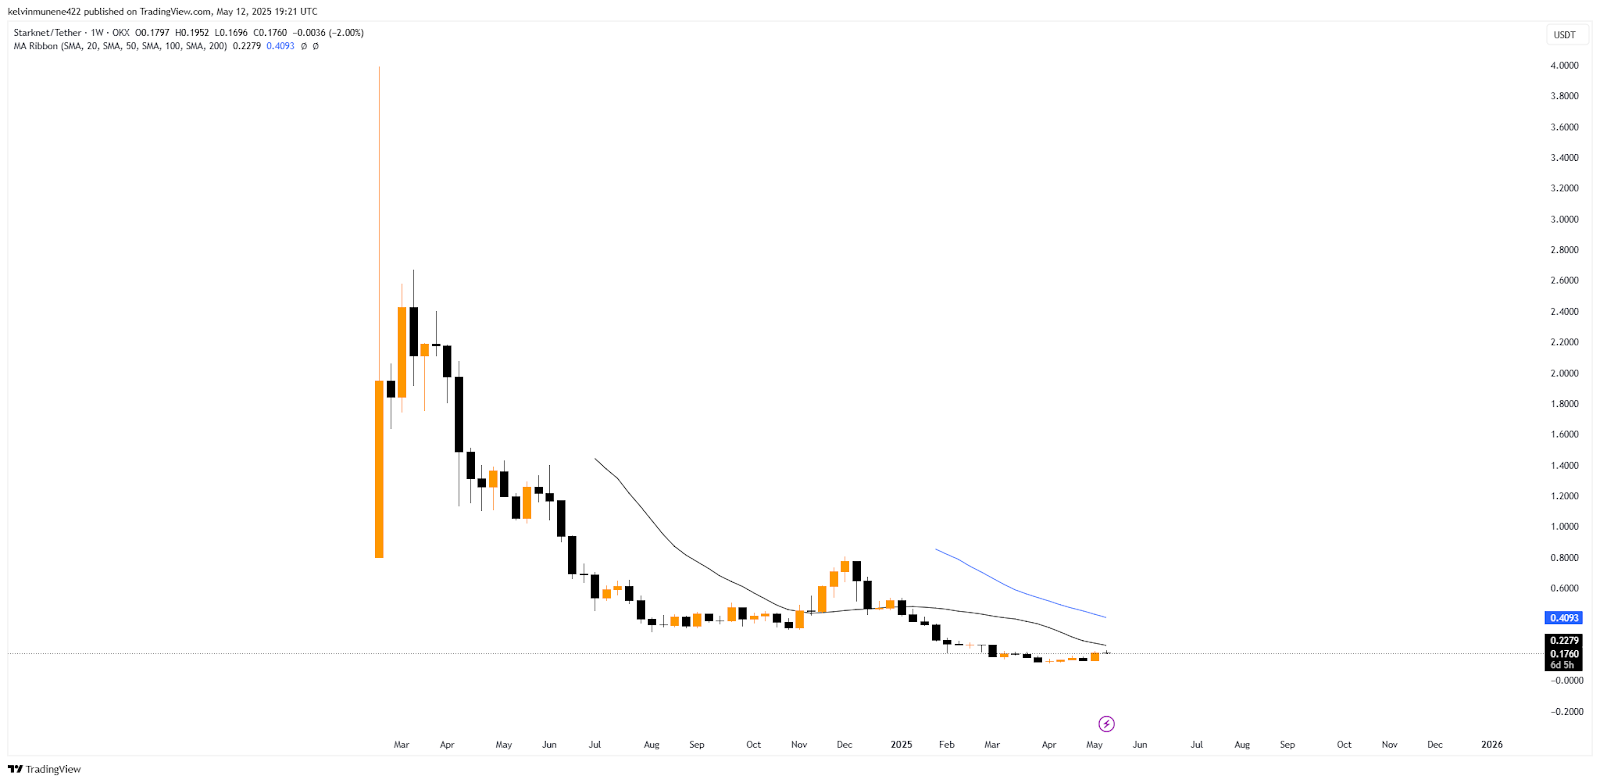
The 20-week moving average (MA) for STRK currently sits below the 50-week MA, signaling that the asset remains in a sustained bearish trend. Specifically, the 20 MA is at $0.2279, while the 50 MA is higher at $0.4093. This alignment confirms that short-term momentum is still weaker than the medium-term trend, often indicating that sellers remain in control.
 Source: TradingView
 STRK is currently trading around $0.1760, which is still well below the 20 and 50 MA levels. For any potential reversal to gain traction, the token must reclaim the 20 MA and then target the 50 MA. Until that happens, the MA ribbon reflects bearish dominance, with lower highs and consistent rejection zones along the trendline.
Starknet (STRK) Price Forecast Based on Fib Analysis
The Fibonacci retracement tool on STRK’s weekly chart highlights key resistance zones aligned with potential reversal or breakout targets. Notably, the nearest resistance is the 0.236 level at $1.0248, which aligns closely with previous structural support and a fair value gap zone.
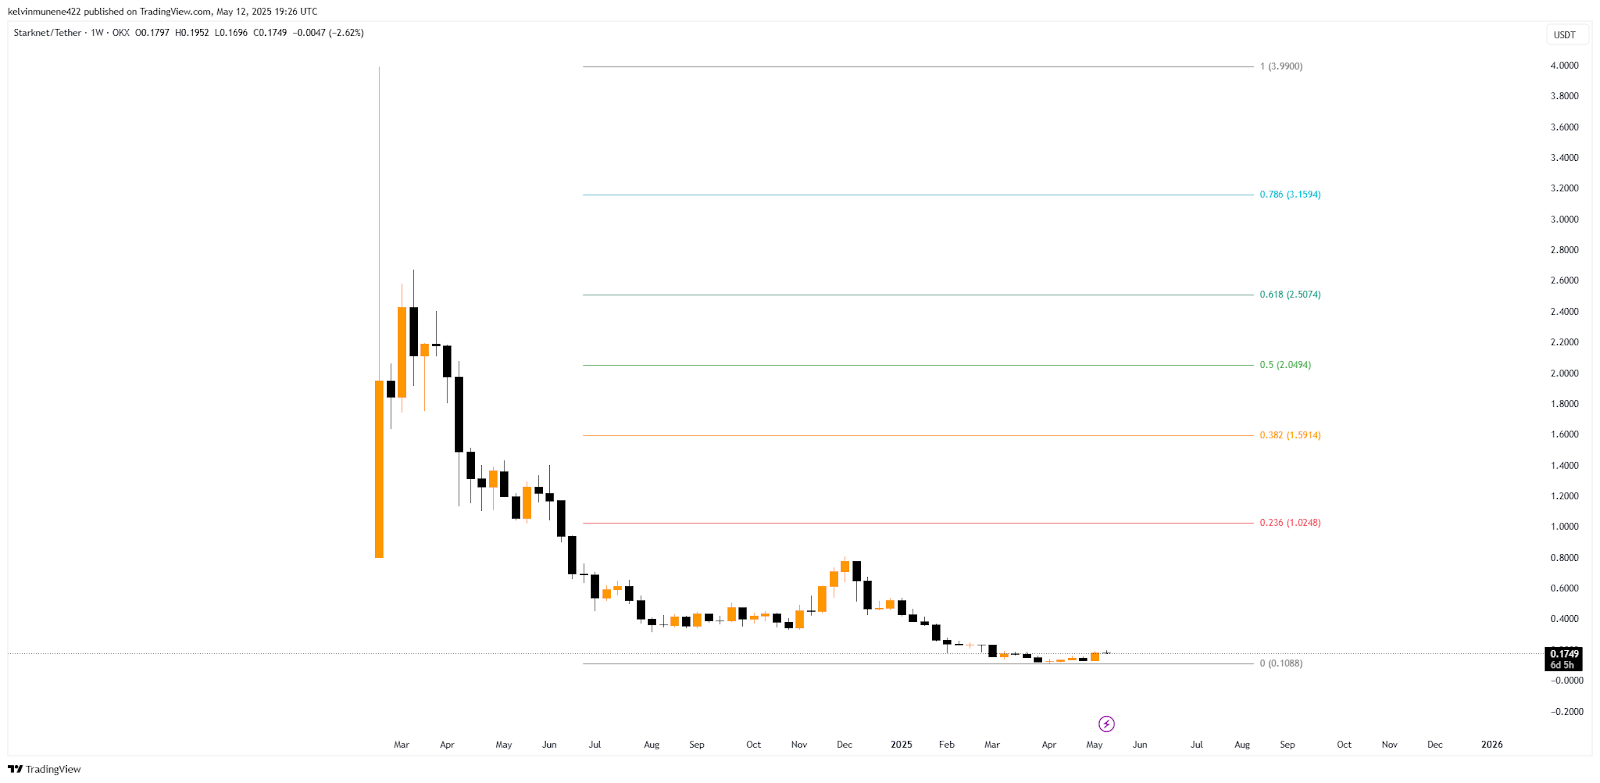 Source: TradingView
 A decisive break above this mark could trigger a move toward the 0.382 zone at $1.5914, a level that historically acts as a mid-recovery checkpoint in Fibonacci analysis. The 0.5 and 0.618 zones—at $2.0494 and $2.5074, respectively—represent more ambitious bullish targets, often watched by swing traders as confirmation of a strong reversal.
These also overlap with key historical resistance zones where the token’s price reacted sharply in previous rallies. With STRK currently holding above its all-time low of $0.1088, the Fibonacci retracement levels offer a clear roadmap for potential recovery zones. Each Fib level marks a statistically significant hurdle that bulls must overcome to reclaim higher ground.
Starknet (STRK) Price Prediction 2025
According to CryptoTale’s forecast, STRK could surge to $0.05–$3.50, revisiting its previous all-time high due to post-BTC halving hype, mass investor euphoria, and increased dApp activity. However, overvaluation risks could spark sharp corrections late in the year.
Starknet (STRK) Price Prediction 2026
A post-peak correction sets in. STRK is expected to retrace significantly to $1.00–$2.50, driven by profit-taking, reduced user engagement, and broader bearish sentiment. Starknet’s long-term fundamentals may cushion it from deeper crashes, but they won’t stop downtrends.
Starknet (STRK) Price Prediction 2027
In this crypto winter phase, STRK could stabilize between $0.50 and $2.00. This reflects depressed market conditions, low volume, and cautious investor sentiment. Yet, ecosystem improvements, educational resources, and early accumulation position it for future recovery.
Starknet (STRK) Price Prediction 2028
As hype for the fifth BTC halving builds, STRK may rise to $3.50–$6.00. Developer activity, improved staking dynamics, and renewed community participation start driving attention back to the ecosystem. Market sentiment begins shifting from fear to optimism.
Starknet (STRK) Price Prediction 2029
STRK could push to $5.50–$10.00 as post-halving effects catalyze bullish sentiment. Increased onchain adoption, expansion of SN Stack implementations, and stronger governance integration position Starknet for higher utility and investor demand.
Starknet (STRK) Price Prediction 2030
CryptoTale predicts a minor correction year, with STRK likely to trade between $4.00 and $8.50. Profit-taking and slight regulatory pushback may create friction, but core ecosystem stability and token utility prevent drastic losses.
Starknet (STRK) Price Prediction 2031
STRK is projected to climb back to $6.00–$9.50, fueled by institutional interest, stabilized governance, and increasing developer onboarding. Renewed investor trust and technical indicators may signal a confirmed reversal and uptrend continuation.
Starknet (STRK) Price Prediction 2032
Bullish momentum accelerates, with STRK possibly reaching $9.00–$16.00. Market-wide optimism, L2 maturity, and reduced Ethereum congestion amplify Starknet adoption. Token staking, dApp expansion, the 6th BTC halving, and favorable funding rates support sustained growth.
Starknet (STRK) Price Prediction 2033
As the crypto cycle peaks, STRK could soar to $15.50–$25.00. Cross-chain integrations, L3 innovation, and regulatory clarity unlock new investor classes. Hype fuels price, but caution grows amid stretched valuations.
Starknet (STRK) Price Prediction 2034
STRK is forecasted to decline modestly to $12.50–$22.00. Investors begin profit-taking as overvaluation concerns rise. Network usage remains strong, but price stabilizes as the market shifts focus to regulatory developments and real-world adoption milestones.
Starknet (STRK) Price Prediction 2035
Fueled by adoption, institutional inflows, and the upcoming 2036 BTC halving, STRK may reach $20.00–$30.00. Regulatory stability, mainstream integration, and robust SN Stack deployments drive demand for utility and governance participation.
Related: Quant Price Prediction 2025-2035: Will It Hit $1,500 by 2035?
FAQs
What is STRK?
STRK is the native token of Starknet, a Layer 2 Ethereum scaling solution using STARK-based zero-knowledge proofs for fast, secure, and low-cost transactions.
How can I purchase STRK?
You can buy STRK on major cryptocurrency exchanges where it’s listed, using trading pairs like STRK/USDT or STRK/ETH.
Is investing in STRK a wise decision?
STRK has strong tech fundamentals and community backing, but like all crypto, it carries risk. Research market trends and future potential before investing.
What’s the best way to securely store STRK?
Store STRK in a hardware wallet or any Ethereum-compatible wallet that supports Layer 2 assets for enhanced security.
Who is the founder of STRK?
STRK was developed by StarkWare, founded by Eli Ben-Sasson, Uri Kolodny, Michael Riabzev, and Alessandro Chiesa, to pioneer STARK-based Ethereum scaling.
Which year was STRK launched?
STRK launched in 2024 as part of Starknet’s broader decentralization and ecosystem activation plan.
What is STRK’s circulating supply?
As of now, STRK has a circulating supply of approximately 3.1 billion tokens out of a total supply of 10 billion.
Will STRK surpass its all-time high?
According to price forecasts, depending on market conditions, STRK may surpass its all-time high of $3.66 by 2028.
What is STRK’s lowest price?
STRK’s all-time low is $0.1103, reached during a prolonged market downtrend.
What will the price of STRK be in 2025?
STRK could range between $0.05 and $3.50 in 2025, driven by market euphoria following the BTC halving event.
What will the price of STRK be in 2028?
STRK may trade between $3.50 and $6.00 as halving momentum, staking updates, and ecosystem growth lift investor optimism.
What will the price of STRK be in 2030?
Forecasts suggest STRK will trade between $4.00 and $8.50 amid mild corrections and consistent network usage.
What will the price of STRK be in 2032?
STRK could hit $9.00–$16.00, supported by the sixth BTC halving, full SN Stack deployment, and strong developer engagement.
What will the price of STRK be in 2035?
STRK may reach $20.00–$30.00, fueled by mainstream adoption, institutional inflows, and expanding use cases across decentralized apps.
The post Starknet Price Prediction 2025-35: Will It Hit $30 by 2035? appeared first on Cryptotale.