Date: Sat, May 17, 2025 | 05:58 PM GMT
The cryptocurrency market has mounted a solid comeback in recent weeks, with Ethereum (ETH) continuing to lead the charge. ETH has surged more than 53% in the past month and is now trading below $2,500 after hitting a high of $2,700 — a level not seen since early January. This renewed bullish momentum is lifting sentiment across altcoins , including The Graph (GRT).
GRT has recorded strong monthly gains of over 35%, although it’s slightly down on the day by around 5%. But instead of causing concern, this pullback is turning heads. The token is now retesting a critical breakout level — one that could act as a launchpad for its next move.
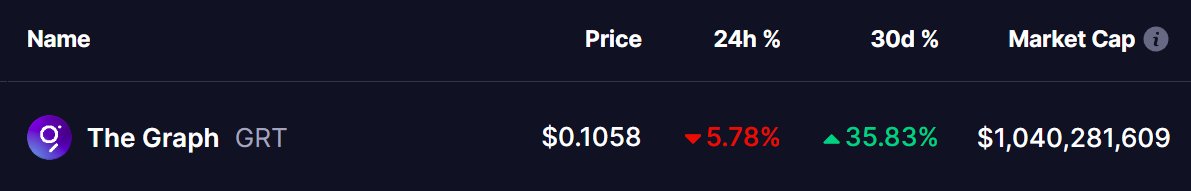 Source: Coinmarketcap
 Retesting Inverse Head and Shoulders Breakout
A closer look at the daily chart reveals a textbook inverse head and shoulders pattern — a powerful bullish reversal formation. This pattern typically indicates that a downtrend has bottomed out and a new uptrend is potentially starting.
GRT confirmed this bullish pattern earlier this month. The token bounced from the right shoulder near $0.086 and broke out above the neckline resistance at $0.1070. That breakout took the price up to a local high of $0.1311.
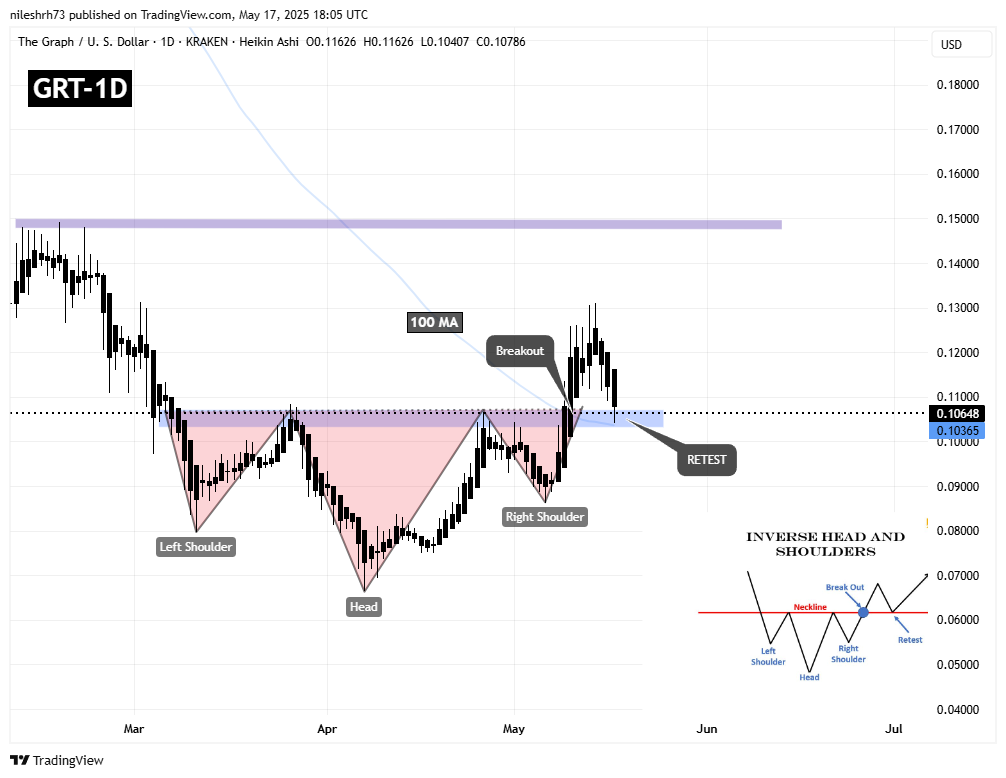 The Graph (GRT) Daily Chart/Coinsprobe (Source: Tradingview)
 However, GRT couldn’t maintain that momentum and has since corrected over 15%. Now, the price is revisiting the $0.10 zone — which previously acted as resistance and is now being tested as support. Coincidentally, this level aligns with the 100-day moving average (100 MA), adding further significance to the area.
What’s Next for GRT?
The $0.10 zone is now a critical pivot. If GRT can hold this support and bounce, it would validate the inverse head and shoulders breakout and suggest further upside.
- If support holds: The next bullish target lies around $0.1472 — a 40% potential upside from current levels.
- If support fails: A breakdown below $0.10 could invalidate the bullish structure, potentially leading to further downside.
Much will depend on broader crypto sentiment. If Ethereum continues its rally and altcoins stay strong, GRT could follow suit with a renewed push higher from this retest zone.
Disclaimer: This article is for informational purposes only and not financial advice. Always do your own research before making investment decisions.