Bitget App
Trade smarter
Open
HomepageSign up
Bitget>
News>
Ethereum at a Crossroads: V-Shaped Recovery or Short-Term Pullback?

Ethereum at a Crossroads: V-Shaped Recovery or Short-Term Pullback?

Coindoo2025/05/21 00:01
By: Coindoo
ETH-0.19%
Ethereum at a Crossroads: V-Shaped Recovery or Short-Term Pullback? image 0

Ethereum (ETH) is showing conflicting signals as it navigates a pivotal zone. Analysts are closely watching technical and on-chain indicators to determine whether the asset is due for a short-term correction or preparing for a full-fledged rally reminiscent of the 2020–2021 cycle.

Short-Term Sell Signal: TD Sequential Indicator Flashes Warning

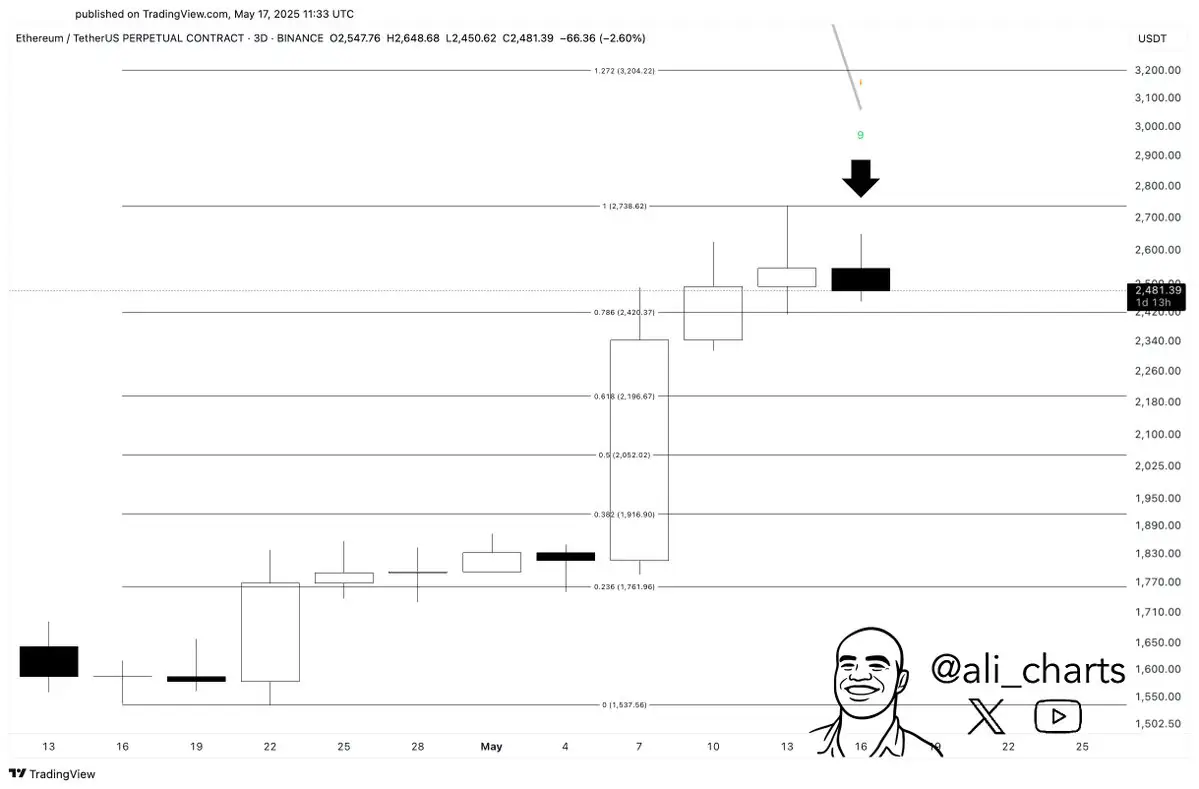
According to market analyst Ali Martinez, Ethereum could be headed for a brief pullback. The TD Sequential indicator has flashed a sell signal on the 3-day chart, following a strong move upward toward the $2,600 range.

“ETH could be bound for a brief correction,” Ali noted, suggesting the momentum may be fading after a strong rally.

This indicator has historically been a reliable signal for short-term trend reversals — particularly when markets are overheated.
Ethereum at a Crossroads: V-Shaped Recovery or Short-Term Pullback? image 1

Key Support at $2,400: On-Chain Data Suggests Strong Demand Zone

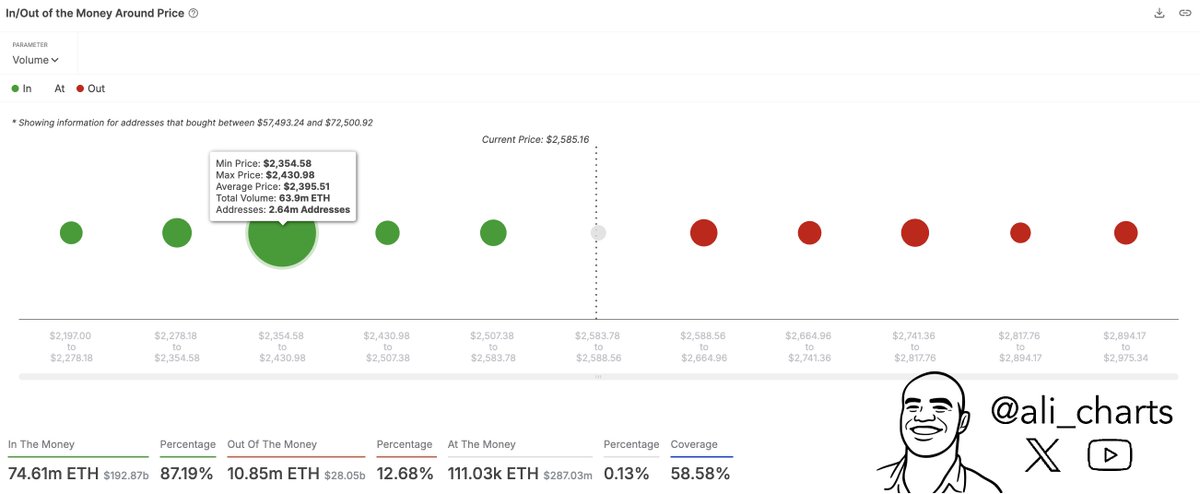
On-chain insights from SentoraHQ, shared by Ali, show a heavy concentration of wallet activity between $2,354 and $2,431, making $2,400 a critical support level.

  • This zone includes 6.3 million ETH held by 2.64 million addresses.
  • Ethereum is currently trading slightly above this cluster, around $2,480.

If ETH fails to hold this level, it could quickly fall to lower Fibonacci levels. But if the support holds, it may act as a springboard for another leg higher.
Ethereum at a Crossroads: V-Shaped Recovery or Short-Term Pullback? image 2

📈 Bullish Macro Structure: V-Shaped Recovery In Progress?

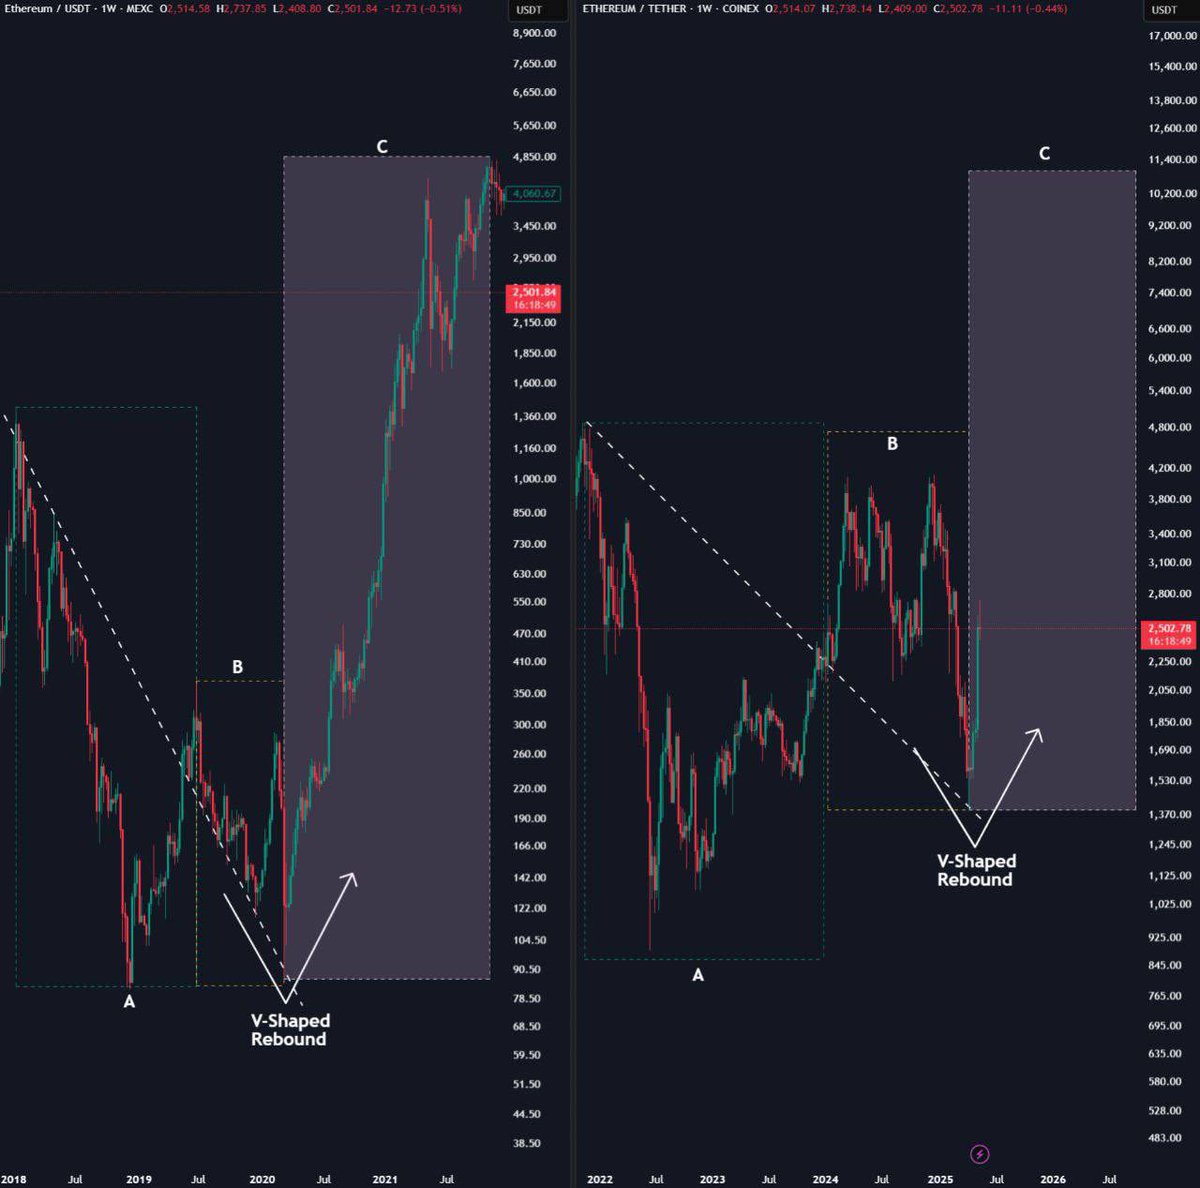
Adding a longer-term perspective, crypto analyst Ash believes Ethereum is undergoing a V-shaped rebound, mirroring the structure seen during the 2020–2021 cycle.

His comparison of the current weekly ETH chart to the historical rebound pattern suggests Ethereum may already be mid-recovery, and if the pattern plays out similarly, new highs could be on the horizon.

“Study the 2020–2021 cycle and you’ll know what happens next,” Ash stated confidently.
Ethereum at a Crossroads: V-Shaped Recovery or Short-Term Pullback? image 3

Final Takeaway

Ethereum’s current position is precarious but promising. Traders should watch:

  • $2,400 as a key support line.
  • Whether the TD Sequential sell signal triggers follow-through selling.
  • If the macro structure aligns with past bullish recovery phases.

Short-term volatility may shake out over-leveraged positions, but the long-term chart still looks structurally bullish. The next few days will be crucial in determining whether ETH dips before ripping — or continues marching upward without pause.

Disclaimer: The content of this article solely reflects the author's opinion and does not represent the platform in any capacity. This article is not intended to serve as a reference for making investment decisions.
PoolX: Earn new token airdrops
Lock your assets and earn 10%+ APR
Lock now!

You may also like

New spot margin trading pair — HOLO/USDT!
Bitget Announcement2025/09/12 07:46
FUN drops by 32.34% within 24 hours as it faces a steep short-term downturn

- FUN plunged 32.34% in 24 hours to $0.008938, marking a 541.8% monthly loss amid prolonged bearish trends. - Technical breakdowns, elevated selling pressure, and forced liquidations highlight deteriorating market sentiment and risk-off behavior. - Analysts identify key support below $0.0080 as critical, with bearish momentum confirmed by RSI (<30) and MACD indicators. - A trend-following backtest strategy proposes short positions based on technical signals to capitalize on extended downward trajectories.

Bitget-RWA2025/09/12 06:14
OPEN has dropped by 189.51% within 24 hours during a significant market pullback

- OPEN's price plummeted 189.51% in 24 hours to $0.8907, marking its largest intraday decline in history. - The token fell 3793.63% over 7 days, matching identical monthly and yearly declines, signaling severe bearish momentum. - Technical analysts cite broken support levels and lack of bullish catalysts as key drivers of the sustained sell-off. - Absence of stabilizing volume or reversal patterns leaves the market vulnerable to further downward pressure.

Bitget-RWA2025/09/12 06:14
New spot margin trading pair — LINEA/USDT!
Bitget Announcement2025/09/11 10:04

Trending news

More
1
New spot margin trading pair — HOLO/USDT!
2
FUN drops by 32.34% within 24 hours as it faces a steep short-term downturn

Crypto prices

More
Bitcoin
Bitcoin
BTC
$115,924.2
+0.72%
Ethereum
Ethereum
ETH
$4,699.34
+3.69%
XRP
XRP
XRP
$3.15
+4.40%
Tether USDt
Tether USDt
USDT
$1
+0.03%
BNB
BNB
BNB
$941
+3.75%
Solana
Solana
SOL
$240.72
+0.75%
USDC
USDC
USDC
$0.9998
-0.00%
Dogecoin
Dogecoin
DOGE
$0.3032
+14.96%
Cardano
Cardano
ADA
$0.9480
+6.74%
TRON
TRON
TRX
$0.3511
+0.81%
How to sell PI
Bitget lists PI – Buy or sell PI quickly on Bitget!
Trade now
Become a trader now?A welcome pack worth 6200 USDT for new users!
Sign up now
Trade smarter