- Cardano price today trades near $0.788, facing rejection near the $0.80 Fibonacci level.
- Short-term indicators suggest a cooling of momentum, with RSI nearing overbought conditions.
- A daily close above $0.8005 could confirm breakout continuation toward $0.84.
After a strong recovery wave, the Cardano price today is trading near $0.788, consolidating just below the psychological $0.80 level. This recent Cardano price spike follows a bounce from sub-$0.72 zones, driven by technical breakout patterns and renewed risk appetite across altcoins. However, ADA now sits at a crucial juncture, with short-term charts suggesting possible rejection pressure from an upper resistance cluster.
 ADAUSD price dynamics (Source: TradingView)
 The rally comes amid bullish cues from broader crypto majors and improving sentiment, but as key indicators enter overbought zones, traders are asking: Why Cardano price going up today, and can it hold above near-term supports?
What’s Happening With Cardano’s Price?
 ADAUSD price dynamics (Source: TradingView)
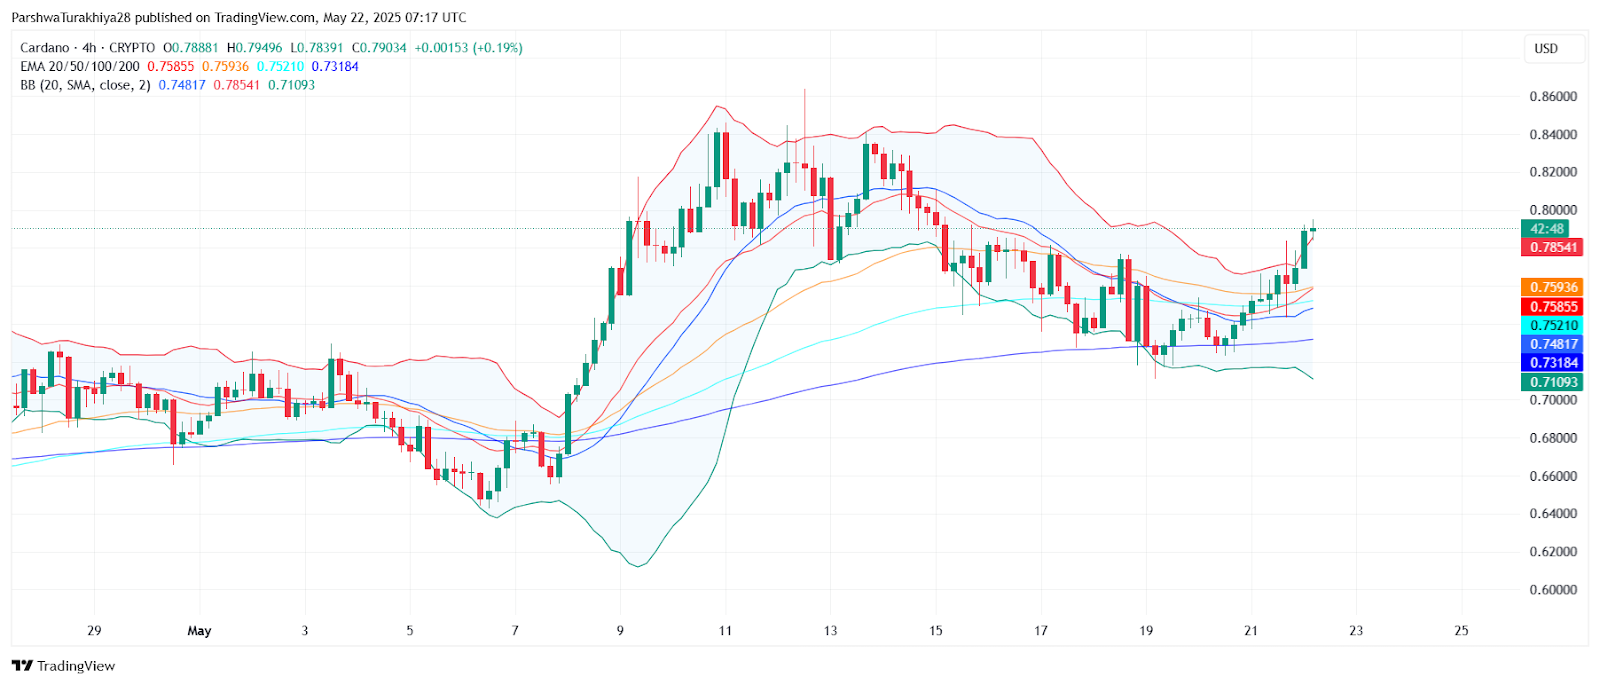
 On the 4-hour chart, ADA has decisively broken past the 20, 50, and 100-EMA zones, reclaiming ground above $0.75 and $0.78. Price action remains supported by the middle Bollinger Band at $0.748, while the upper band currently caps upside at $0.785. The Cardano price update also highlights increased trading volume, signaling buyer participation near the recent breakout zone.
From a pattern structure standpoint, ADA has invalidated the previous descending wedge and surged into the $0.78–$0.80 resistance band. However, with RSI approaching 70 and MACD lines beginning to flatten, momentum may be due for a short cooldown.
Cardano Price Action Suggests Cautious Optimism
 ADAUSD price dynamics (Source: TradingView)
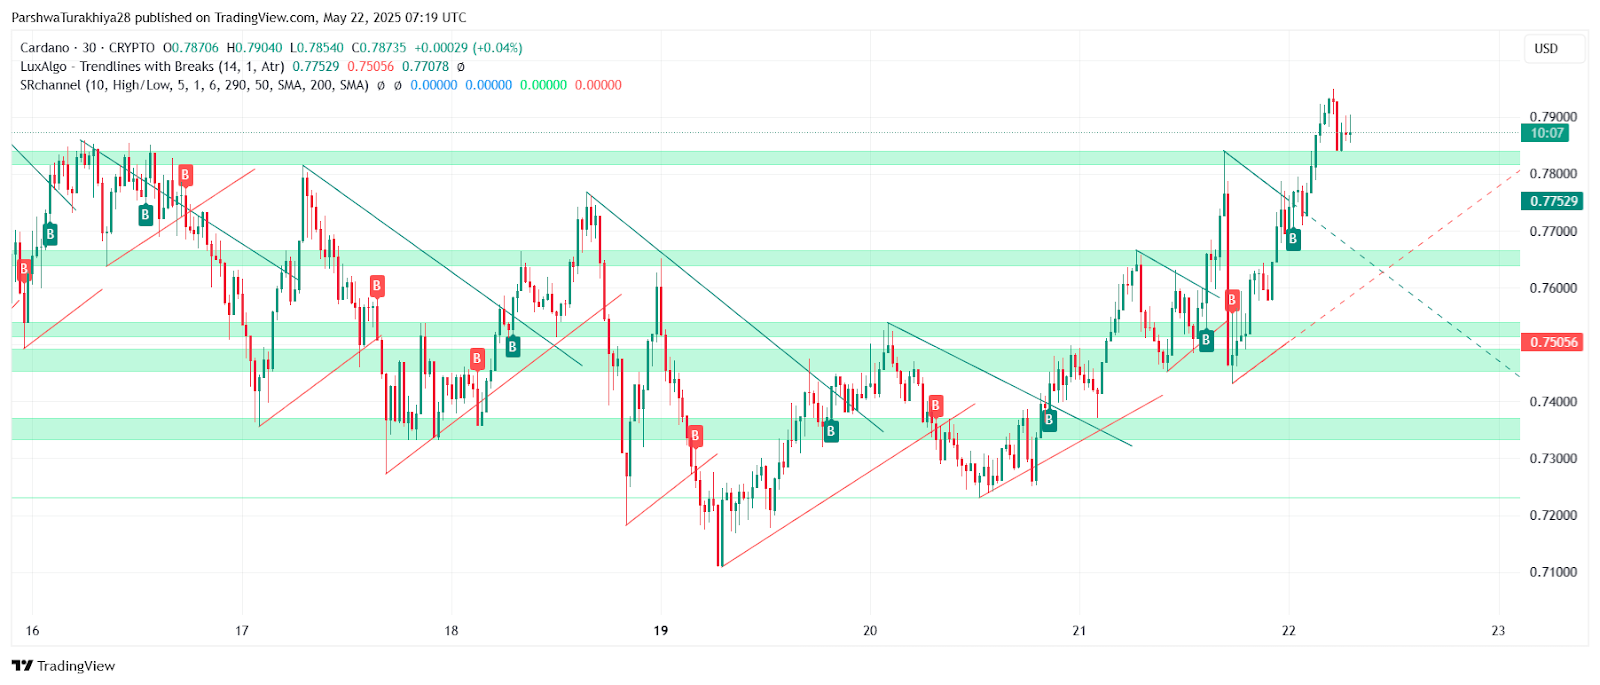
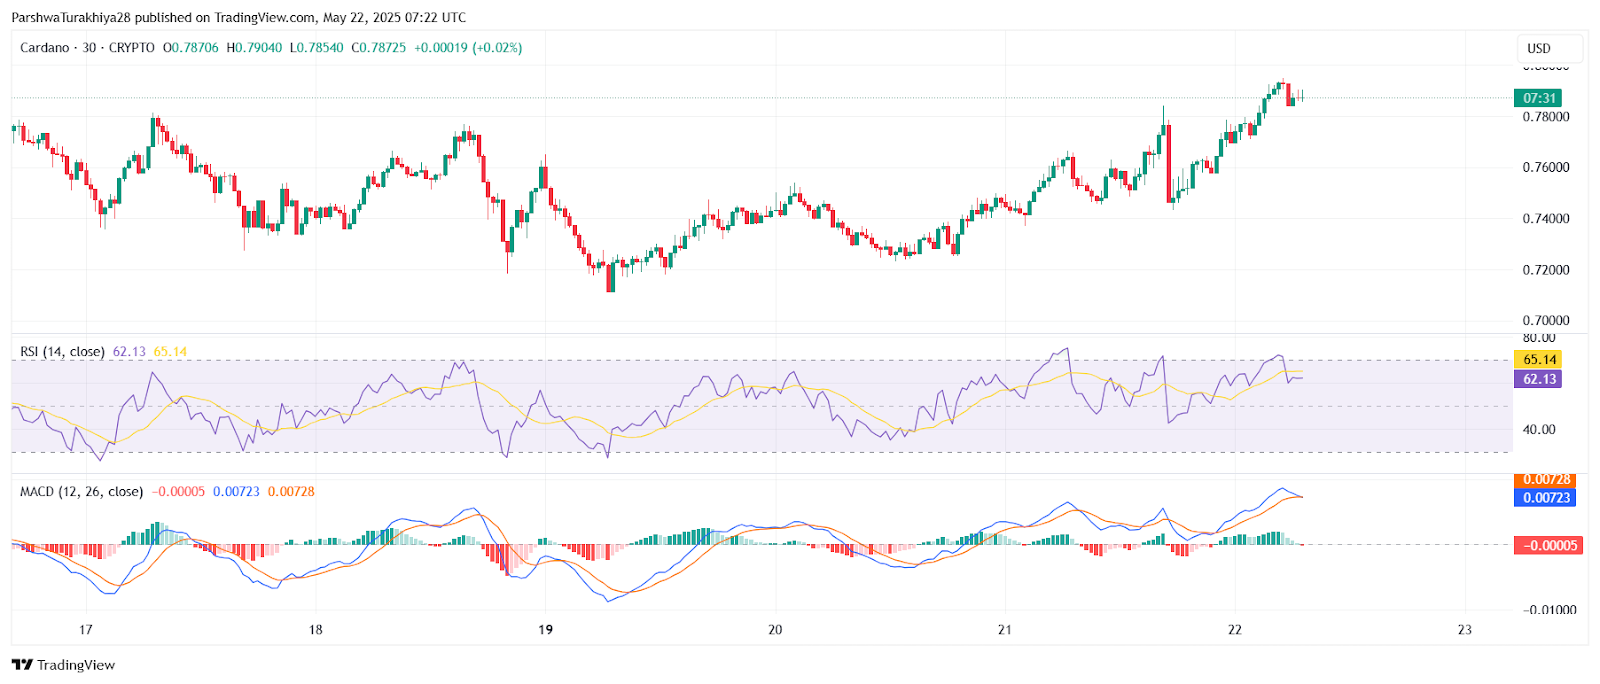
 Zooming into the 30-minute chart, Cardano price action shows a strong vertical climb that may soon meet short-term exhaustion. A minor bearish divergence is appearing between price and RSI, hinting at slowing bullish momentum despite the recent Cardano price spikes.
 ADAUSD price dynamics (Source: TradingView)
 Support zones to watch include $0.775 and $0.758, which coincide with Fibonacci and EMA clusters. If these levels hold, ADA could maintain its bullish structure and potentially retest $0.80 again. A rejection here, however, could open a retest toward $0.752 or even $0.735.
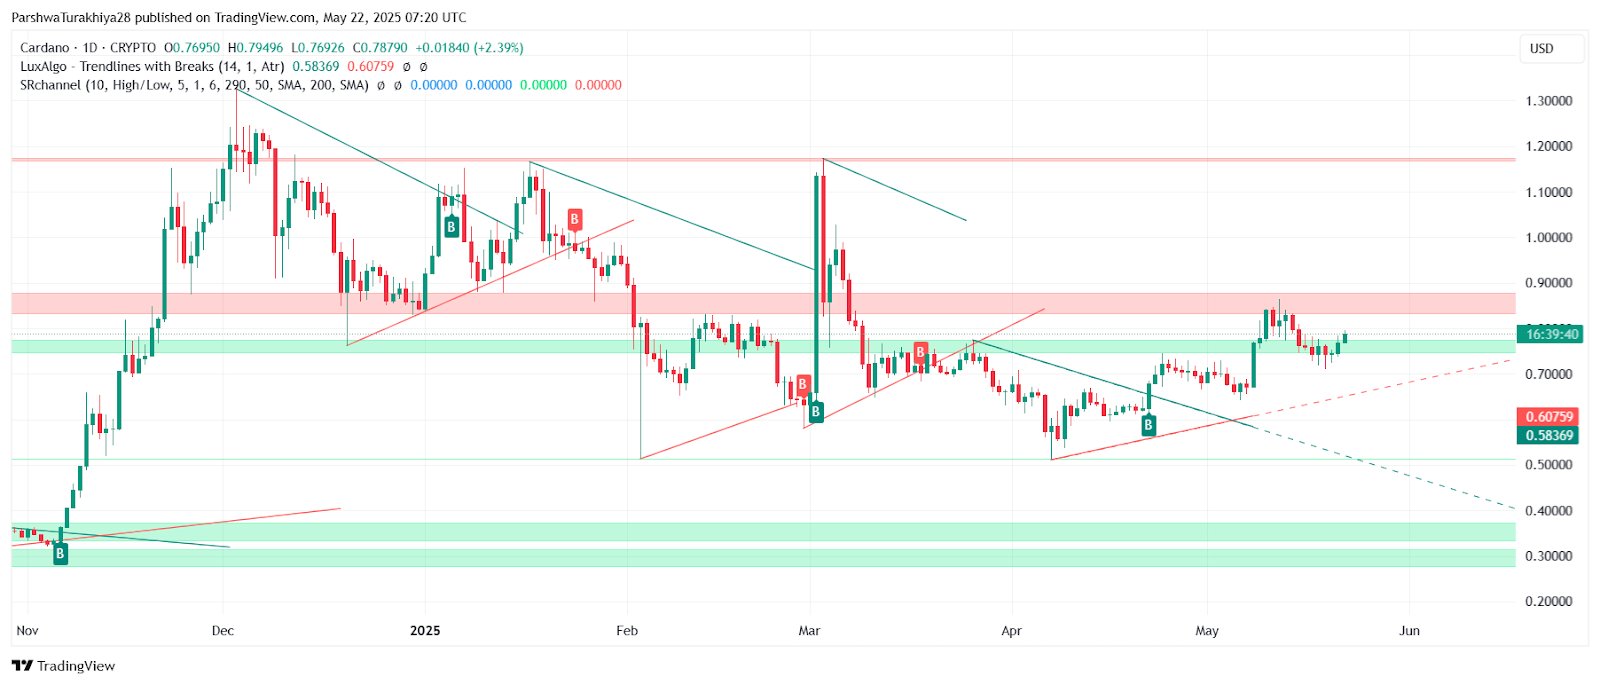
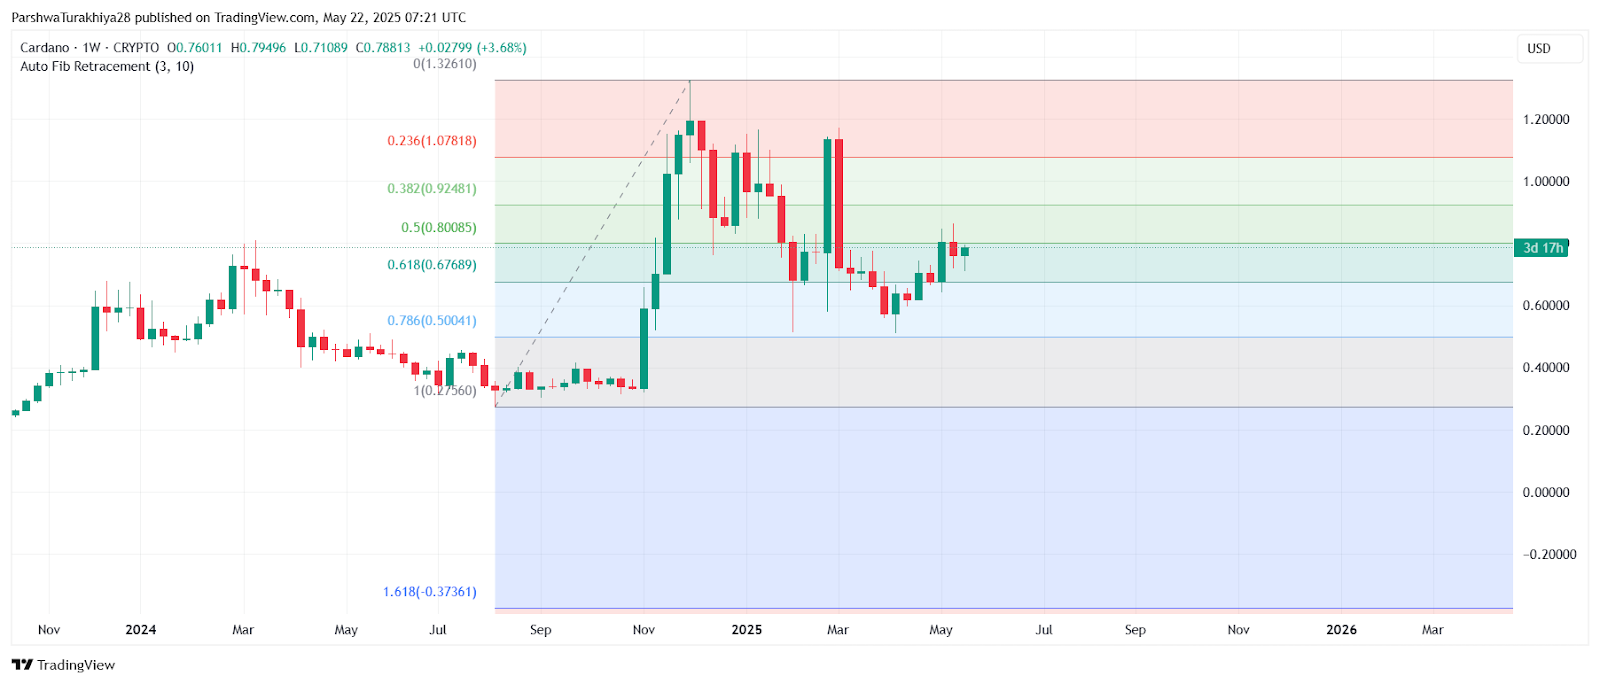
The 1-day chart shows ADA building a base above the 0.5 Fibonacci retracement at $0.8005 (measured from the July 2023 low to February 2024 high), making this zone critical for sustained upside. A daily close above $0.80 would confirm a breakout continuation, possibly targeting $0.84 next.
Is Momentum Sustainable or Cooling Off?
 ADAUSD price dynamics (Source: TradingView)
 From a weekly perspective, the Cardano price volatility remains elevated but constructive. The price is currently pushing against the 0.5 Fib level with strength, having already cleared the 0.618 retracement at $0.676. Holding above $0.78 on higher timeframes will be vital for continued upward momentum.
Meanwhile, the RSI on the daily is nearing overbought territory, and MACD histograms are flattening out, suggesting that the immediate bullish impulse may be nearing completion. On-chain and market sentiment will be key in determining whether this rally transitions into a longer-term trend shift.
Short-Term Outlook: Cardano Eyes $0.84 If $0.80 Breaks
Here is a breakdown of key levels to watch for May 23:
| Indicator/Zone | Value ($ADA) | Outlook |
| Immediate Resistance | $0.8005 | Crucial Fib & psychological level |
| Next Upside Target | $0.840 | Breakout continuation zone |
| Key Support 1 | $0.775 | EMA support cluster |
| Key Support 2 | $0.752 | Mid-Bollinger band, horizontal |
| Daily RSI | 65.14 | Nearing overbought |
| MACD (30-min) | Flatting crossover | Momentum cooling |
While the Cardano price today remains bullish, failure to close above $0.80 could invite profit booking, especially given RSI saturation. If bulls manage to absorb sell pressure and sustain above $0.775, the trend remains intact for further gains. Otherwise, a near-term pullback toward the $0.74–$0.75 zone could offer re-entry opportunities for buyers.
Disclaimer: The information presented in this article is for informational and educational purposes only. The article does not constitute financial advice or advice of any kind. Coin Edition is not responsible for any losses incurred as a result of the utilization of content, products, or services mentioned. Readers are advised to exercise caution before taking any action related to the company.