The Huma Finance price today is trading around $0.0554 after a sharp rejection from intraday highs above $0.12 earlier this week. The retracement has been intense, and price action now shows significant signs of weakness across all major timeframes. As volatility cools following the vertical spike, traders are assessing whether Huma Finance can stabilize near support or face further pressure amid a broader crypto pullback.
Despite earlier euphoria, recent breakdowns suggest the move may have been more speculative than sustained, and technical indicators are beginning to reflect that sentiment shift. The question now dominating traders’ minds is: Why is the Huma Finance price going down today, and what are the chances of recovery from current levels?
What’s Happening With HUMA’s Price?
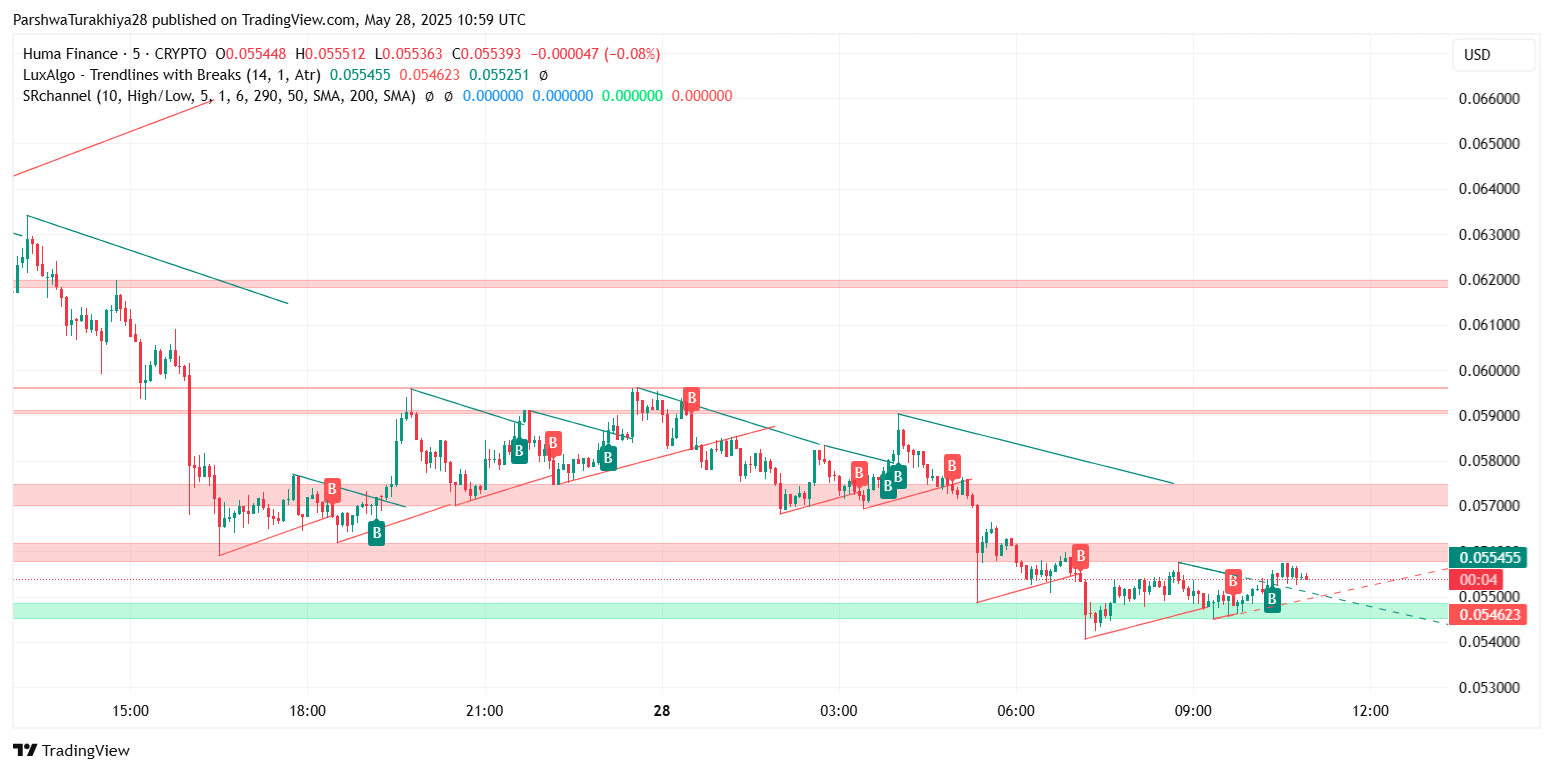 HUMA price forecast (Source: TradingView)
 After a near-vertical rally toward $0.12, Huma Finance price action has reversed sharply. The 30-minute chart shows multiple failed breakout attempts above the $0.058–$0.060 band, each followed by a swift selloff. As of writing, the token is testing support near $0.0545, with increasingly narrow consolidation structures forming—a typical sign of uncertainty after a parabolic move.
Descending trendlines from May 27 and 28 remain intact, while the indicators confirms bearish pressure with failed retests of dynamic resistance near $0.0581. The price is currently trading within a descending wedge, but no breakout confirmation has occurred, keeping momentum tilted to the downside unless bulls reclaim control above the upper boundary.
Bearish Signals on RSI and MACD Indicators
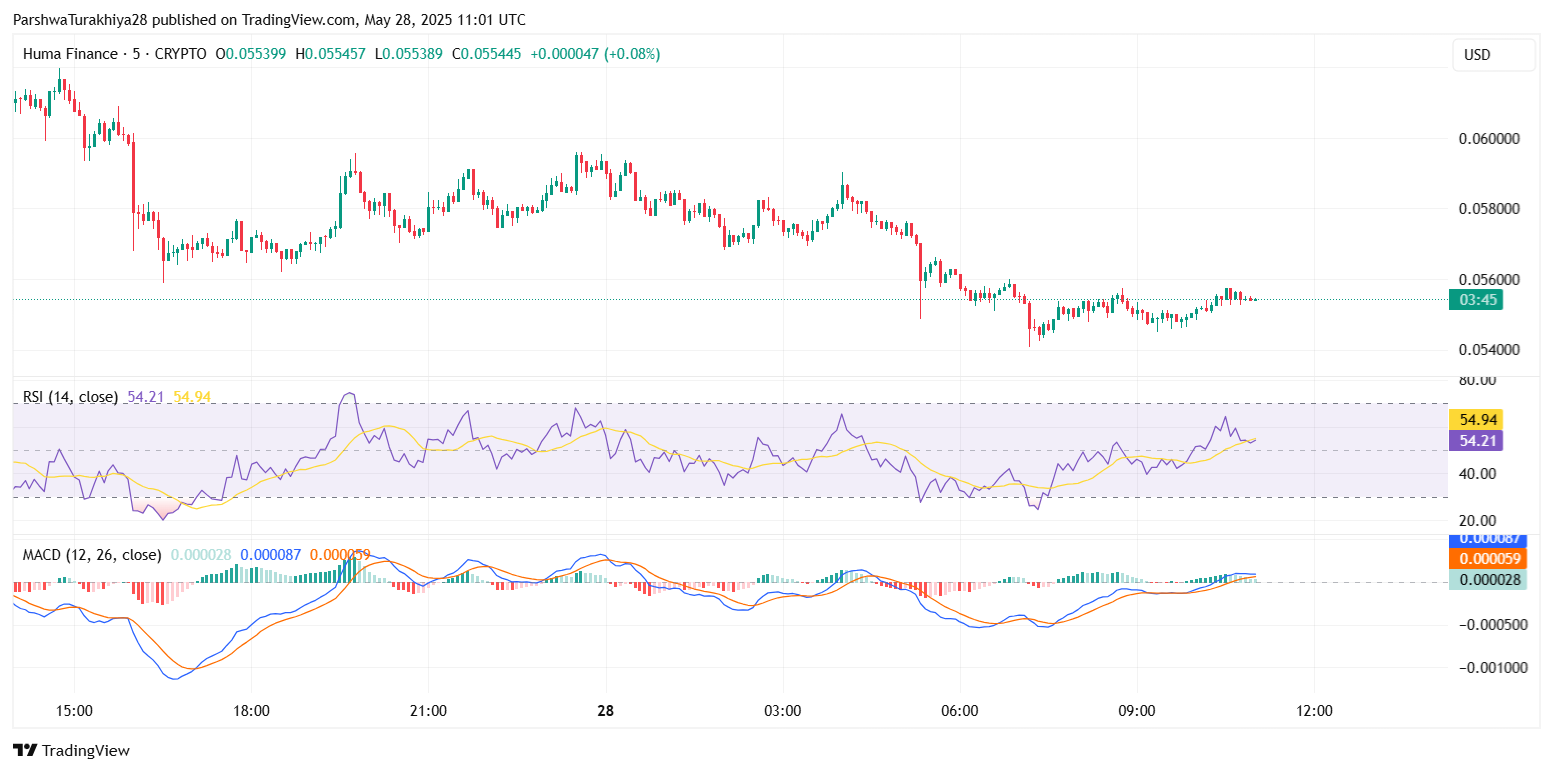 HUMA price forecast (Source: TradingView)
 Momentum indicators are showing clear signs of fading bullish strength. On the 5-minute and 15-minute charts, RSI readings hover around 54–55, which is neutral to mildly bearish. The failure to push above 60 reinforces the notion that buying power is not convincing at current levels.
MACD histograms, meanwhile, are flattening with a minor bearish crossover forming across both the 5-minute and 30-minute frames. The MACD lines are converging around the zero axis, highlighting the lack of a sustained trend and the risk of another leg down if short-term support at $0.054 fails to hold.
Cloud Pressure and EMA Clusters Add to Selling Weight
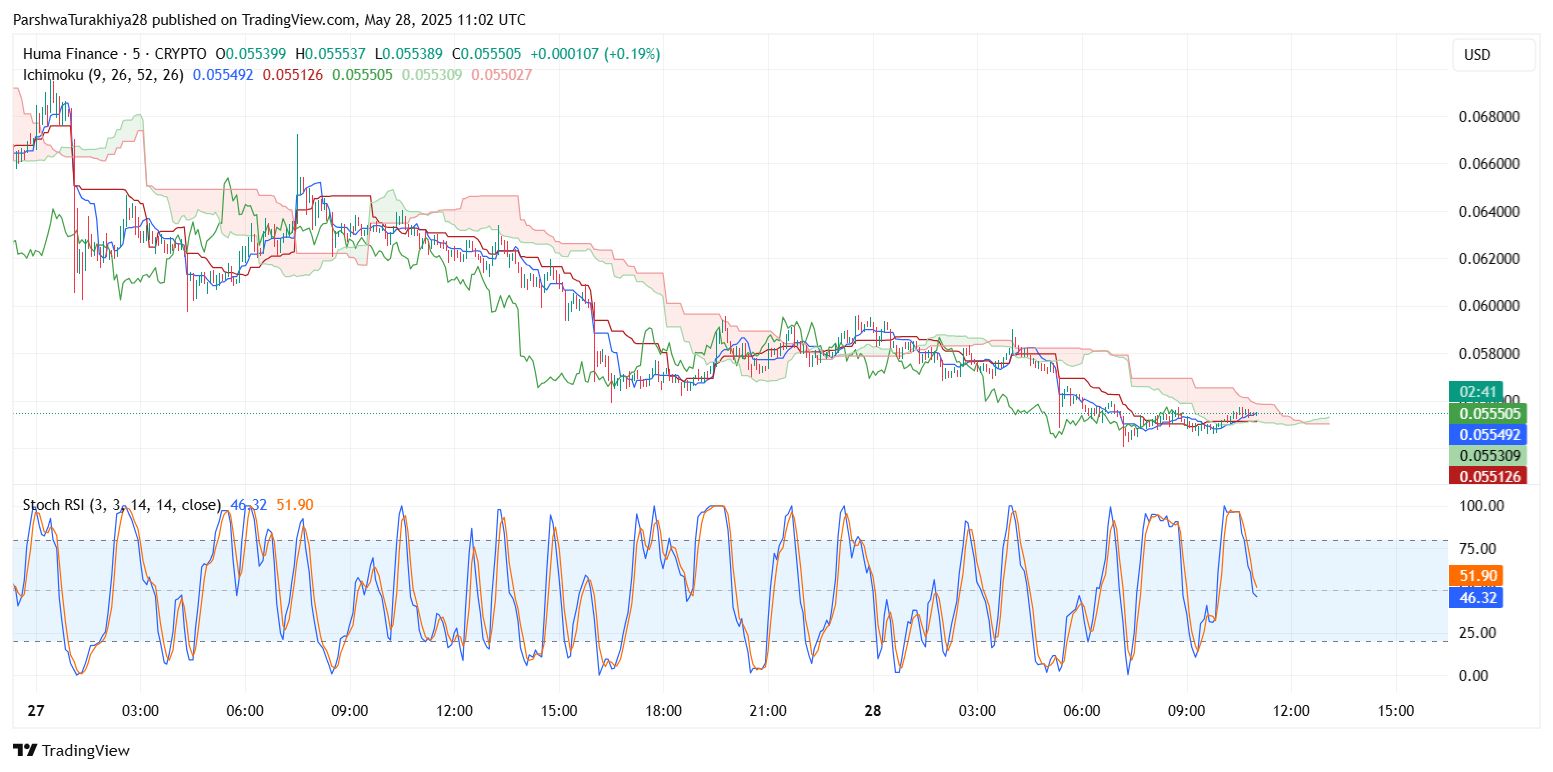 HUMA price forecast (Source: TradingView)
 Ichimoku Cloud analysis on the 5-minute chart indicates that Huma Finance price is trapped beneath a thinning cloud, with the baseline and conversion lines converging below current price. This suggests any upward momentum is unlikely to last unless a strong catalyst triggers a move above $0.0562.
Meanwhile, exponential moving averages (20/50/100/200) are tightly clustered between $0.0545 and $0.0565. This tight cluster could act as a resistance zone if bulls attempt to reclaim lost ground. Without a breakout, these EMAs may serve as a ceiling that pushes Huma Finance price lower.
Support and Resistance Levels to Watch
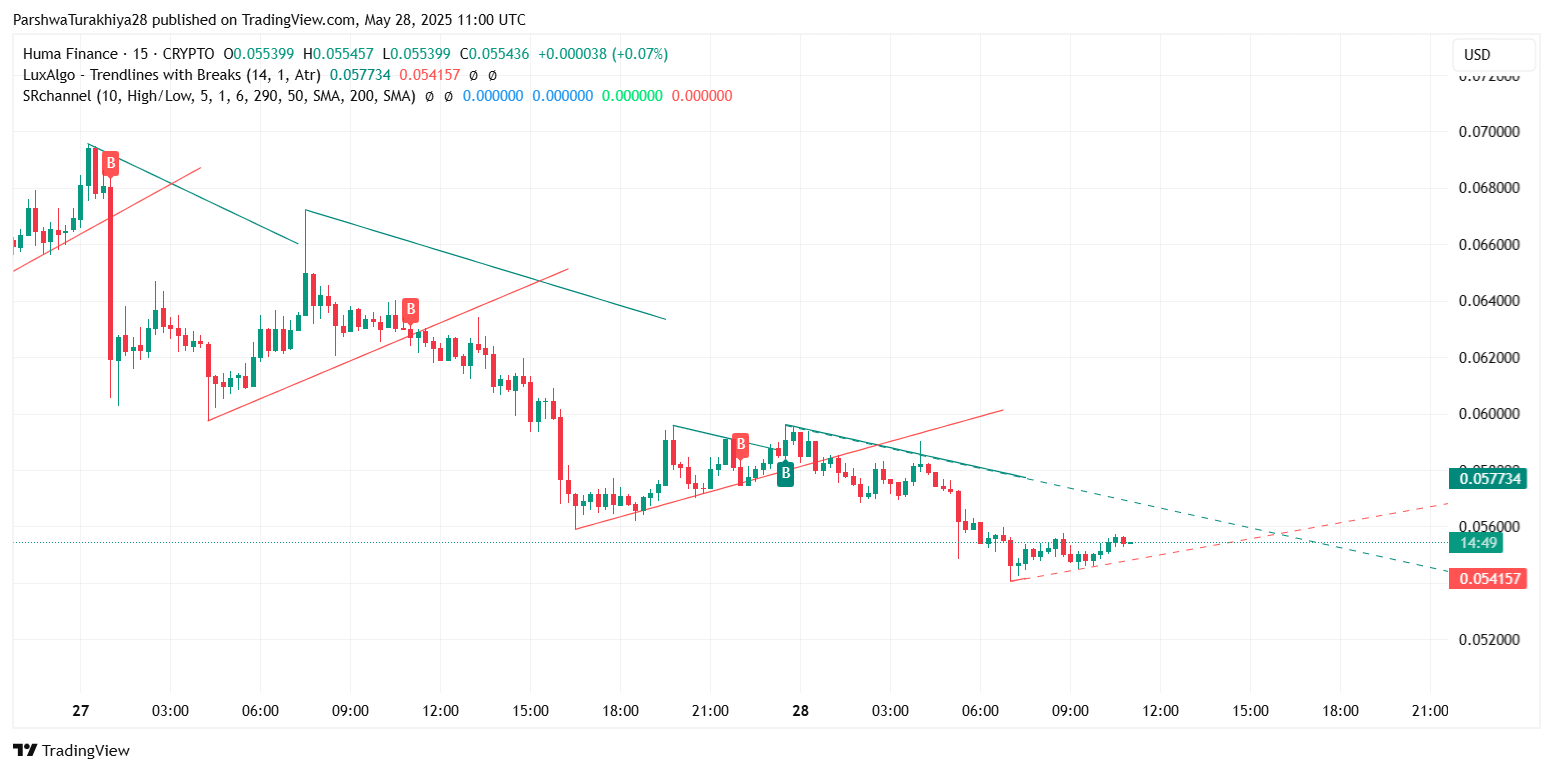 HUMA price forecast (Source: TradingView)
 Immediate support is located at $0.0540–$0.0545, which has been tested multiple times. A breakdown below this area could send Huma Finance price toward $0.0522 and even $0.0497, based on prior price memory.
On the flip side, resistance remains firm at $0.0580–$0.0605. Only a decisive break above $0.0605 with volume confirmation can reignite short-term bullish momentum and potentially target $0.0650 and $0.0700 again.
Short-Term Forecast: More Downside Likely Without Strong Reversal Signal
The current structure suggests that Huma Finance price volatility is compressing, but the directional bias remains bearish in the short term. As long as bulls fail to reclaim the upper levels of the descending wedge, the price is more likely to grind lower or remain flat with occasional false breakouts.
Here’s a technical breakdown of the outlook:
| Indicator | Signal |
| RSI (5-min/15-min) | Neutral to Mildly Bearish (54–55) |
| MACD | Weak Bullish Convergence, No Strong Momentum |
| Ichimoku Cloud | Price Below Cloud, No Reversal Yet |
| Trendlines | Descending, With No Breakout Confirmation |
| Bollinger Bands | Narrowing, Suggesting Lower Volatility |
| EMAs (20/50/100/200) | Bearish Cluster Resistance at $0.0562 |
Disclaimer: The information presented in this article is for informational and educational purposes only. The article does not constitute financial advice or advice of any kind. Coin Edition is not responsible for any losses incurred as a result of the utilization of content, products, or services mentioned. Readers are advised to exercise caution before taking any action related to the company.