
- Chainlink (LINK) faces resistance despite a recent 22.14% monthly price gain.
- On-chain data shows selling pressure and weak buyer momentum.
- DeFi integrations support a long-term bullish outlook for Chainlink.
Chainlink , a prominent decentralised oracle network, is currently navigating a pivotal phase as the price of its native token, LINK, grapples with mounting selling pressure.
Although LINK has enjoyed notable gains in recent weeks, the broader market sentiment reveals a fragile balance as technical and on-chain indicators flash warning signs of a potential correction.
Profit taking outweighs LINK accumulation impact
Despite recovering to a recent price of $15.99, marking a robust 22.14% gain over the past month, Chainlink’s upward momentum appears to be tapering off amid weakening demand.
The recent climb, which began in late April 2025, was largely fueled by investor accumulation and strategic withdrawals from exchanges, suggesting long-term holding behaviour.
According to CryptoQuant data , over the past two weeks, approximately $66 million worth of LINK has been moved out of cryptocurrency exchanges, a move typically interpreted as a bullish signal.

However, this accumulation has yet to overcome the short-term pressure exerted by traders taking profits following the token’s earlier surge above the $15 threshold.
Chainlink price outlook
Chainlink’s current trading range, tightly constrained between $14.84 and $18.00, underscores a period of consolidation that could precede either a breakout or a downturn.
Although the asset recently breached key levels earlier in May, its failure to sustain higher highs has introduced hesitation among bullish investors.
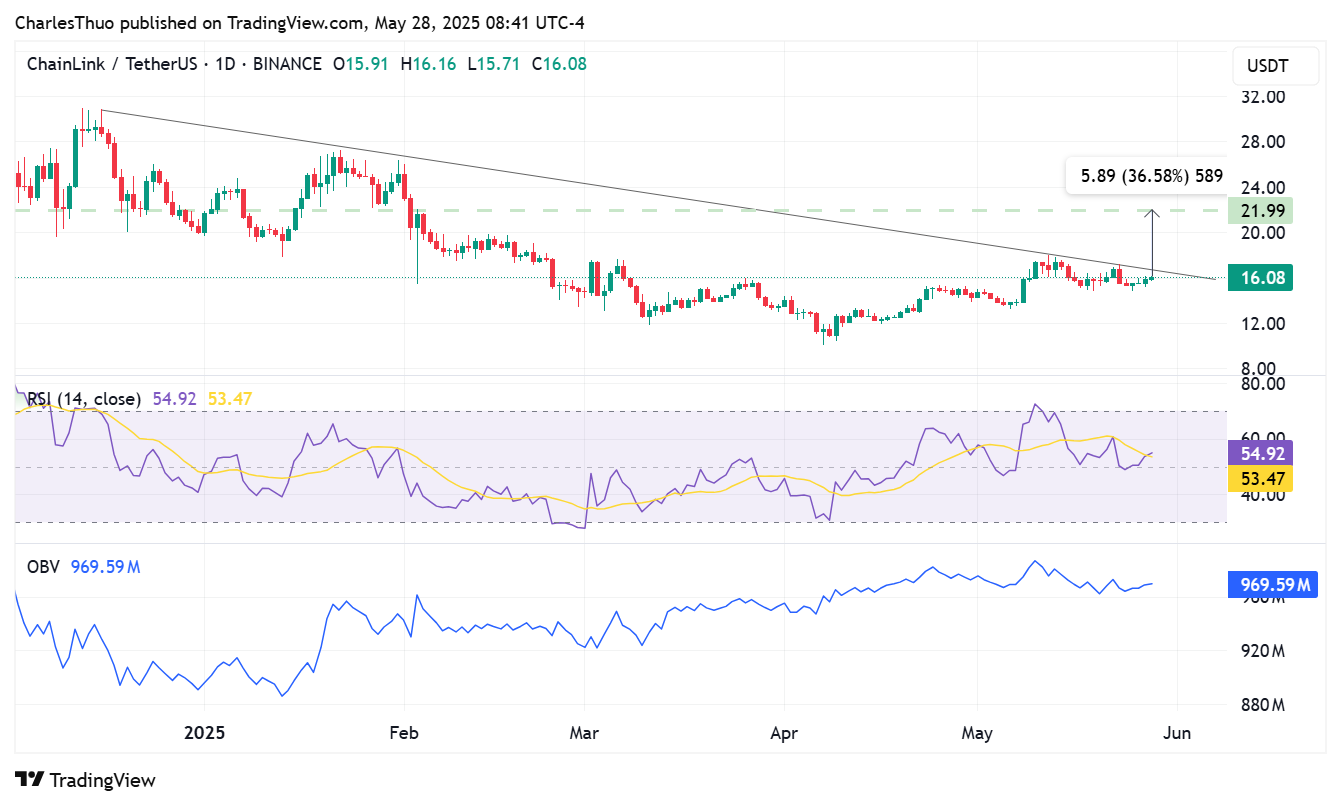
Technically, LINK is encountering a long-standing descending trendline that dates back to December 2024, forming a structural resistance zone now under repeated testing.
This trendline, validated through several contact points across February and May 2025, continues to limit upside potential unless decisively broken.
Market analysts suggest that a confirmed breakout above this descending resistance could initiate a stair-step rally toward resistance levels at 17.28, 18.00, and even 21.99 USDT.
Nonetheless, indicators such as the On-Balance Volume (OBV) and Mean Coin Age paint a more cautious picture, revealing a decline in buying pressure and a tendency for holders to liquidate.
The OBV’s persistent downtrend signifies increased distribution, while Mean Coin Age data implies that long-held tokens are re-entering circulation.
Furthermore, Chainlink’s Stochastic RSI hints at the potential for a short-term rebound, yet without sustained volume and broader market participation, such movements may remain fleeting.
Adding to the complexity, liquidation heatmap data has exposed dense liquidity zones near $14.80, highlighting a possible 7–8% drawdown if bearish pressure intensifies.
The presence of heavy liquidation volumes around local highs of $17.30 also underscores the vulnerability of any unconfirmed breakout attempts.
Although short-term weakness remains evident, Chainlink continues to benefit from its increasing integration within the decentralised finance sector.
Key partnerships, including collaborations with JPMorgan’s Kinexys, Ondo Finance, and deployment on the Solana mainnet, have reinforced LINK’s role as a crucial data bridge in blockchain ecosystems.
The adoption of Chainlink’s Cross-Chain Interoperability Protocol (CCIP) in these networks further strengthens its utility, enabling secure cross-chain data exchange for smart contracts.
These integrations are not only expanding Chainlink’s use cases but also setting the foundation for potential long-term appreciation once market sentiment recovers.
Currently, LINK’s position above the 200-day moving average and within a rising channel pattern supports the broader bullish structure that has yet to fully materialise.
Nevertheless, with the Relative Strength Index (RSI) hovering at 54.92, sentiment remains neutral to slightly bearish, indicating that bulls have not regained firm control.
The BBPower reading of 1.37 reflects a slight advantage for buyers, though it lacks the confirmation required to suggest a sustained rally.
In conclusion, while Chainlink’s long-term outlook remains positive thanks to DeFi growth and increasing utility, the short-term narrative is clouded by on-chain selling and technical resistance.