Will Solana Price Crash to $100?
Solana (SOL) price has had an impressive year, but as of late May 2025, cracks are starting to appear in its momentum. With the price currently hovering around $170, many traders are asking the same question: Is Solana price heading for a massive drop — possibly even to $100? Let's break down what the charts reveal.
Solana Price Prediction: What's Happening on the Daily Chart?
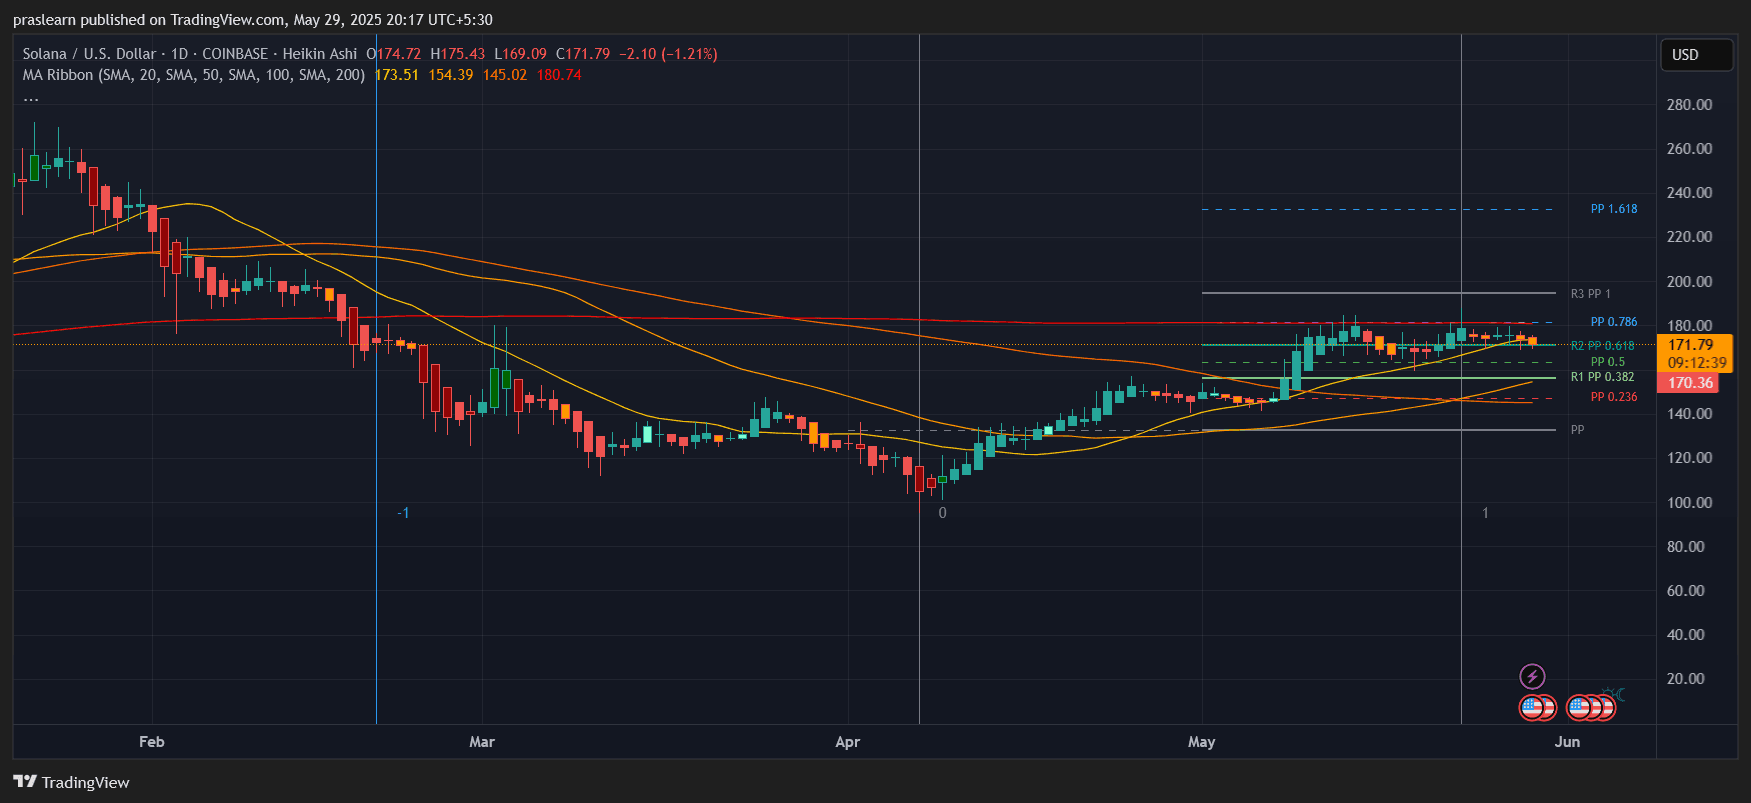 SOL/USD Daily Chart- TradingView
 Solana’s daily chart shows a clear sideways-to-weakening price action following a strong rally earlier in April and May. For the past few weeks, the price has struggled to break above the $180 resistance mark and is now hovering between key Fibonacci retracement levels.
The 0.786 Fibonacci level (near $180) has turned into a stubborn resistance. Price is now slipping below the 20-day and 50-day Simple Moving Averages (SMA), currently at $173.51 and $154.39, respectively. The loss of support from these moving averages indicates a loss of bullish momentum.
If SOL price closes below the 20-day SMA for multiple sessions, we may see the next leg down testing the 100-day SMA at around $145.
Hourly Chart Signals Breakdown Coming
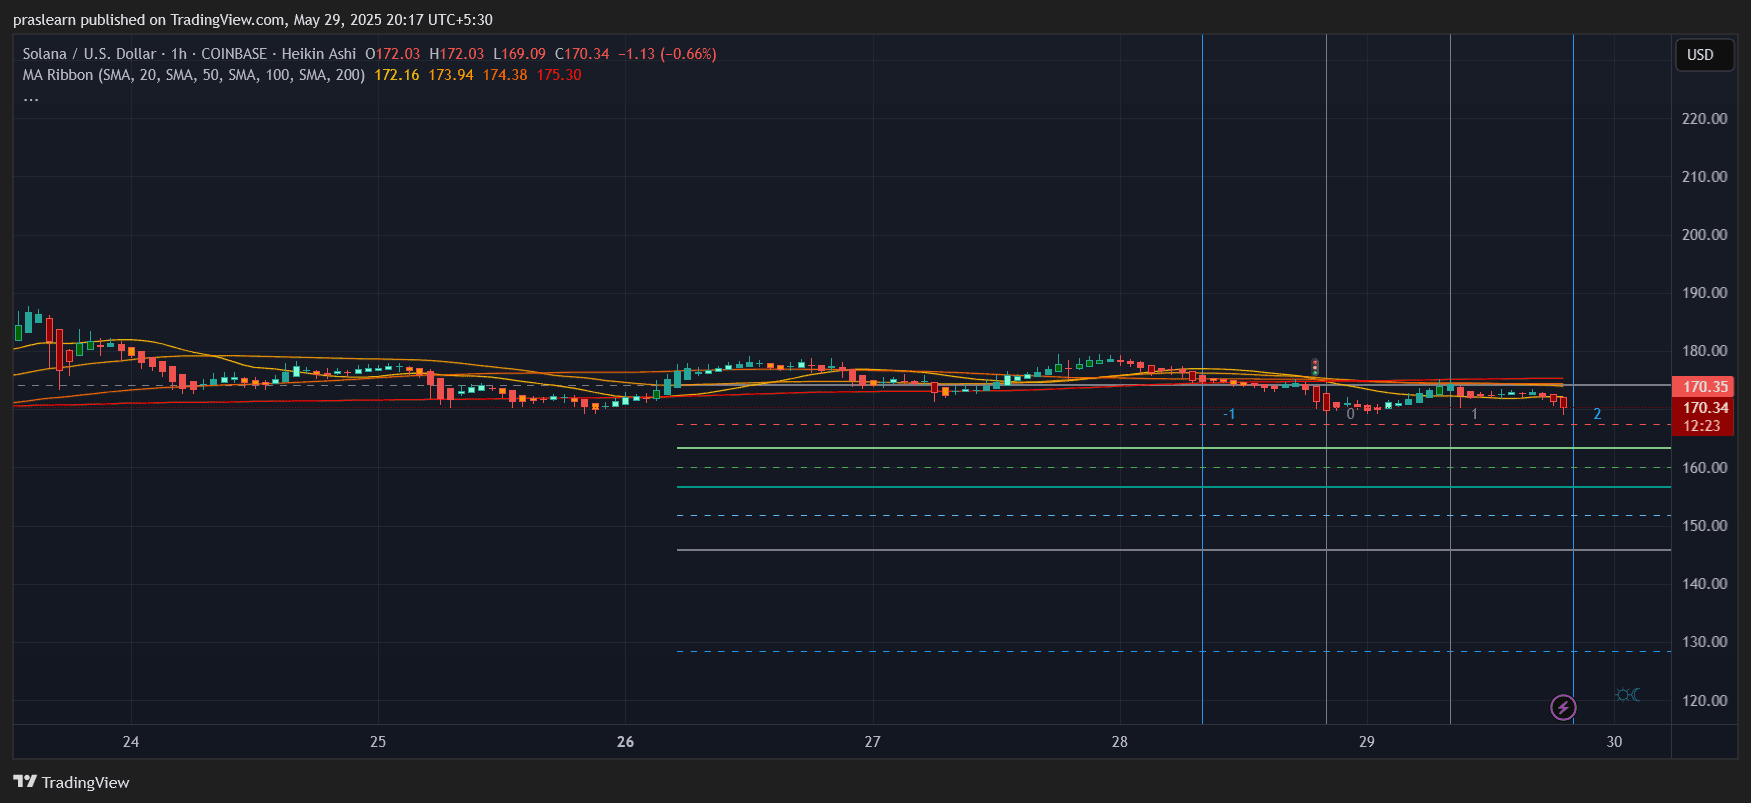 SOL/USD 1 hr Chart- TradingView
 Zooming into the hourly chart, SOL price has broken down from a tight consolidation range around $174–$176. The current price at $170.34 has pierced below the cluster of moving averages (20, 50, 100, and 200 SMA), all of which are closely aligned in the $172–$175 zone. This suggests a short-term trend reversal and potential momentum shift toward the bearish side.
Volume is flat, and there's no visible buying pressure to hold key intraday levels. This opens the gates to test the recent hourly support zones — marked clearly around:
- $165.60
- $162.40
- $159.00
If price breaches $159 with a full-bodied hourly candle, the next major visible support is all the way near $140, a psychological and technical level from the daily chart.
Will Solana Price Crash to $100?
Let’s do the math using Fibonacci projections and moving averages:
If the recent swing high is $188 and the recent swing low is $116 (from earlier in 2025), the 0.618 Fibonacci retracement lands at $146, which is also where the 100-day SMA sits. This is a crucial pivot. If SOL loses that level, the next target using standard Fibonacci extensions could be:
1.0 extension → $188 - (0.618 × [$188 - $116])
= $188 - (0.618 × $72)
= $188 - $44.50
≈ $143.50
Beyond this, a further 1.618 extension puts SOL price in the $100–$105 zone.
That would be a 45%+ drop from current levels — which isn’t far-fetched if broader market sentiment turns risk-off or Bitcoin dips below its own support levels.
What Could Prevent a Solana Price Crash?
Despite the bearish bias, SOL price still has some structural support :
- Daily MA200 at $180.74 hasn’t been decisively broken yet. Bulls could defend this if volume steps in.
- Weekly structure remains above the 0.5 Fibonacci level (~$152).
- Solana’s fundamental momentum — including DeFi growth and NFT resurgence — may offer a cushion to rapid downside moves.
However, without a clear bullish reversal pattern or heavy buy volume, technical pressure remains to the downside.
Solana Price Prediction: Brace for $150 Before Any Comeback
The current SOL price action doesn’t scream collapse, but a drift toward $150 looks increasingly likely. If that level fails, it opens the floodgates to $130 and potentially $100.
Until Solana price reclaims and holds above $180 with strong volume, the path of least resistance is downward.
- Short-term bias: Bearish
Mid-term target: $150
Long-term risk: $100 if $145 breaks
Stay cautious and watch for volume-confirmed reversals before jumping back in.
$SOL, $Solana
Solana (SOL) price has had an impressive year, but as of late May 2025, cracks are starting to appear in its momentum. With the price currently hovering around $170, many traders are asking the same question: Is Solana price heading for a massive drop — possibly even to $100? Let's break down what the charts reveal.
Solana Price Prediction: What's Happening on the Daily Chart?
SOL/USD Daily Chart- TradingView Solana’s daily chart shows a clear sideways-to-weakening price action following a strong rally earlier in April and May. For the past few weeks, the price has struggled to break above the $180 resistance mark and is now hovering between key Fibonacci retracement levels.
The 0.786 Fibonacci level (near $180) has turned into a stubborn resistance. Price is now slipping below the 20-day and 50-day Simple Moving Averages (SMA), currently at $173.51 and $154.39, respectively. The loss of support from these moving averages indicates a loss of bullish momentum.
If SOL price closes below the 20-day SMA for multiple sessions, we may see the next leg down testing the 100-day SMA at around $145.
Hourly Chart Signals Breakdown Coming
SOL/USD 1 hr Chart- TradingView Zooming into the hourly chart, SOL price has broken down from a tight consolidation range around $174–$176. The current price at $170.34 has pierced below the cluster of moving averages (20, 50, 100, and 200 SMA), all of which are closely aligned in the $172–$175 zone. This suggests a short-term trend reversal and potential momentum shift toward the bearish side.
Volume is flat, and there's no visible buying pressure to hold key intraday levels. This opens the gates to test the recent hourly support zones — marked clearly around:
- $165.60
- $162.40
- $159.00
If price breaches $159 with a full-bodied hourly candle, the next major visible support is all the way near $140, a psychological and technical level from the daily chart.
Will Solana Price Crash to $100?
Let’s do the math using Fibonacci projections and moving averages:
If the recent swing high is $188 and the recent swing low is $116 (from earlier in 2025), the 0.618 Fibonacci retracement lands at $146, which is also where the 100-day SMA sits. This is a crucial pivot. If SOL loses that level, the next target using standard Fibonacci extensions could be:
1.0 extension → $188 - (0.618 × [$188 - $116])
= $188 - (0.618 × $72)
= $188 - $44.50
≈ $143.50
Beyond this, a further 1.618 extension puts SOL price in the $100–$105 zone.
That would be a 45%+ drop from current levels — which isn’t far-fetched if broader market sentiment turns risk-off or Bitcoin dips below its own support levels.
What Could Prevent a Solana Price Crash?
Despite the bearish bias, SOL price still has some structural support :
- Daily MA200 at $180.74 hasn’t been decisively broken yet. Bulls could defend this if volume steps in.
- Weekly structure remains above the 0.5 Fibonacci level (~$152).
- Solana’s fundamental momentum — including DeFi growth and NFT resurgence — may offer a cushion to rapid downside moves.
However, without a clear bullish reversal pattern or heavy buy volume, technical pressure remains to the downside.
Solana Price Prediction: Brace for $150 Before Any Comeback
The current SOL price action doesn’t scream collapse, but a drift toward $150 looks increasingly likely. If that level fails, it opens the floodgates to $130 and potentially $100.
Until Solana price reclaims and holds above $180 with strong volume, the path of least resistance is downward.
- Short-term bias: Bearish
Mid-term target: $150
Long-term risk: $100 if $145 breaks
Stay cautious and watch for volume-confirmed reversals before jumping back in.
$SOL, $Solana