After a steep correction through late May, Pi Network price today is attempting a mild recovery, trading around $0.6811 with slight intraday gains. The asset has rebounded modestly from sub-$0.6650 levels but continues to face downward pressure from trendline resistances and declining momentum indicators. The broader market sentiment remains fragile, which has added to the ongoing Pi Network price volatility and hesitation among bulls.
What’s Happening With Pi Network’s Price?
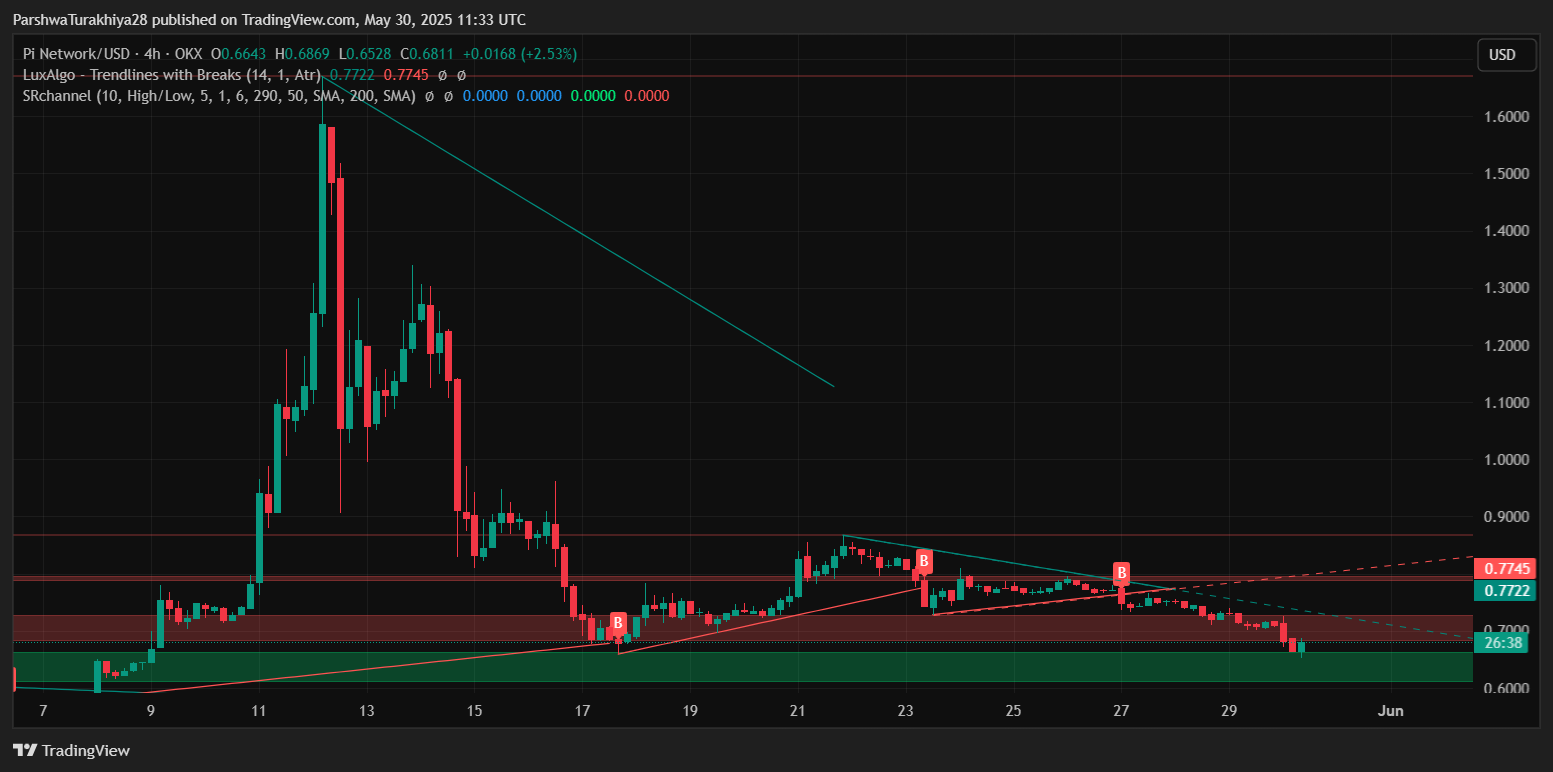
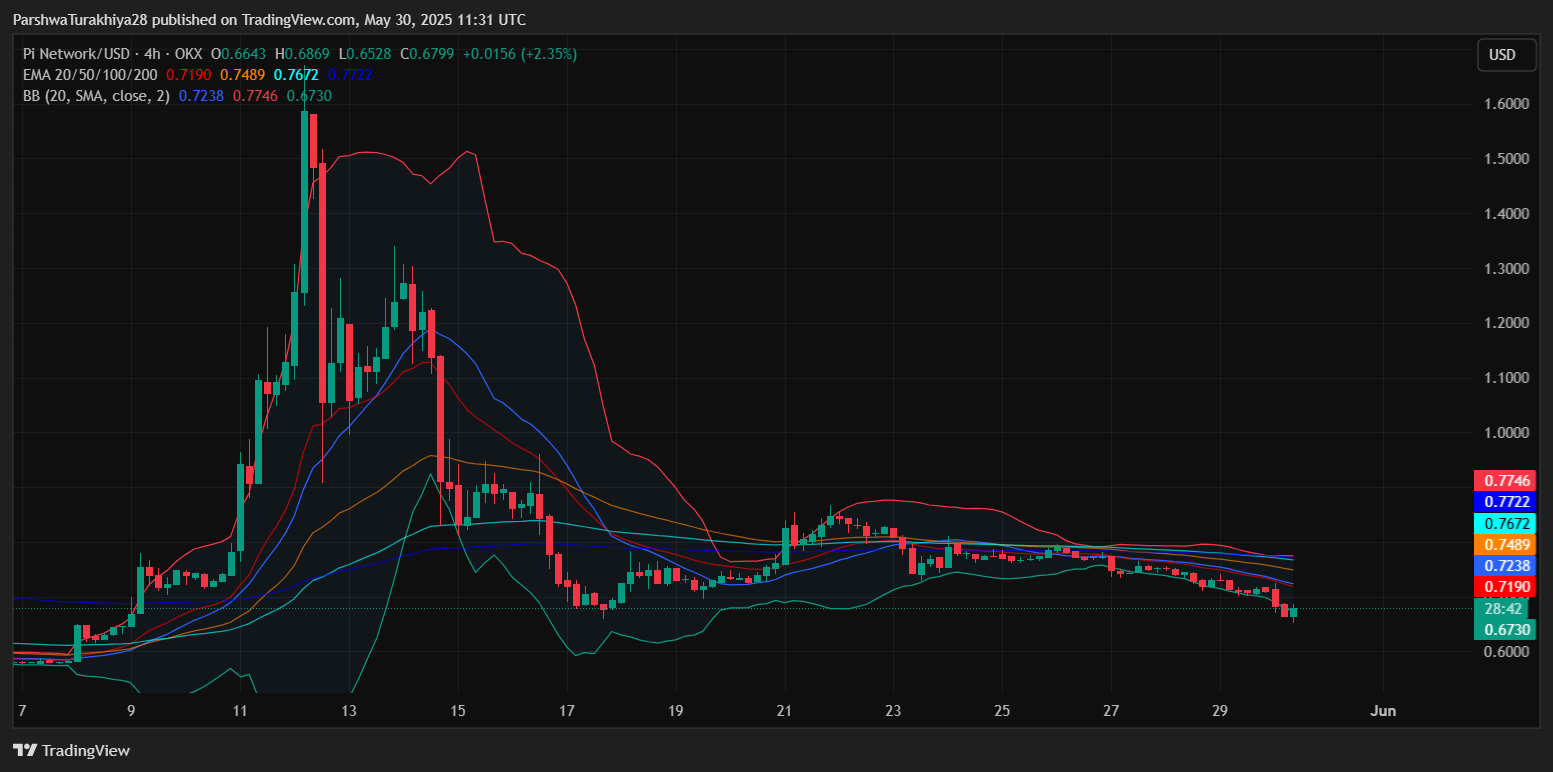 Pi Network price dynamics (Source: TradingView)
 The latest Pi Network price action highlights a failed attempt to reclaim the $0.72 zone, which had previously served as support but now acts as a resistance band. The Bollinger Bands on the 4-hour chart show clear expansion to the downside, confirming increased volatility during the recent drop. At the same time, price remains pinned below the 20, 50, and 100 EMAs—all of which are aligned in a bearish slope.
The most immediate concern is the continued rejection from the descending channel visible on both the 30-minute and 4-hour charts. This channel has defined the price structure since late May, and until a breakout occurs, upside will likely remain capped.
Momentum Indicators Show Mixed Signals
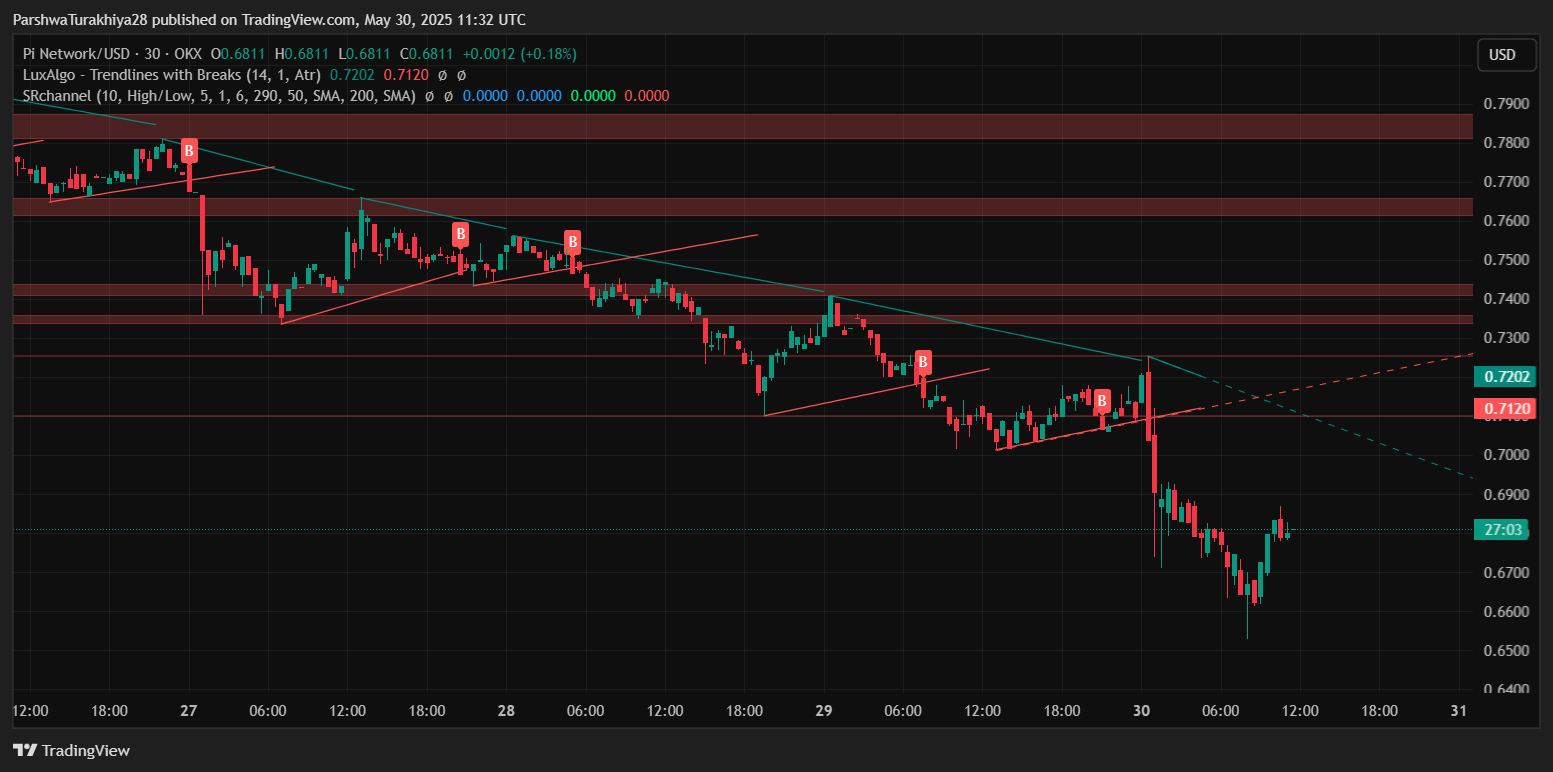
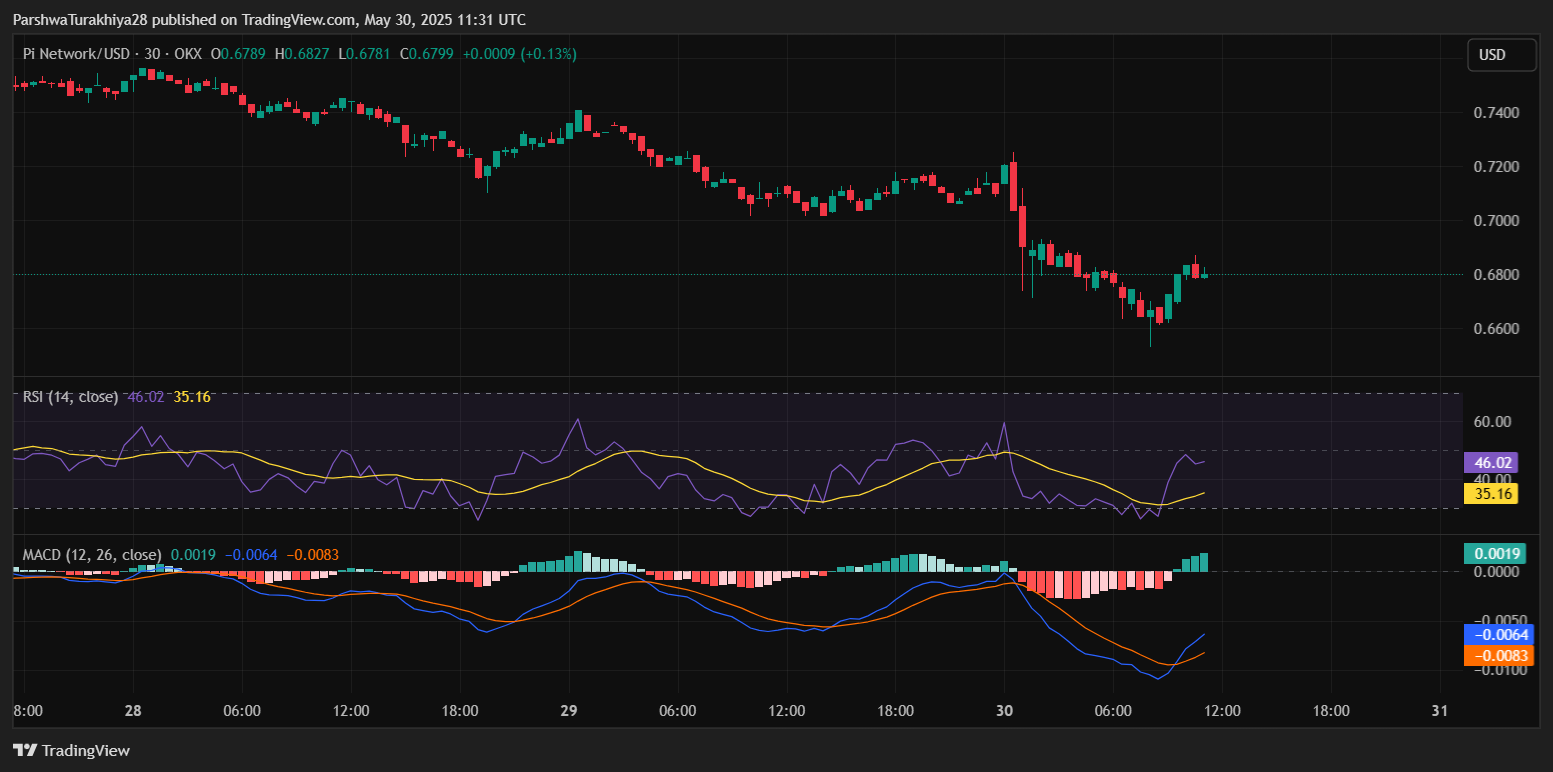 Pi Network price dynamics (Source: TradingView)
 The RSI on the 30-minute chart has bounced from oversold conditions and now hovers around 46.02. This shows that the asset has recovered short-term strength but still lacks sufficient bullish momentum to force a reversal. Meanwhile, MACD is showing a recent bullish crossover, with the histogram flipping green for the first time in several sessions. This adds a note of optimism to the short-term outlook, though confirmation through volume remains absent.
 Pi Network price dynamics (Source: TradingView)
 On the Stochastic RSI front, we see that the oscillator has sharply reversed from oversold territory and is now nearing overbought conditions on the 30-minute chart. This reflects a rapid short-term bounce but raises the risk of a near-term pullback or consolidation.
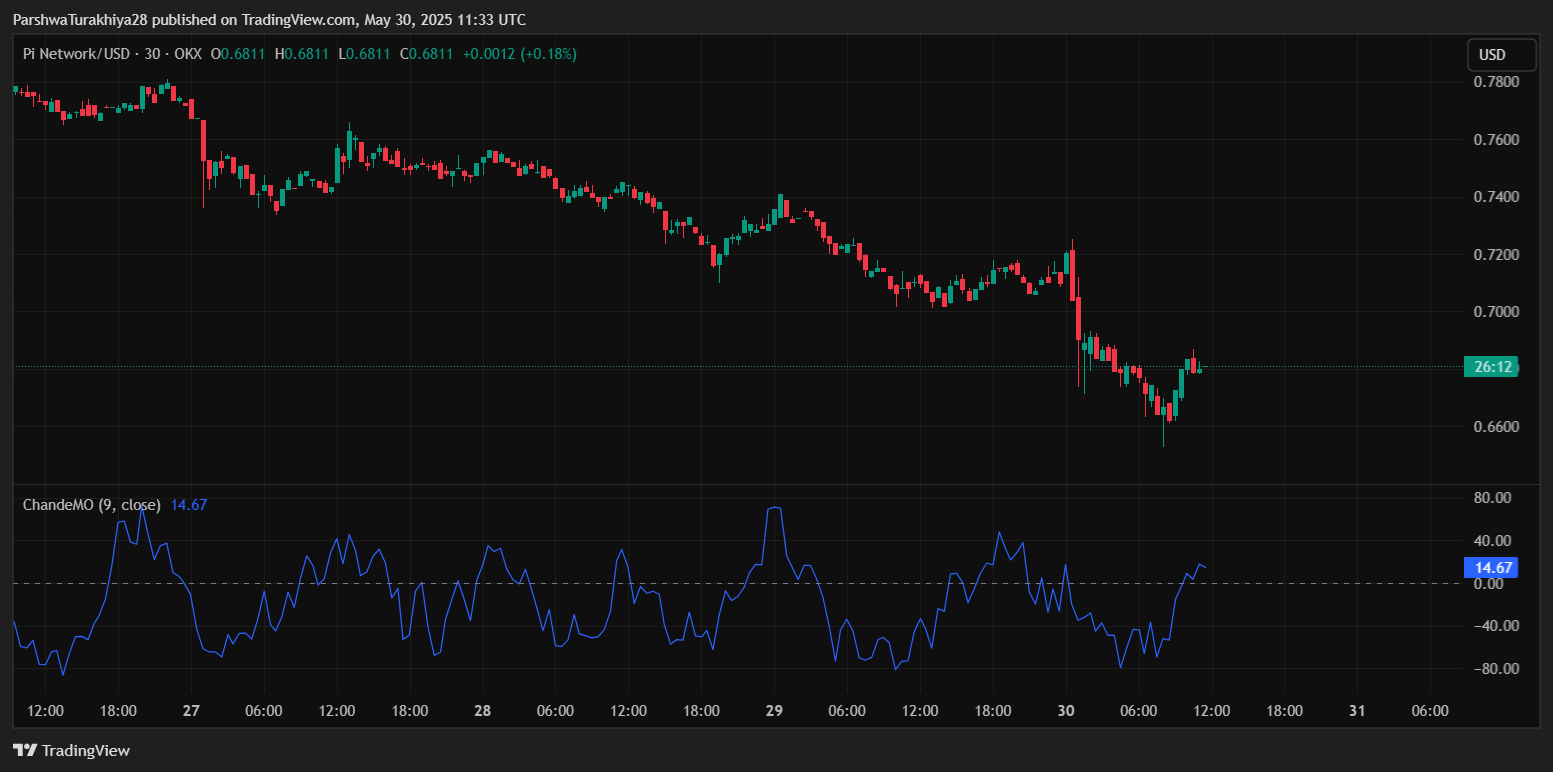 Pi Network price dynamics (Source: TradingView)
 The Chande Momentum Oscillator (ChandeMO) has also moved back above the zero line after printing multiple lows around -40, a signal that bears are losing grip but bulls are not yet in control.
Ichimoku and Trendline Analysis Point to Resistance Near $0.72
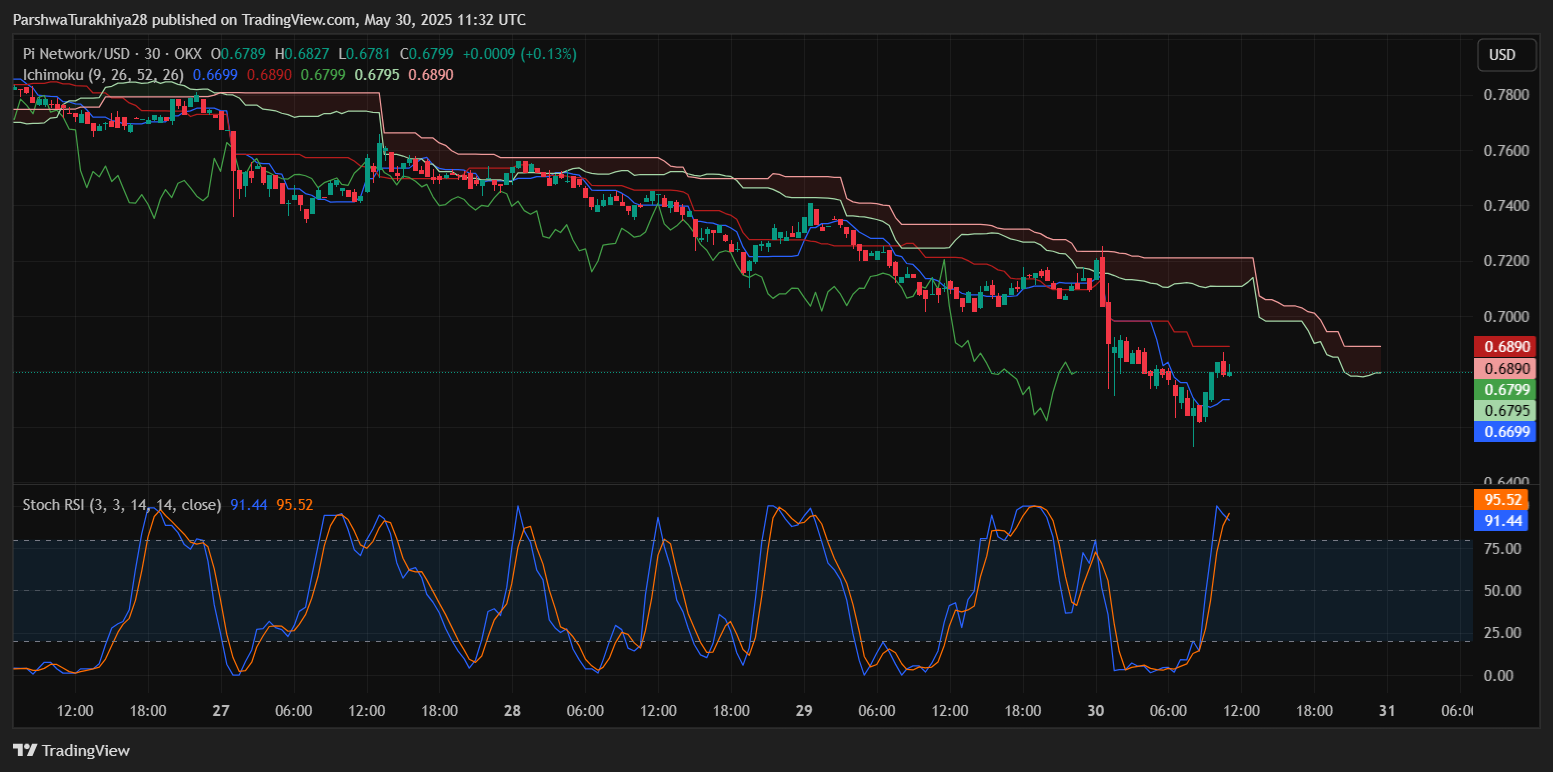 Pi Network price dynamics (Source: TradingView)
 From an Ichimoku Cloud perspective, Pi Network price remains under the Kumo on lower timeframes. The 30-minute chart shows price attempting to breach the Tenkan and Kijun lines around $0.6795 and $0.6890, but with Senkou Span A and B still declining, the broader trend remains bearish.
One of the most critical zones to monitor is the confluence of resistance between $0.7120 and $0.7202. This range houses both the descending trendline from earlier swing highs and the upper boundary of the red resistance bands from recent price compression. If bulls can push through this cluster, it would invalidate the current bearish trajectory and open the door for a revisit of the $0.74–$0.77 region.
Key Support and Projection Zones to Watch
 Pi Network price dynamics (Source: TradingView)
 The immediate support lies in the $0.6620–$0.6730 zone, which has acted as a bounce region across multiple 4-hour candles. Below that, a deeper slide could bring the asset to the $0.64 handle, where historical consolidation zones from earlier in May could offer a temporary floor.
For bullish continuation, the most realistic short-term projection would require reclaiming $0.7200 on a daily closing basis. That would pave the way toward the psychological $0.75 mark, followed by a potential retest of the 200 EMA near $0.7745.
Why Pi Network Price Going Down Today?
 Pi Network price dynamics (Source: TradingView)
 The broader decline in Pi Network price today is largely driven by a combination of weak macro sentiment and deteriorating internal momentum. Despite the temporary recovery, the asset remains in a defined downtrend on the 4-hour chart. EMAs continue to weigh heavily above the current price action, while failed breakouts and lower highs have reinforced bearish dominance.
Until clear structural breakouts occur with volume support, Pi Network price update favors short-lived rallies and deeper consolidation phases, especially heading into early June.
Final Outlook and Technical Forecast
The technical structure remains tilted to the downside unless bulls manage to invalidate resistance at $0.7200 with sustained buying interest. Indicators like MACD and ChandeMO suggest a short-term recovery may continue into early June, but stronger confirmation is needed for any medium-term trend reversal.
| Indicator/Zone | Level/Range | Bias |
| Resistance Zone | $0.7200–$0.7745 | Strong resistance |
| Current Price | $0.6811 | Mild recovery zone |
| Support Zone | $0.6620–$0.6730 | Key demand area |
| RSI (30-min) | 46.02 | Neutral-bullish |
| MACD (30-min) | Bullish crossover | Early bullish sign |
| Ichimoku (30-min) | Below cloud | Bearish trend |
| Trend Bias | Bearish unless breakout above $0.72 |
The coming week will be critical. A failure to break above $0.72 may result in another retest of $0.66, while a breakout and daily close above that level could flip the bias and attract speculative inflows once again.
Disclaimer: The information presented in this article is for informational and educational purposes only. The article does not constitute financial advice or advice of any kind. Coin Edition is not responsible for any losses incurred as a result of the utilization of content, products, or services mentioned. Readers are advised to exercise caution before taking any action related to the company.