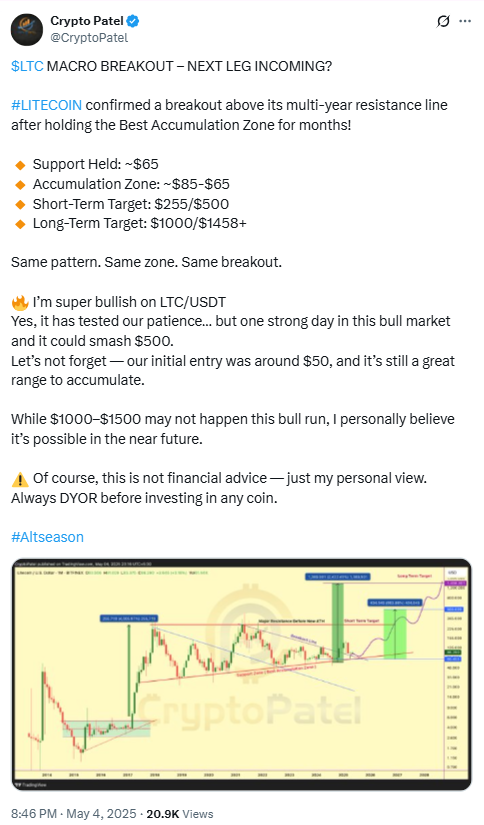
Solana price prediction 2025-2031: Trends and insights for investors
Key takeaways
- Solana’s price can reach a maximum of $238.90 and an average trading value of $215.52 in 2025.
- By 2028, SOL is expected to reach a new high of $492.29, driven by mainstream adoption of its dApps.
- Solana’s price could surpass the $1,000 mark, potentially reaching $1,093.25 or higher by 2031.
Despite occasional challenges for Solana ecosystem, including network congestion and competition from other blockchain platforms, the current sentiment shows that Solana demonstrates resilience and adaptability, despite the current price fluctuations, positioning itself as a leading player in the decentralized finance (DeFi) and Web3 landscape.
Overall, the prevailing sentiment within the Solana community reflects the current sentiment of confidence and excitement among investors , driven by the growing interest in Solana with stakeholders eagerly anticipating the platform’s continued evolution and impact on the broader crypto ecosystem.
While uncertainties persist, Solana’s innovative approach and robust infrastructure instill optimism for its future price trajectory, as indicated by the technical analysis, solana price forecast and market dominance, particularly when evaluated against momentum indicators. How high can SOL go in 2025 and beyond?
Overview
| Cryptocurrency | Solana |
| Token | SOL |
| Price | $177 (+3.06%) |
| Market Cap | $92.21 Billion |
| Trading Volume 24-hour | $3.05 Billion |
| Circulating Supply | 520.28 Million SOL |
| All-time High | $294.33 Jan 19, 2025 |
| All-time Low | $0.5052, May 11, 2020 |
| 24-hour High | $178 |
| 24-hour Low | $169 |
Solana price prediction: Technical analysis
| Sentiment | Bullish |
| 50-Day SMA | $151.33 |
| 200-Day SMA | $166.82 |
| Price Prediction | $209.34 (+17.39%) |
| Fear & Greed Index | 73 (Greed) |
| Green Days | 16/30 (50%) |
| 14-Day RSI | 58.54 |
Solana price analysis: SOL faces bearish pressure below $180
TL;DR Breakdown:
- Solana price analysis shows a bullish trend below $160.
- Resistance for SOL is at $160.
- Support for SOL/USD is at $155.
The price analysis of Solana for May 31 shows that SOL tried and failed at crossing past the $184 level. The price is still trading at $156 but may retrace further.
Solana price analysis 1-day chart: SOL fails to cross past $180
Solana showed significant bearish pressure on the daily chart, as the bulls could not climb past the $180 level, and the price headed towards $150. The bulls still hold strong at the level but the exhaustion might cause SOL to retrace further.
The Relative Strength Index (RSI) stands at 41.72, showing little room for further upwards movement across the daily charts. The Moving Average Convergence Divergence (MACD) line dives downwards, suggesting declining bullish momentum. Moreover, the MACD histogram shows rising bearish pressure in the cryptocurrency market as bulls struggle to hold above $155.00.
SOL/USD 4-hour price chart: Bearish momentum halts SOL at $184
The 4-hour chart for Solana reveals a steady fall as the bulls failed to rise past the $185 price level, and SOL fell to the $155.00 mark before recovering towards the $156 level. The high trading volume has caused high volatility in the last few days.
From a technical perspective, the MACD shows growing bearish momentum at -0.82, with the indicator showing rising bearish momentum with recent candles. This suggests that the bulls are yet to find a foothold at the level. The RSI (Relative Strength Index) is at 33.26, indicating that Solana has room for further movement in downwards direction across the short term and the selloff may continue towards $166.
Solana technical indicators: Levels and action
Daily simple moving average (SMA)
| SMA 3 | $ 147.93 | BUY |
| SMA 5 | $ 162.34 | SELL |
| SMA 10 | $ 170.87 | SELL |
| SMA 21 | $ 171.56 | SELL |
| SMA 50 | $ 157.44 | SELL |
| SMA 100 | $ 146.00 | BUY |
| SMA 200 | $ 166.02 | SELL |
Daily exponential moving average (EMA)
| EMA 3 | $ 164.74 | SELL |
| EMA 5 | $ 156.28 | BUY |
| EMA 10 | $ 144.00 | BUY |
| EMA 21 | $ 136.73 | BUY |
| EMA 50 | $ 143.54 | BUY |
| EMA 100 | $ 159.63 | SELL |
| EMA 200 | $ 168.20 | SELL |
What to expect from Solana price analysis?

The Solana price analysis across the daily and 4-hour charts indicates a notable decay after rising towards the $184 price level. The 4-hour chart reinforces this downward trend with a bearish dominance in the MACD and the RSI falling into unfavorable territory, signaling potential continued downward momentum as SOL retraces to $150.
The bulls find strong support at $155 suggesting the price may bounce back. The bullish market sentiment supports the notion and the increasing trade volume is also bullish. However, if the price falls below $155, the next support is at $148.
Is SOL a good investment?
Solana is a high-performance blockchain platform known for its scalability and speed, boasting a substantial Total Value Locked (TVL). The network continues to hit key development milestones. Despite a challenging month, price predictions indicate a more optimistic outlook, suggesting Solana prediction the potential for future growth.
Why is SOL down?
Solana failed to rise past the $184 price level, and the following selloff caused a drop to $150 before recovering towards the $157 level. However, the increasing bearish pressure might create a drop below $155.
What is Solana going to be worth in 2025?
The Solana (SOL) price prediction for 2025 suggests a minimum value of $97.47 with an average price of $215.52. The price could reach a maximum of $238.90 during the year.
Will SOL reach $1,000?
The price forecasts indicate that SOL could reach a minimum of $1,139 by 2030. Given the bullish scenario and the projected positive market sentiment and growth trend, SOL might reach $1,000 within the next five years.
Can Solana reach $5,000?
Reaching $5,000 is plausible but would likely take several years beyond the current forecast period. However, a snowball in the asset’s adoption might bring the moment sooner.
Does SOL have a good long-term future?
Yes, Solana has a good long-term future, with a promising market capitalization and exciting potential roi due to its high scalability, low transaction costs, robust ecosystem, and increasing institutional interest. Its growing adoption, strong developer community, and strategic partnerships further enhance Solana’s forecast of its potential for sustained growth.
Recent news/updates on Solana
- Solana has announced the support for WBTC, which is backed by 1:1 by Bitcoin custodied. This is custodied by Bitgo exchange.
Bitcoin 🤝 Solana
— Solana (@solana) May 5, 2025
WBTC, the most widely issued wrapped Bitcoin, is now natively available on Solana. https://t.co/89csX4wVXB
Solana price prediction May 2025
The sol price prediction for May 2025 suggests a range of outcomes based on current market trends and analysis. The forecast anticipates SOL fluctuating between a minimum of $122.00 and an average of $146.24, and potentially reaching a maximum of $261.28.
| Month | Minimum Price ($) | Average Price ($) | Maximum Price ($) |
| May | 122.00 | 146.24 | 261.28 |
Solana price predictions 2025
The Solana (SOL) price prediction for 2025 suggests a minimum value of $97.47 with an average price of $215.52. The price could reach a maximum of $238.90 during the year.
| Year | Minimum Price ($) | Average Price ($) | Maximum Price ($) |
| 2025 | 97.47 | 215.52 | 238.90 |
Solana (SOL) price prediction 2026-2031
| Year | Minimum Price ($) | Average Price ($) | Maximum Price ($) |
| 2026 | 233.41 | 262.93 | 274.17 |
| 2027 | 319.79 | 382.43 | 390.71 |
| 2028 | 418.09 | 471.33 | 492.29 |
| 2029 | 418.09 | 471.33 | 492.29 |
| 2030 | 515.46 | 582.88 | 595.53 |
| 2031 | 731.62 | 779.77 | 811.85 |
Solana price prediction 2026
Solana sol price is predicted to reach a minimum of $314.31 in 2026. Experts suggest that the coin could reach a maximum value of $369.21 and an average price of $354.07.
Solana price prediction 2027
In 2027, the price of Solana is forecasted to be around a minimum value of $430.63. Solana’s price can reach a maximum of $526.14, and the average trading value is $514.99.
Solana price prediction 2028
If the bullish run from previous years continues into 2028, SOL can reach a minimum price of $563.01, a maximum price of around $662.93, and an expected average trading price of $634.70.
Solana price prediction 2029
An analysis of SOL’s historical performance shows that the coin could attain new highs in 2029, reaching a maximum price of $662.93, a minimum of $563.01, and an average trading price of $634.70.
Solana price prediction 2030
Based on the Solana price prediction for 2030 and the support levels , investors can expect a maximum price of $801.96 and a minimum SOL price of $694.14. On average, the SOL coin could trade at $784.93.
Solana price prediction 2031
Solana’s price is projected to reach a minimum of $985.22 in 2031. Expert findings suggest that it could reach a maximum of $1,093.25 and an average forecast price of $1,050.05.

Solana market price prediction: Analysts’ SOL price forecast
| Firm Name | 2025 | 2026 |
| Changelly | $157.71 | $244.91 |
| DigitalCoinPrice | $339.32 | $389.42 |
Cryptopolitan’s Solana (SOL) price prediction
Our predictions show that SOL will achieve a high of $321.71 in 2025. In 2028, it will range between $563.01 and $662.93, with an average of $634.70. In 2031, it will range between $985.22 and $1,093.25, with an average of $1,050.05. Note that these predictions are not investment advice, and it is crucial to consider investing strategies and conduct your own research before making any decisions. Seek independent professional consultation or do your research.
Solana (SOL) historic price sentiment
Solana Price History Source: Coinmarketcap
- Solana was launched in April 2020 and has gained popularity over the last 18 months. Its price surged from $0.75 to a high of $214.96 in early September.
- Following NFT hype and growing demand in the DeFi community, the cryptocurrency Solana (SOL) price more than tripled during the summer of 2021. Solana (SOL) token became the fastest-growing cryptocurrency and is currently ranked fifth with a live market cap of nearly $66 billion.
- 2022 saw Solana leap to its all-time high of $260, but SOL failed to close the year anywhere near that high, as the price came crashing down to below $40 by June. The bearish markets were marked by high skepticism as trading volumes declined throughout the crypto markets.
- The price continued to trade below the $40 level until November 2023, when Solana gained momentum and started a bullish rally again to close the year at $101.84.
- In 2024, Solana (SOL) saw significant growth, with its price rising from $83.62 in January to a high of $202.87, fueled by its dominance in DeFi, NFTs, and decentralized exchanges. However, the price fluctuated through the year, retracing to $131 in September after struggling to maintain key levels.
- October brought a positive rebound as SOL rose from $152 to close at $167, but early November started bearish, with the price dipping to $160.
- However, Solana bounced back sharply and closed the month above the $230 mark. December, on the other hand, has observed a slow start as price volatility remains low.
- Solana’s (SOL) price rose significantly in January 2025 from below the $190 level to close the month above $210. However, the latter half of the month saw the price decline from the $230 mark, a trend that continued through February ending the month below $150.
- In March the price continued falling as the bears continued dominating the short to mid term markets ending the month below $125. In April the bearish rally has only continued as the price falls towards $100. However, the bulls bounced back in the middle of the month and ended the month around $150.