Date: Tue, June 03, 2025 | 09:58 AM GMT
The cryptocurrency market has staged a rebound from the mini pullback experienced last week, with Ethereum (ETH) leading the charge—climbing over 5% today and reclaiming the $2600 mark after dipping to a low of $2471 on Sunday.
Following ETH’s lead, altcoins are showing renewed strength. Kaspa (KAS) has jumped over 6%, trimming recent weekly losses 15%. But the charts suggest this could just be the beginning of another leg up.
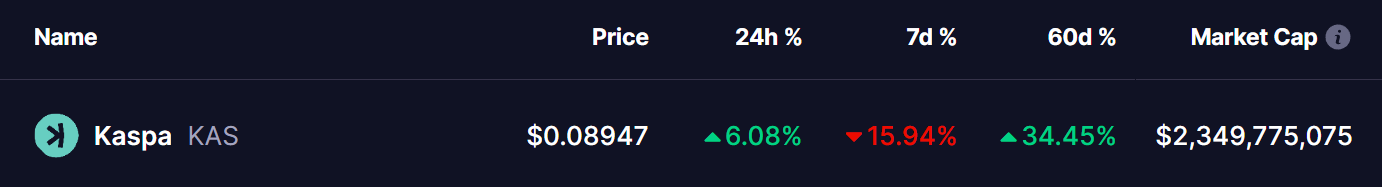 Source: Coinmarketcap
 Multiple Patterns Hinting at Upside Move
Zooming in on the 4-hour chart, KAS is showing signs of two powerful bullish formations: a broadening wedge and a bullish butterfly harmonic pattern.
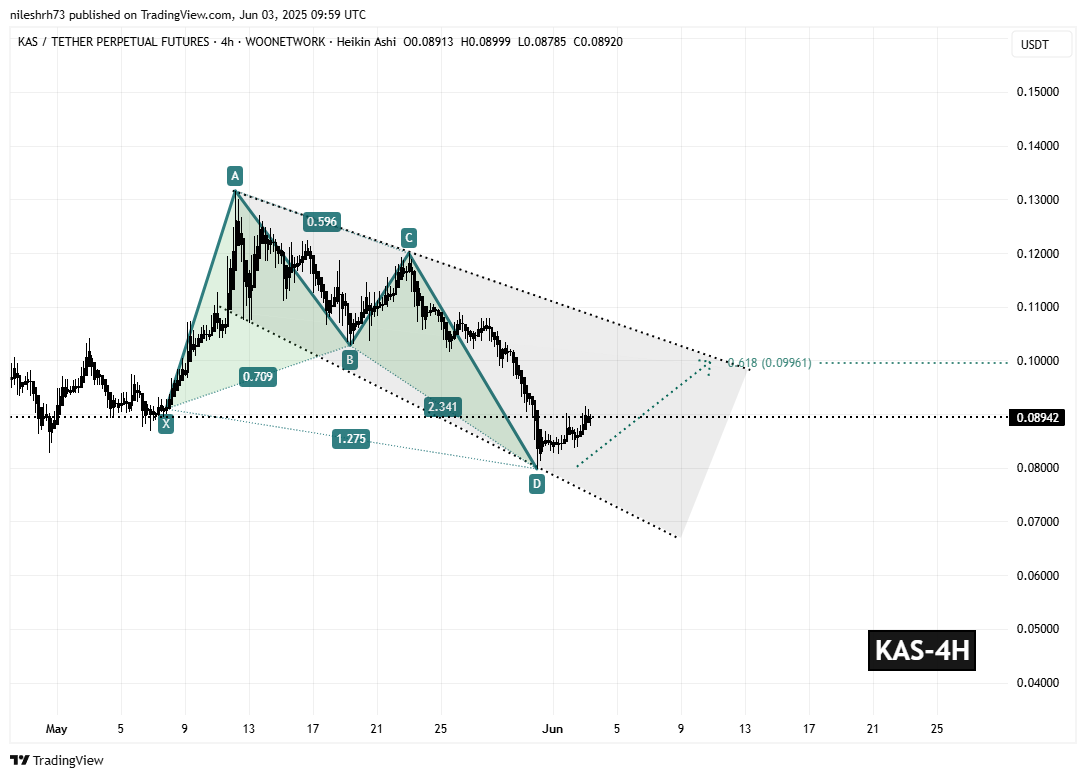 Kaspa (KAS) 4H Chart/Coinsprobe (Source: Tradingview)
 The bullish butterfly pattern appears well-structured, with the recent bounce from point D at $0.07980 acting as a key reversal signal. This bounce has led to the formation of the final CD leg, which is now targeting the $0.09961 level. That’s still more than 11% upside from the current price of $0.08942.
Importantly, this $0.09961 level aligns closely with the 0.618 Fibonacci extension of the DA leg—commonly considered the ideal reversal zone in harmonic patterns. On top of that, this level is brushing up against the upper resistance line of the broadening wedge, adding confluence to the idea that a breakout might be on the horizon.
What’s Next for KAS?
If KAS can maintain momentum and push through the $0.0996 region, it could spark a breakout rally, potentially drawing in technical traders and fresh buyers. A clean breakout from the wedge pattern could set the stage for a larger trend continuation toward the $0.12–$0.13 zone.
Disclaimer: This article is for informational purposes only and not financial advice. Always conduct your own research before investing in cryptocurrencies.