- Altcoin market cap is testing a multi-year resistance zone, signaling a potential breakout.
- RSI momentum is building, resembling patterns seen before previous altseasons.
- Bollinger Band expansion hints at incoming volatility across non-BTC and ETH assets.
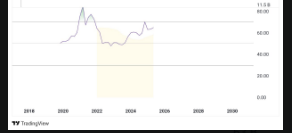
A renewed sense of momentum appears to be building in the altcoin sector, according to recent market data. The chart tracking the total market capitalization of cryptocurrencies excluding Bitcoin and Ethereum indicates that altcoins may be on the verge of a significant upward move. As capital rotation begins to show early signs of re-entry into mid- and small-cap assets, analysts suggest that a broader altcoin season could be taking shape.
Altcoin Market Approaches Key Technical Resistance
The two-month chart shows altcoin market capitalization pressing against a long-standing horizontal resistance zone. After forming higher lows since mid-2022, the price action has compressed into a symmetrical ascending triangle. The technical setup points to a potential breakout, with momentum indicators and historical price structures aligning with previous altseason patterns.
An upward breakout above this consolidation range could target the $1.3 to $1.5 trillion level—based on the height of the pattern’s base. If this move materializes, it would mark a decisive shift in investor sentiment toward altcoins, with capital inflows potentially accelerating across various Layer 1 , DeFi, and niche ecosystem tokens.
Rising Momentum Reflected in RSI Behavior
In addition to price structure, the Relative Strength Index (RSI) on the same timeframe reveals bullish behavior. The RSI has been gradually climbing out of a mid-cycle range and recently printed a higher low within the 50–70 band. This suggests underlying buying pressure is building, even as prices remain just below key resistance.
Interestingly, a similar RSI behavior was observed in early 2021—shortly before the altcoin market experienced a multi-month surge. While past performance does not guarantee future results, historical RSI patterns are commonly used as supporting signals in technical analysis.
Market Structure Echoes Previous Altseason Phases
The current consolidation resembles accumulation phases seen prior to previous altseason rallies. From a macro perspective, the market cap chart appears to be forming a large continuation pattern that originated after the major correction of 2021–2022. The repeated testing of resistance—without major breakdowns—further reinforces the notion that seller exhaustion may be taking place.
 Source: (X)
 Moreover, the upper Bollinger Band on the two-month timeframe is beginning to widen, often interpreted as a sign of incoming volatility. If this volatility resolves to the upside, it could signal the beginning of a new leg higher for the broader altcoin market.
Early Positioning Could Dictate Market Winners
Analysts caution that while the signs are aligning, confirmation of a breakout remains necessary. Until the resistance level is decisively breached with sustained volume, the market remains in a wait-and-see phase. However, should the breakout occur, traders who position early may benefit from first-mover advantage in high-performing altcoins.
In conclusion, technical indicators suggest that an altcoin breakout may be approaching. While the market remains within a defined range, the combination of rising momentum, structural consolidation, and historical precedents points toward a possible resurgence in altcoin valuations.