After a period of prolonged consolidation, the Kaia price today has exploded upward, registering a massive breakout above $0.12 to currently trade around $0.163. This dramatic move comes on the back of a bullish structure shift seen across both intraday and daily charts, sending the asset to levels not seen since March. The key question now is whether this rally can extend further or if short-term exhaustion will trigger a pullback.
What’s Happening With Kaia’s Price?
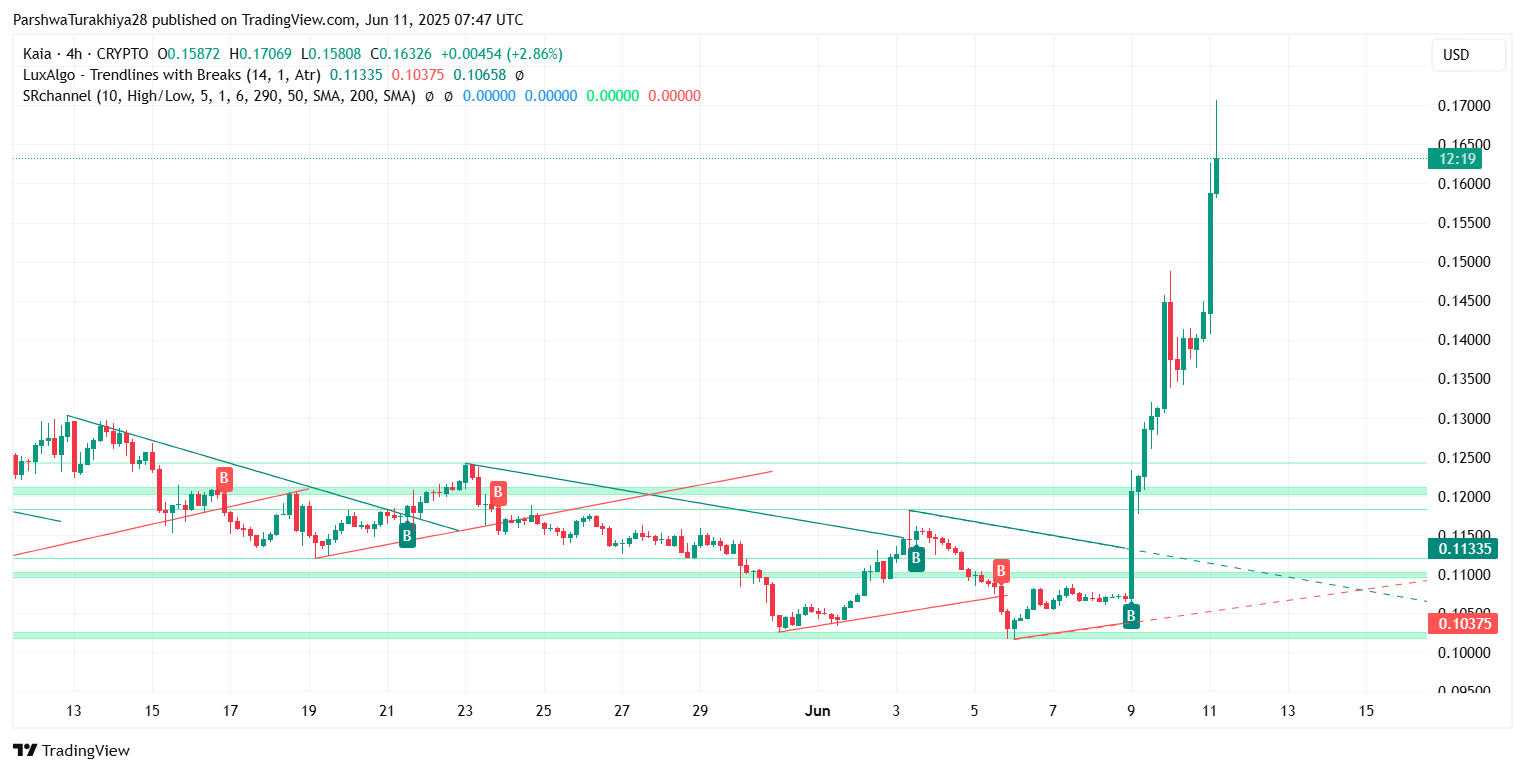 KAIA price dynamics (Source: TradingView)
 Kaia has staged a clean breakout from a multi-month accumulation range, lifting off from the $0.10–$0.12 zone with vertical strength. On the 4-hour chart, the asset broke above multiple descending trendlines and supply blocks, propelling the Kaia price action to an intraday high of $0.1706.
 KAIA price dynamics (Source: TradingView)
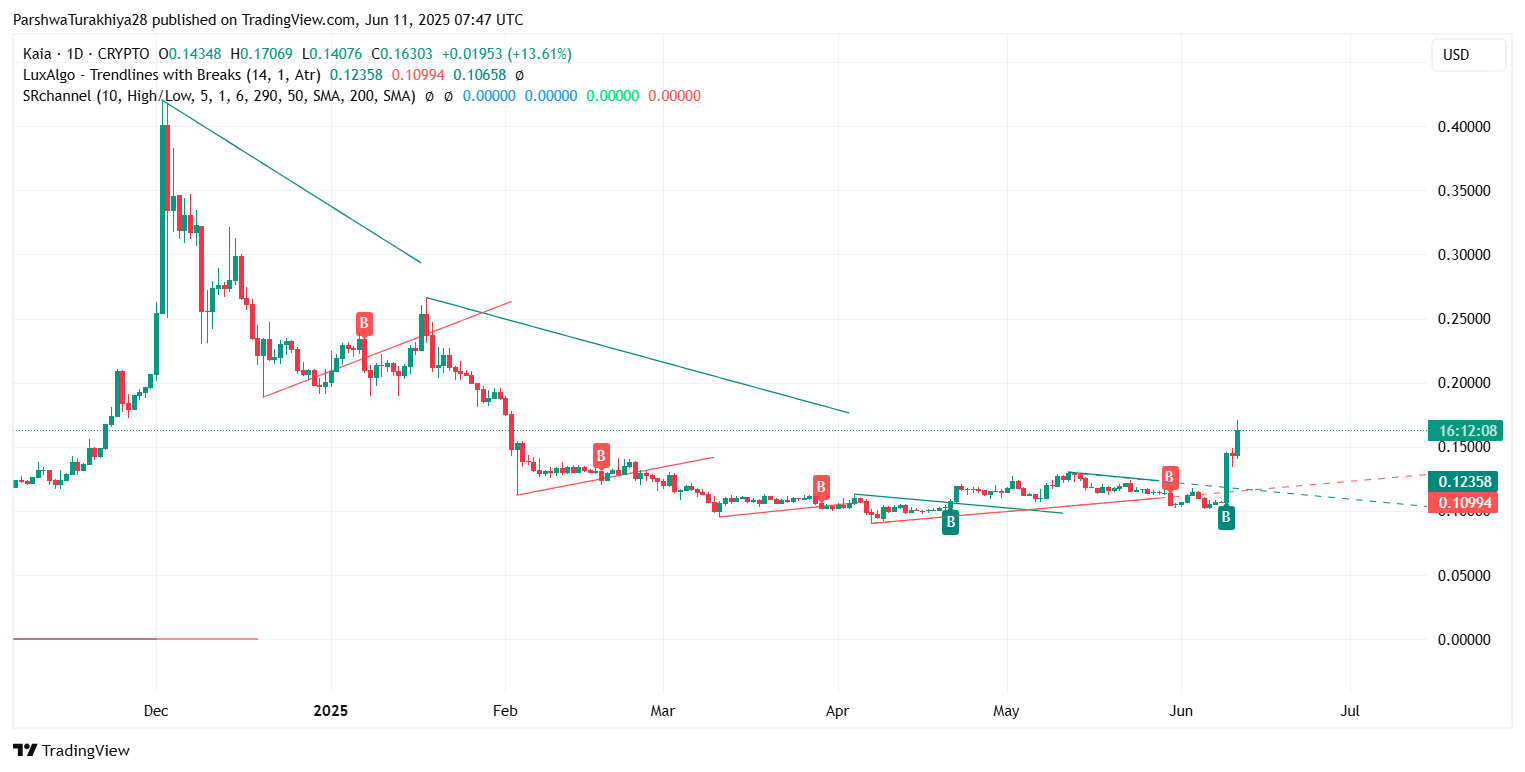
 The daily chart shows a significant breakout from a downtrend structure that began in late 2024. With the breakout candle closing far above the prior resistance near $0.123, Kaia has now flipped this level into confirmed support. The next major supply zone lies near $0.19, followed by $0.23 if momentum continues.
This upward movement marks one of the strongest Kaia price spikes this quarter, fueled by both technical pattern resolution and rising trading volumes.
Momentum Indicators Signal Strength But Warn of Overextension
 KAIA price dynamics (Source: TradingView)
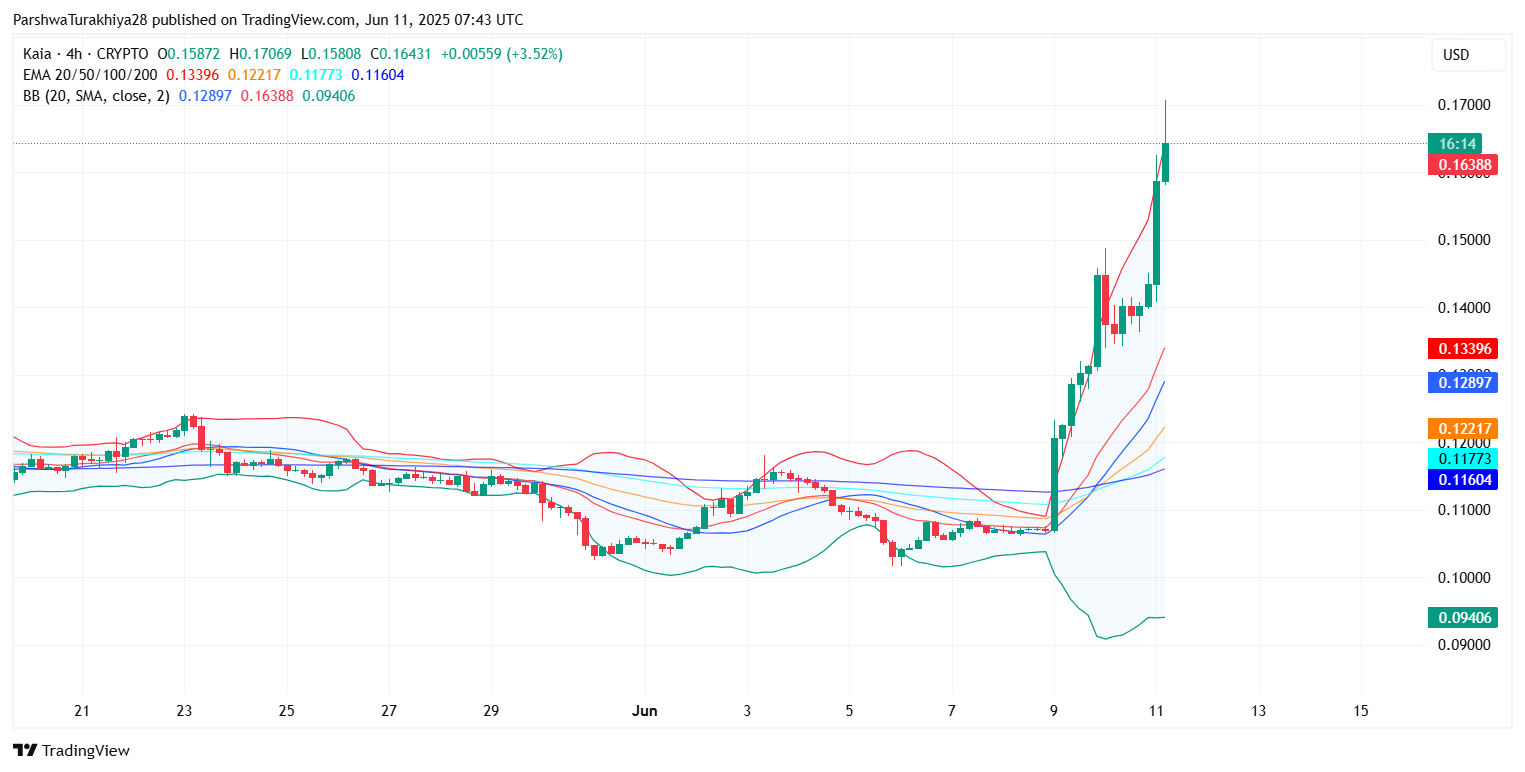
 Kaia’s 4-hour chart shows price well above its 20/50/100/200 EMA cluster, with the 20 EMA now rising sharply near $0.133. The distance between price and short-term EMAs highlights strong bullish momentum, but also points to the possibility of mean reversion.
 KAIA price dynamics (Source: TradingView)
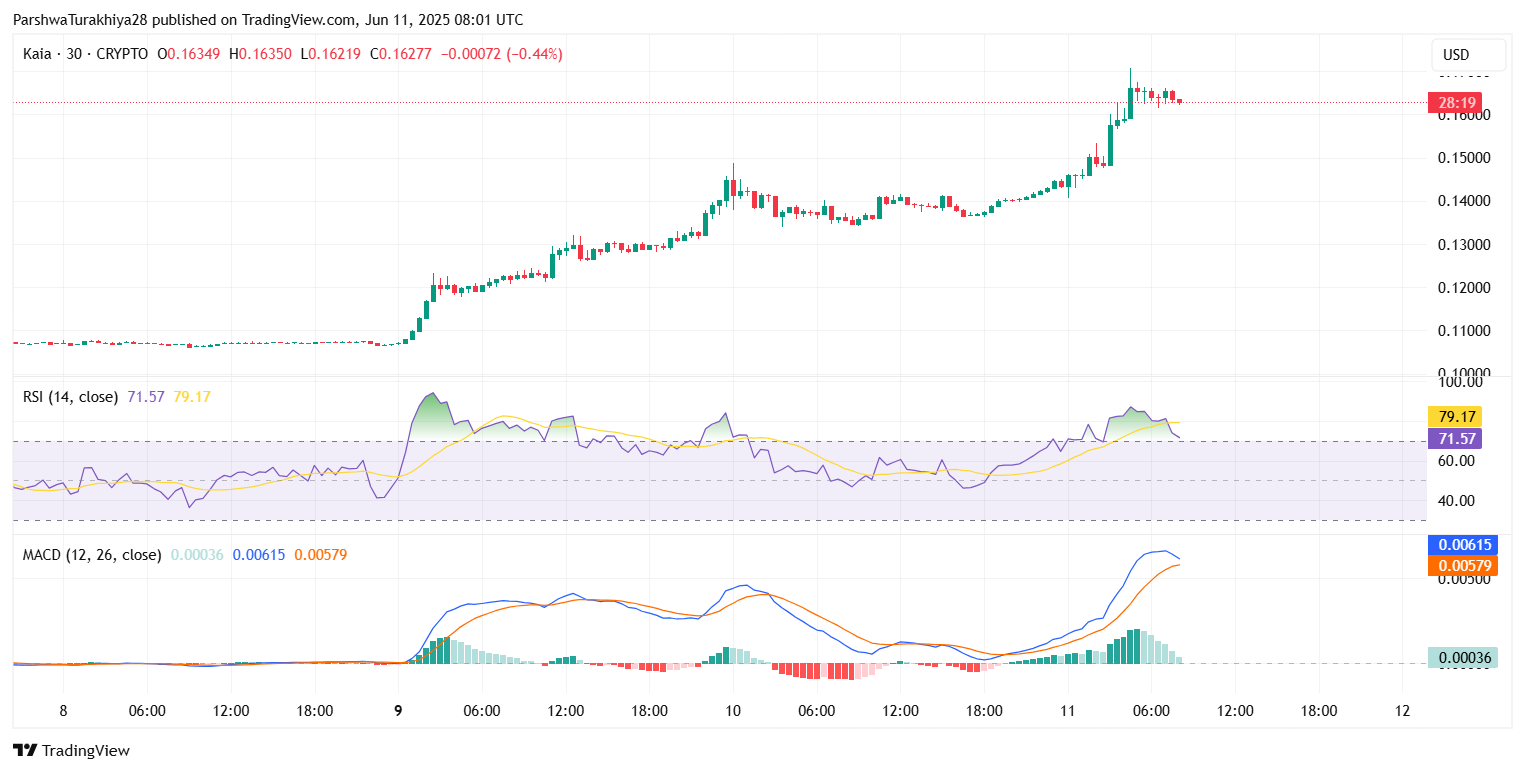
 On the 30-minute chart, the RSI is elevated at 71.5 and previously touched 79.1, placing Kaia in overbought territory. Meanwhile, the MACD histogram is flattening slightly, with the MACD and signal lines nearing convergence — suggesting momentum is peaking in the short term.
 KAIA price dynamics (Source: TradingView)
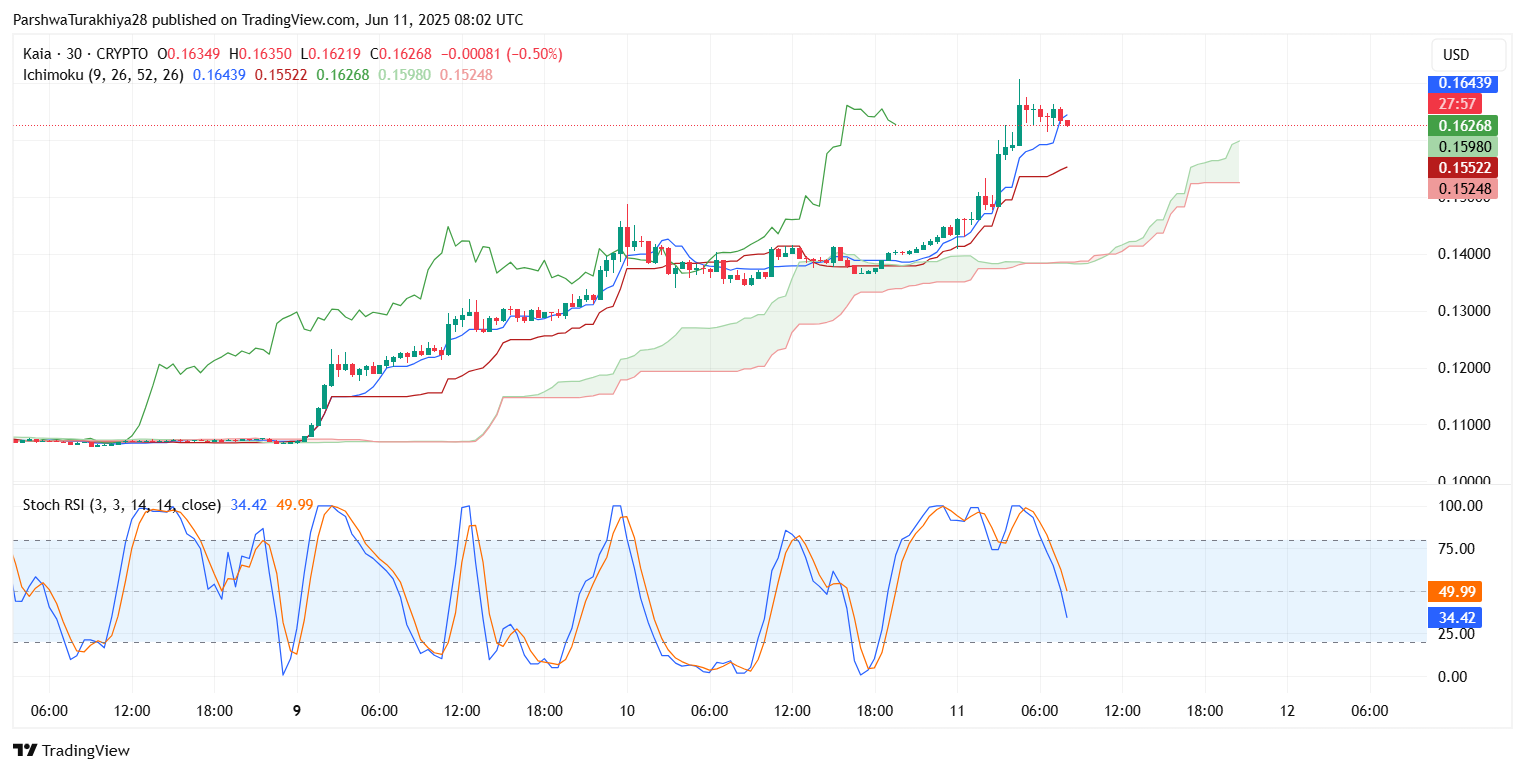
 The Ichimoku Cloud setup is still supportive, with price trading above the cloud and the Tenkan-Sen and Kijun-Sen maintaining upward trajectories. However, the cloud is beginning to narrow, signaling a potential slowdown in trend strength.
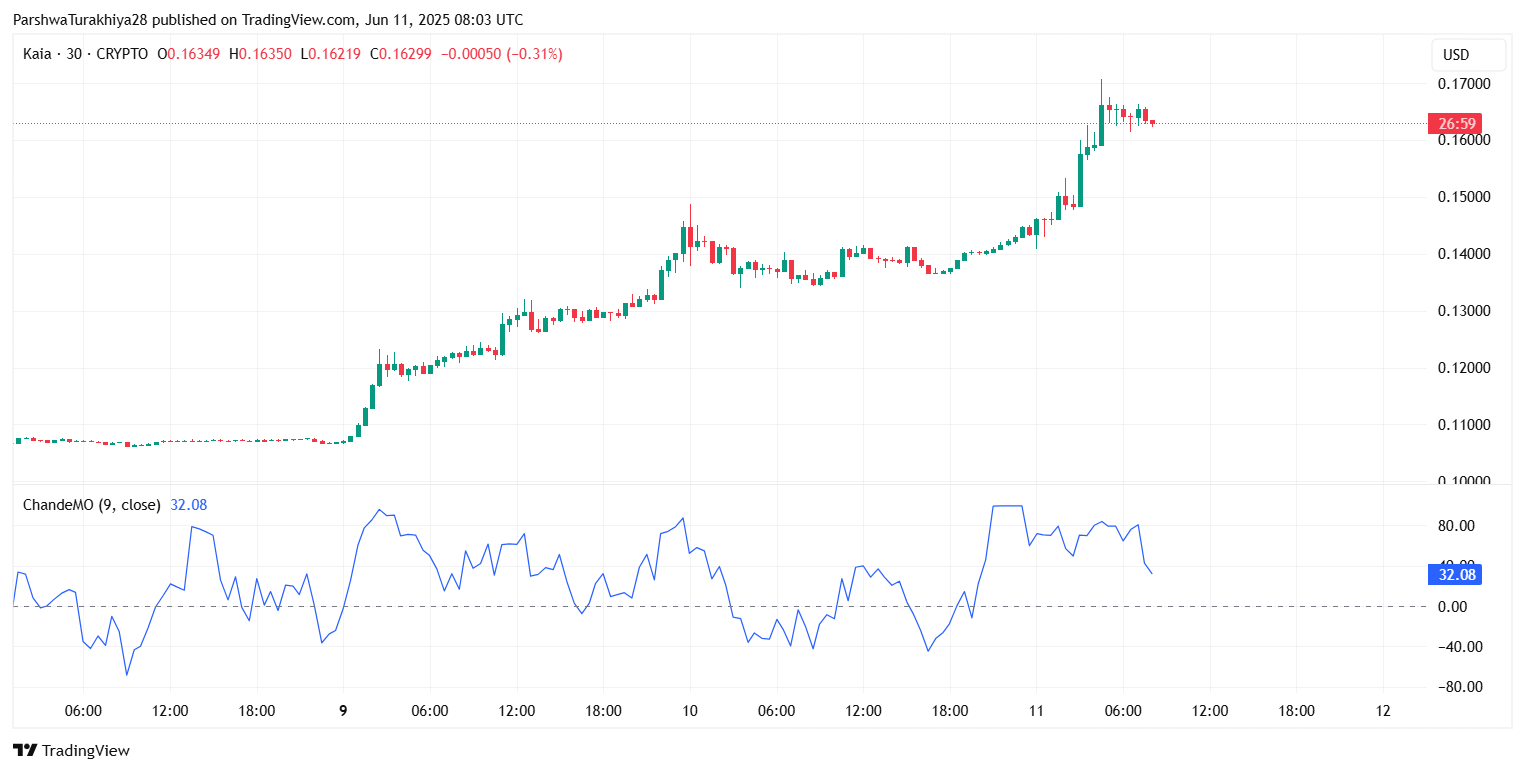
Stochastic RSI has dropped to 34.42 after a failed cross above the 50 level, indicating a possible cooldown phase unless bulls reclaim initiative. Similarly, the Chande Momentum Oscillator has slipped back toward 32 after a brief spike, suggesting that bullish strength may be fading intraday.
Why is the Kaia Price Going Up Today? Trendline Break and Demand Flip Trigger Bull Run
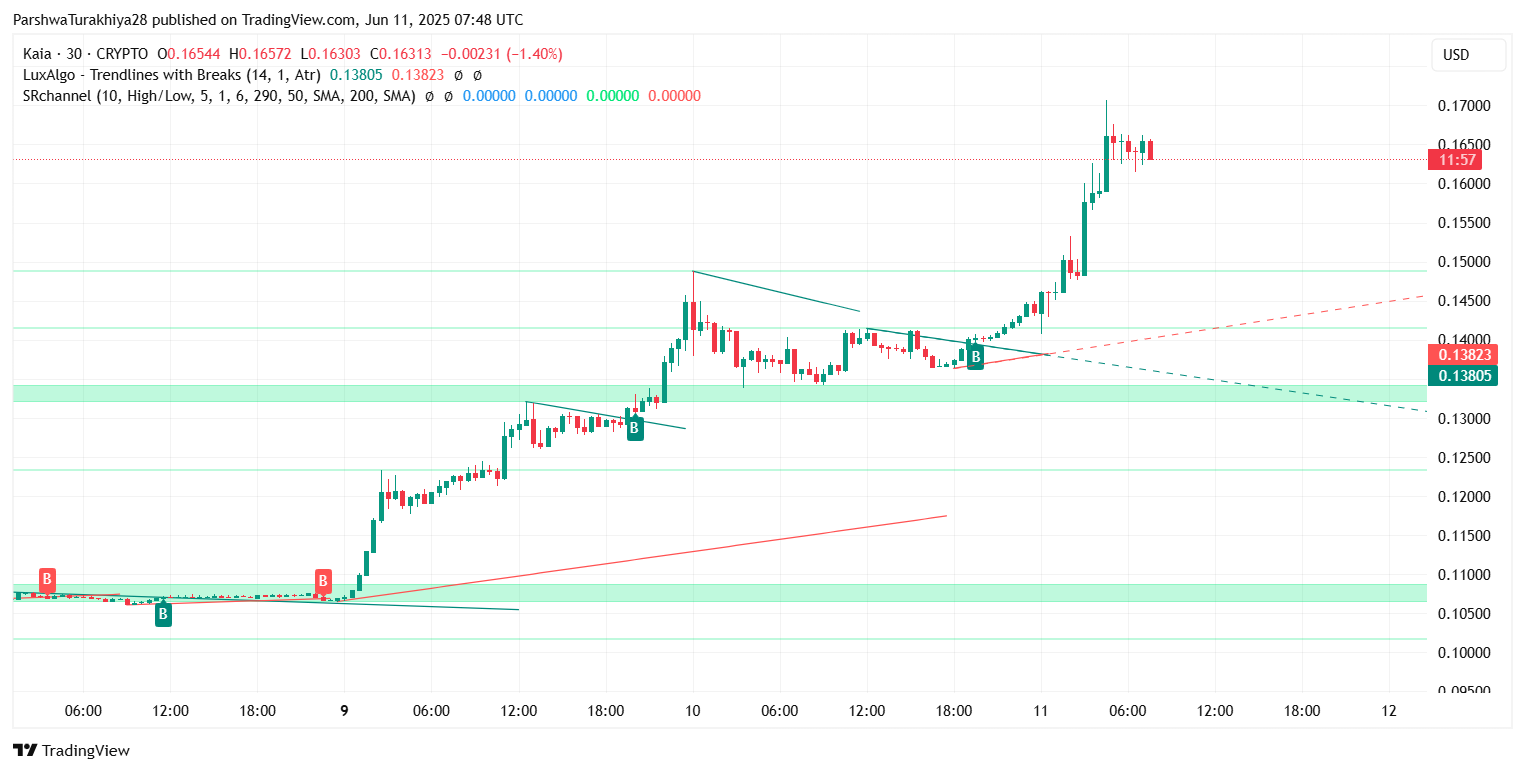
The core reason why Kaia price going up today lies in the confirmed breakout from both horizontal and descending trendline resistance. After several weeks of accumulation near $0.11, Kaia broke past $0.123 — a critical structural level — with strong follow-through, triggering stop runs and attracting new longs.
 KAIA price dynamics (Source: TradingView)
 The Chande Momentum reading, despite pulling back slightly, still holds positive territory, reflecting lingering bullish strength across timeframes.
This breakout has flipped all major resistance zones between $0.10 and $0.14 into fresh demand areas, as shown clearly on the 4-hour and 1-day structure charts. Volume expansion and Bollinger Band widening further support the view that this was a genuine bullish breakout rather than a short-lived squeeze.
Kaia Price Forecast for June 12
 KAIA price dynamics (Source: TradingView)
 Going forward, the Kaia price update suggests a possible consolidation phase above $0.16 before any renewed breakout. If price holds above $0.159–$0.162, bulls may attempt a push toward $0.175 and $0.19. Beyond that, the $0.23 region — a long-standing supply zone — could become the next target.
However, if profit-taking sets in and Kaia breaks below $0.155, a corrective move to $0.138 or even $0.123 becomes likely. The latter coincides with the breakout base and marks the most important support for bulls to defend to keep the structure intact.
With indicators mixed across timeframes and price stretched above key EMAs, traders should watch for a consolidation flag or wedge structure to form before taking new directional positions.
Kaia Price Forecast Table: June 12
| Indicator / Zone | Level (USD) | Signal |
| Resistance 1 | 0.1706 | Intraday spike high |
| Resistance 2 | 0.1900 | Next upside target zone |
| Support 1 | 0.1590 | Near-term support post-breakout |
| Support 2 | 0.1380 | Key support and breakout base |
| Support 3 | 0.1230 | Former resistance, major support |
| RSI (30-min) | 71.57 | Overbought, risk of cooldown |
| MACD (30-min) | Flattening | Early signs of weakening momentum |
| Stoch RSI (30-min) | 34.42 | Losing upside pressure |
| Ichimoku Cloud (30-min) | Bullish | Price above cloud, trend intact |
| Chande Momentum Oscillator | 32.08 | Positive, but slightly easing |
| Bollinger Bands (4H) | Expanding | Strong price volatility |
Disclaimer: The information presented in this article is for informational and educational purposes only. The article does not constitute financial advice or advice of any kind. Coin Edition is not responsible for any losses incurred as a result of the utilization of content, products, or services mentioned. Readers are advised to exercise caution before taking any action related to the company.