- Nasdaq’s 19b-4 filing marks a key step toward the first U.S. SUI spot ETF approval
- SUI holds $3.40 support as buying pressure builds near key resistance at $3.55
- MACD crossover and RSI at 53.5 point to rising bullish momentum for SUI price
SUI, the native token of the Sui blockchain, is making headlines again. This time, the catalyst is a major regulatory milestone: Nasdaq has filed a 19b-4 form with the U.S. Securities and Exchange Commission to list the 21Shares SUI ETF. This move officially begins the regulatory review process for the first U.S.-based spot ETF tied to SUI.
The filing builds on an earlier S-1 registration by 21Shares and follows successful ETF listings in European markets, including Paris and Amsterdam. The news is pushing market optimism higher, as investors anticipate broader access and growing institutional adoption.
How the SUI Price Is Reacting to the ETF News
SUI is currently trading at $3.50 , up 3.32% for the day. The price has displayed an upward trend, overcoming early-session volatility. After an initial dip, SUI surged to $3.55 before consolidating slightly. The intraday chart suggests consistent buying support, with higher lows forming throughout the day.
Support levels are holding strong. The $3.40 mark has repeatedly acted as a floor, while $3.43 provided a base for upward moves. On the resistance front, $3.55 remains a key hurdle. SUI briefly tested it before pulling back. Minor resistance also exists between $3.52 and $3.53, where the token faced multiple pauses.
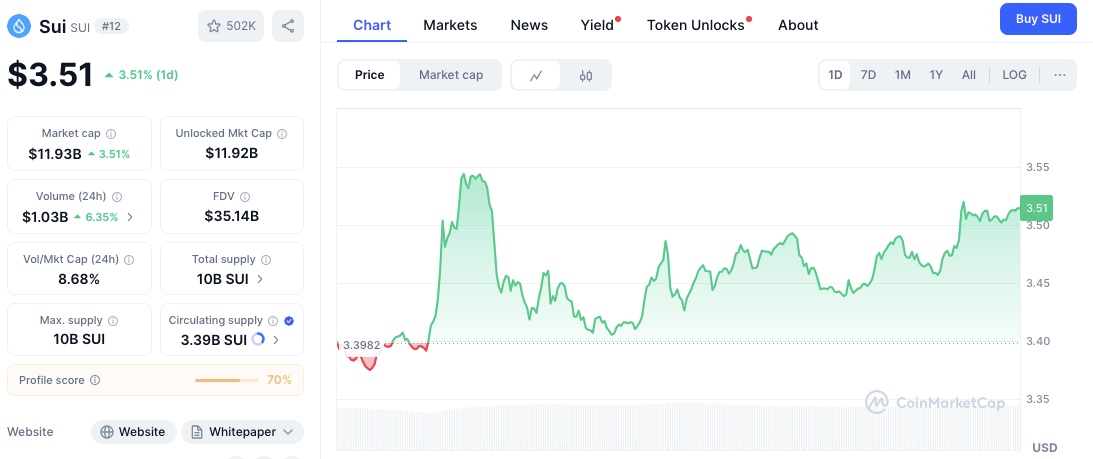 Source: CoinMarketCap
 Besides technical structure, trading volume rose 6.25% to $1.03 billion, supporting the bullish setup. If SUI breaks past $3.55 with conviction, it could test higher resistance levels and potentially shift into a stronger rally phase.
Related: Why SUI’s Rapid Growth Makes It a Key Player in the Upcoming Bull Cycle
What Key Indicators Are Saying About SUI’s Next Move
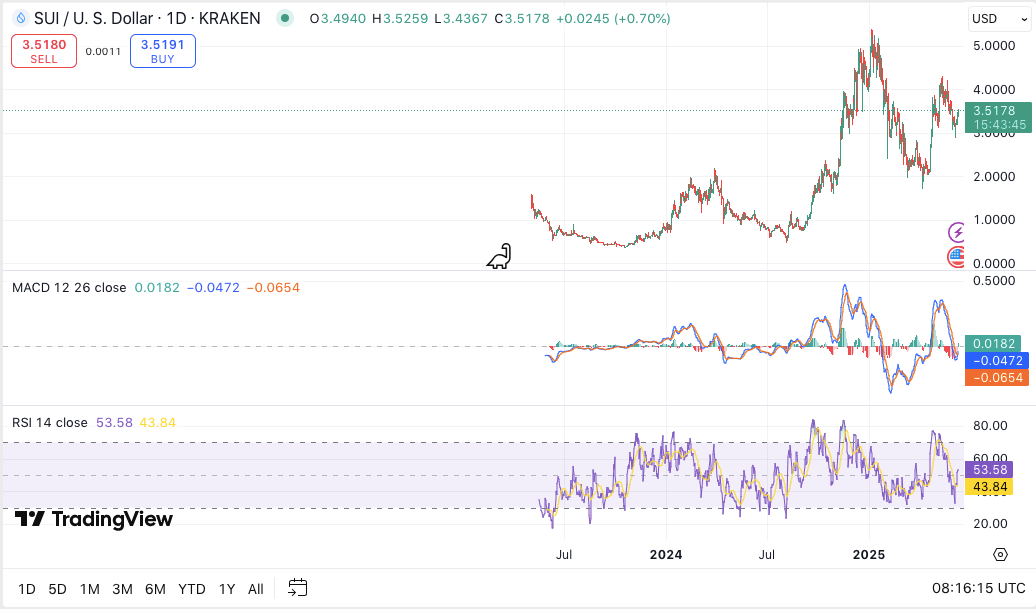 SUI/USD daily price chart, Source: TradingView
 The Moving Average Convergence Divergence (MACD) line recently crossed above its signal line. Though the histogram remains slightly negative, it is flattening, hinting at a potential trend reversal. This bullish crossover signals that recent selling pressure may be waning.
Related: SUI Price: Why the Latest Upgrade Could Be the Fuel for a Breakout Above $3.55
Meanwhile, the Relative Strength Index (RSI) sits at 53.50. This neutral position suggests room for more upside without risking overbought conditions. If RSI climbs above 60, the rally may strengthen further, indicating buyers are gaining control.
Disclaimer: The information presented in this article is for informational and educational purposes only. The article does not constitute financial advice or advice of any kind. Coin Edition is not responsible for any losses incurred as a result of the utilization of content, products, or services mentioned. Readers are advised to exercise caution before taking any action related to the company.